After dropping over K in just a day, the bitcoin price now faces a critical support level. Technical Analysis After failing to close a daily candle above K on January 4 (Tuesday), and following the global markets plunge, the BTC price dropped to .5K on Bitstamp. Over the past hours, bitcoin has been trading in the range of -43.5K. The -42K zone has been a reliable support level for the recent weeks, and so far, BTC has maintained this range. All in all, the low demand in the spot markets may set the stage for bitcoin to test lower prices, even in the form of wicks. A bearish signal popped after bitcoin lost the mid-term trendline and the 100-day EMA line (on December 3). Therefore, to regain confidence in a midterm recovery, bitcoin must first stabilize above
Topics:
CryptoVizArt considers the following as important: Bitcoin (BTC) Price, BTC Analysis, BTCEUR, BTCGBP, btcusd, btcusdt
This could be interesting, too:
Chayanika Deka writes XRP, SOL, and ADA Inclusion in US Crypto Reserve Pushes Traders on Edge
Chayanika Deka writes Why Arthur Hayes Is Bullish on Bitcoin Under Trump’s Economic Strategy
Mandy Williams writes Why the Bitcoin Market Is Stuck—and the Key Metric That Could Change It: CryptoQuant CEO
Wayne Jones writes Metaplanet Acquires 156 BTC, Bringing Total Holdings to 2,391
After dropping over $4K in just a day, the bitcoin price now faces a critical support level.
Technical Analysis
After failing to close a daily candle above $48K on January 4 (Tuesday), and following the global markets plunge, the BTC price dropped to $42.5K on Bitstamp.
Over the past hours, bitcoin has been trading in the range of $42-43.5K. The $40-42K zone has been a reliable support level for the recent weeks, and so far, BTC has maintained this range.
All in all, the low demand in the spot markets may set the stage for bitcoin to test lower prices, even in the form of wicks. A bearish signal popped after bitcoin lost the mid-term trendline and the 100-day EMA line (on December 3). Therefore, to regain confidence in a midterm recovery, bitcoin must first stabilize above the 100-day EMA line.
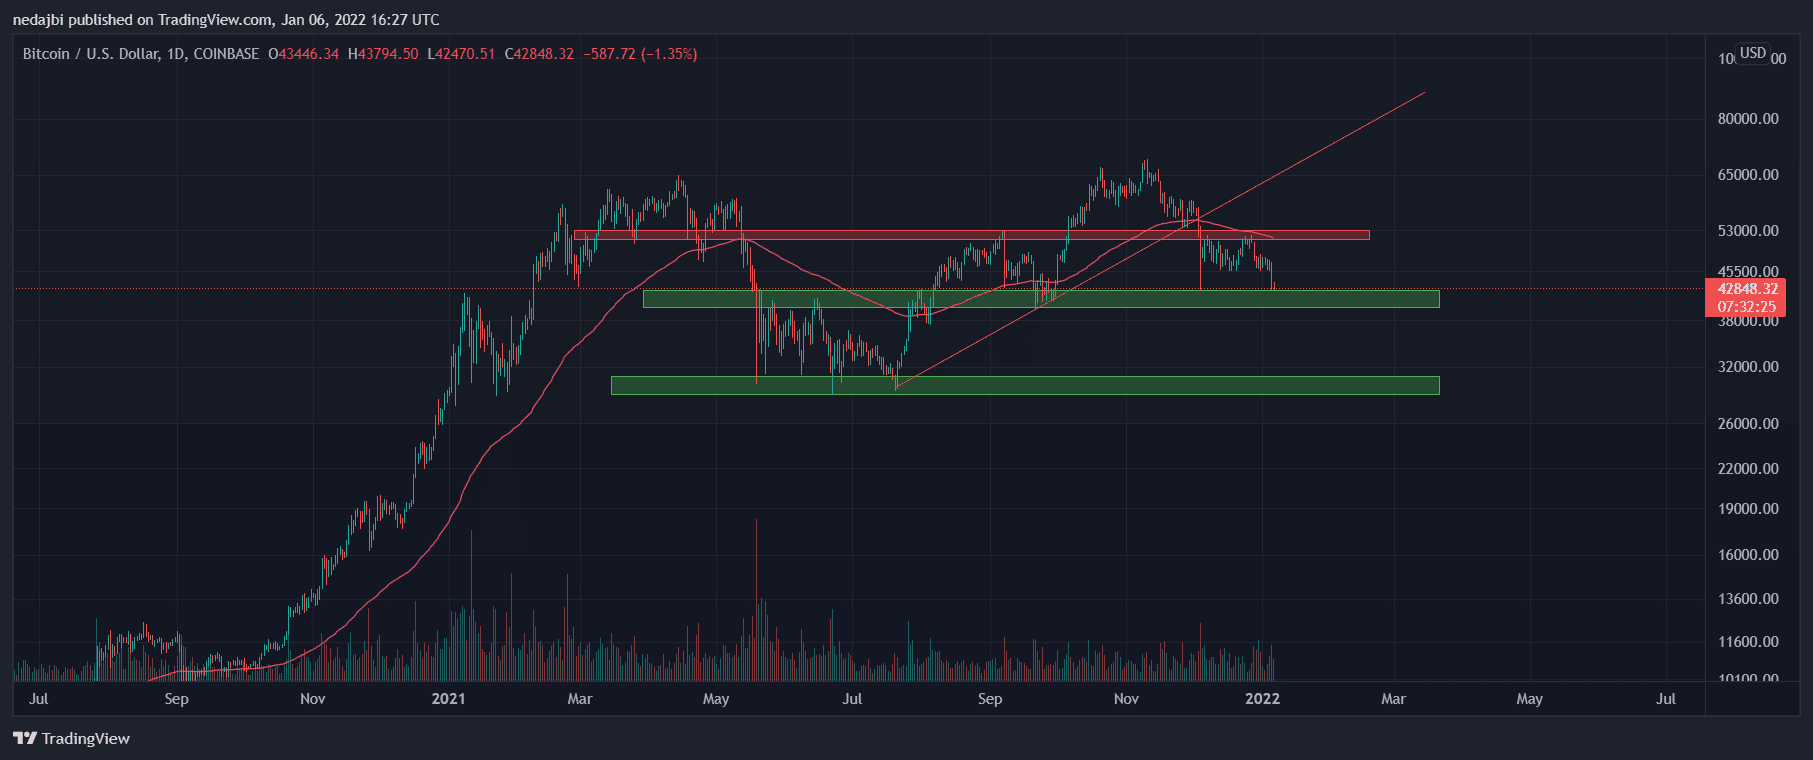
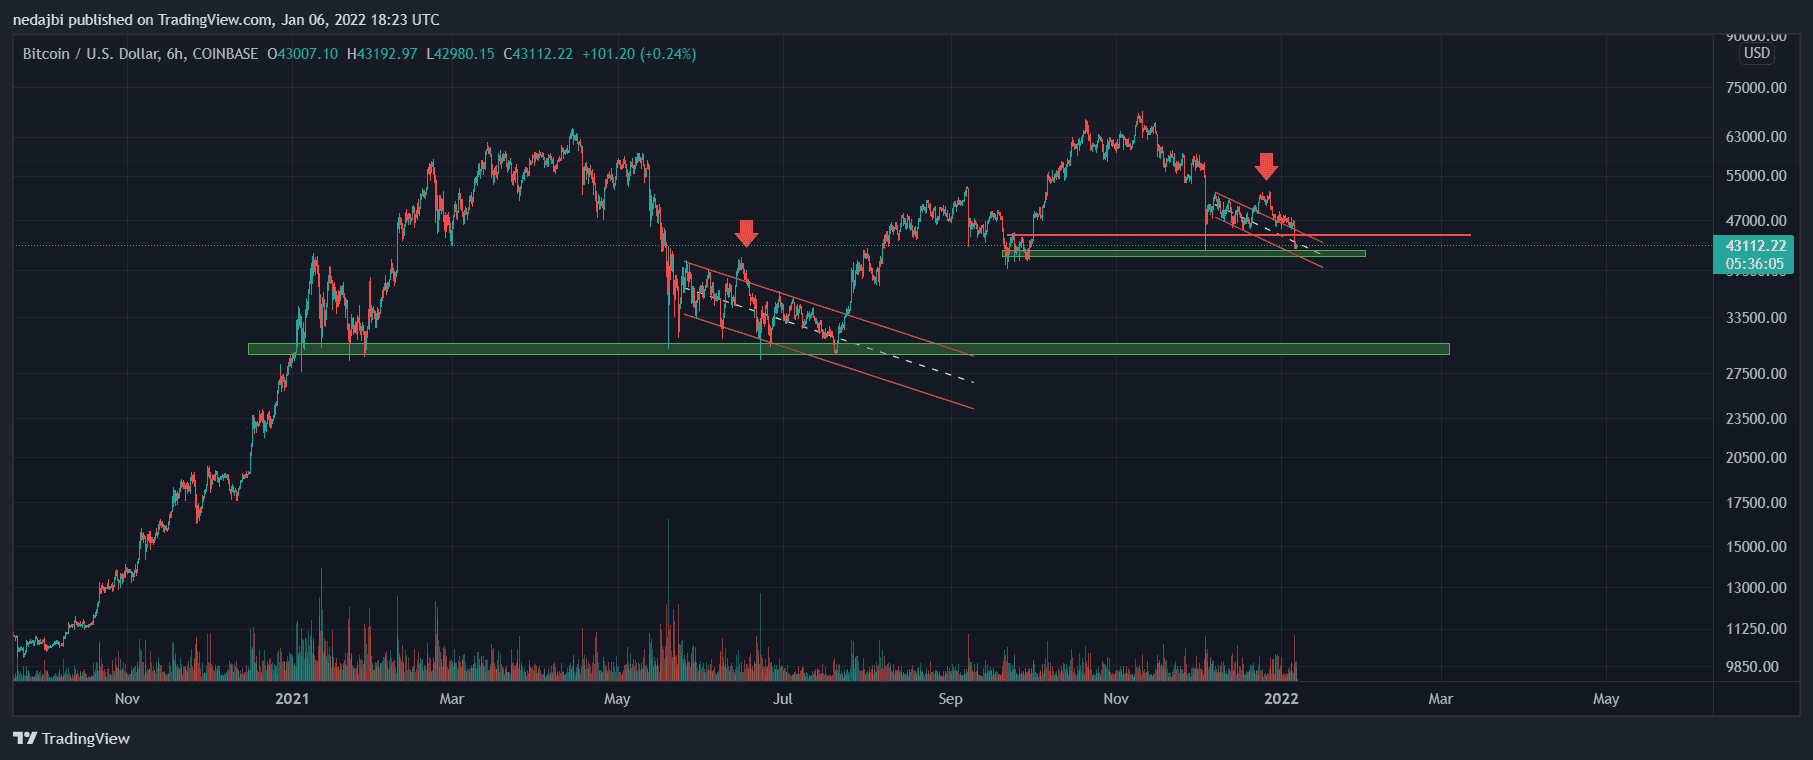
BTC has been trading in a descending channel since December. During the last week of 2021, bitcoin broke out of this channel but could not stabilize above the $52K level and dropped back inside the channel.
From a technical analyst’s point of view, this pattern is called a fake breakout. On the 6-hour time frame, a similar fake breakout took place through the May – July 2021 correction while the market was consolidating in the $29K-31K range.
Currently, bitcoin may target the upper channel line, which lies at $45K, then if the selling pressure is rising, the $40k-42K zone will likely get retested once again.
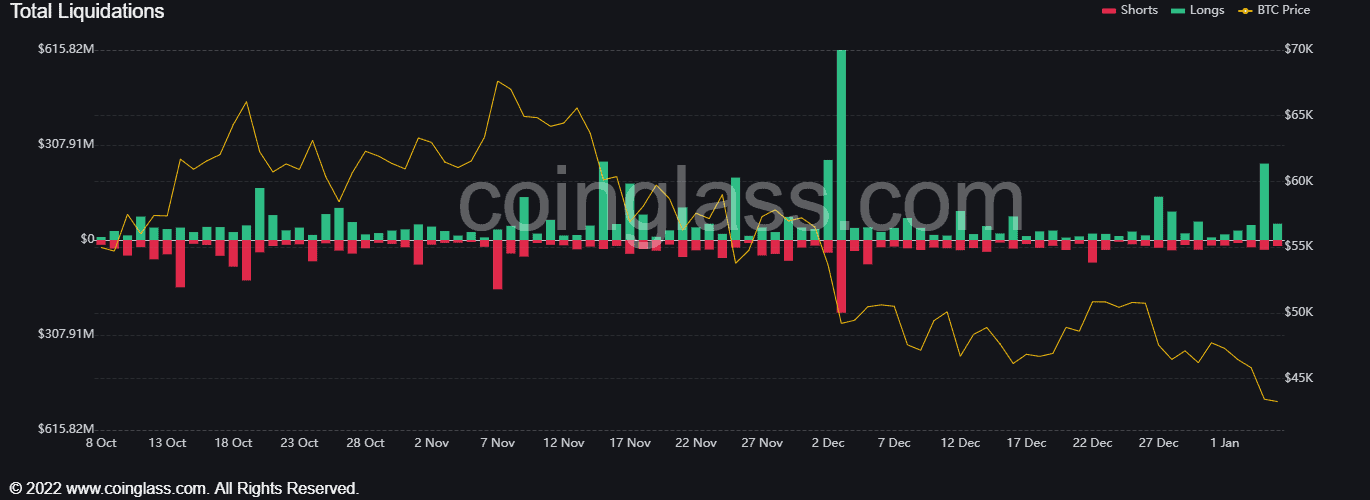
Futures Market Analysis
The price volatility on January 4 – 5 led to a liquidation event of approximately $300M and $50M of long and short contracts in the perpetual markets.
Interestingly, this substantial liquidation volume has not reduced much the open interest in the futures markets. Therefore, we can expect to see more volatility in the coming days.