Despite the relatively positive technical structure in the short time frame and the early signs for a bullish sentiment in the futures market, the macro factors are still acting as a source of uncertainty. Technical Analysis By: Edris Long-Term Bitcoin’s price is still consolidating above the k mark. Last week, it was rejected by the k area, making a pullback towards the broken 50-day moving average. The 50-day MA successfully supported the price, pushing it towards the k level once again, which is the first significant static resistance. The following key resistance would be the 100-day MA, which could hold the price and trigger a correction in the short term. The 50-day MA and the k-k area remain critical supports and could be bullish turning points if a
Topics:
CryptoVizArt considers the following as important: Bitcoin (BTC) Price, BTC Analysis, BTCEUR, BTCGBP, btcusd, btcusdt
This could be interesting, too:
Mandy Williams writes Bitcoin ETFs Record Over .6B in Outflows in the Past 2 Weeks
Chayanika Deka writes Bitcoin Whales Offload 6,813 BTC as Selling Pressure Mounts
Wayne Jones writes Bitcoin Sentiment Hits 2022 Lows as Fear & Greed Index Falls to 10
Jordan Lyanchev writes Bitcoin Falls Below K for the First Time in 3 Months, How Much Lower Can It Go?
Despite the relatively positive technical structure in the short time frame and the early signs for a bullish sentiment in the futures market, the macro factors are still acting as a source of uncertainty.
Technical Analysis
By: Edris
Long-Term
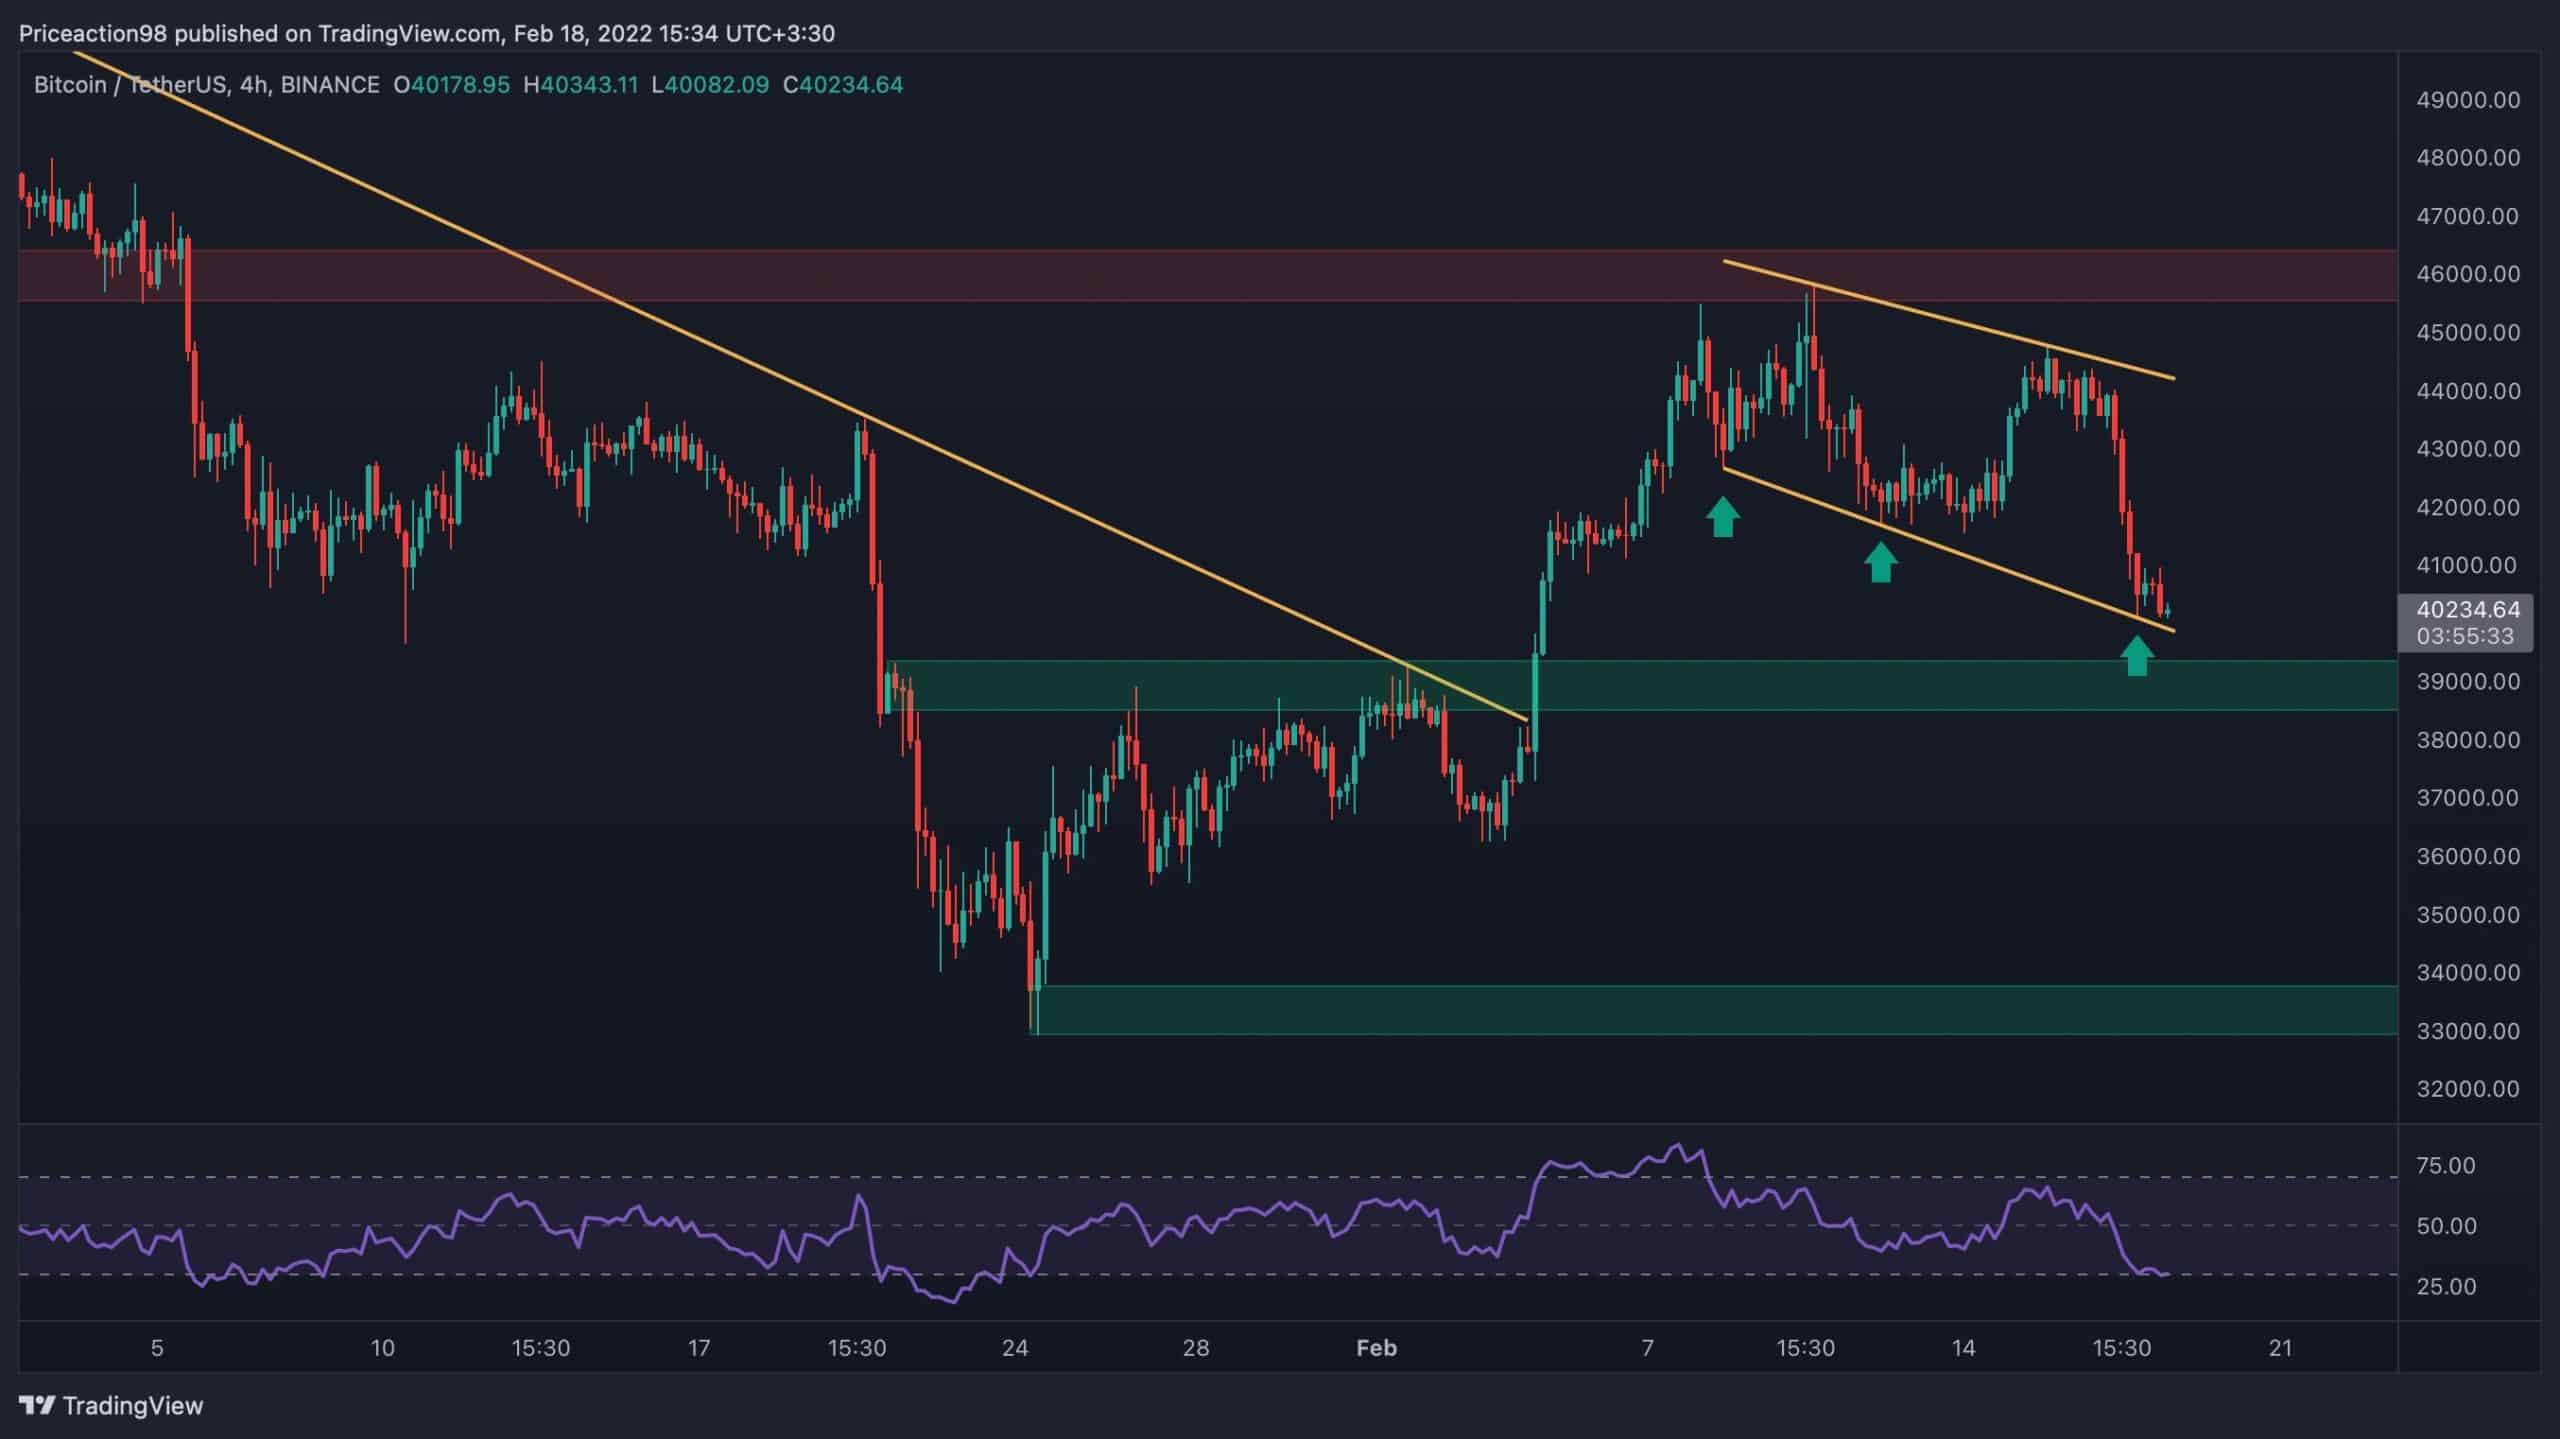
Bitcoin’s price is still consolidating above the $40k mark. Last week, it was rejected by the $46k area, making a pullback towards the broken 50-day moving average.
The 50-day MA successfully supported the price, pushing it towards the $46k level once again, which is the first significant static resistance. The following key resistance would be the 100-day MA, which could hold the price and trigger a correction in the short term. The 50-day MA and the $39k-$40k area remain critical supports and could be bullish turning points if a price correction occurs.

Short-Term
On the 4-hour timeframe, the price is currently testing the lower trendline of the pattern for the third time. If this area holds, a rally towards the $45k zone would be expected. However, if the pattern fails, a drop to $38k or even lower would be the most probable scenario. Additionally, RSI is entering the oversold area, indicating that a local bottom or consolidation could be near.
Futures Sentiment Analysis
By: Edris
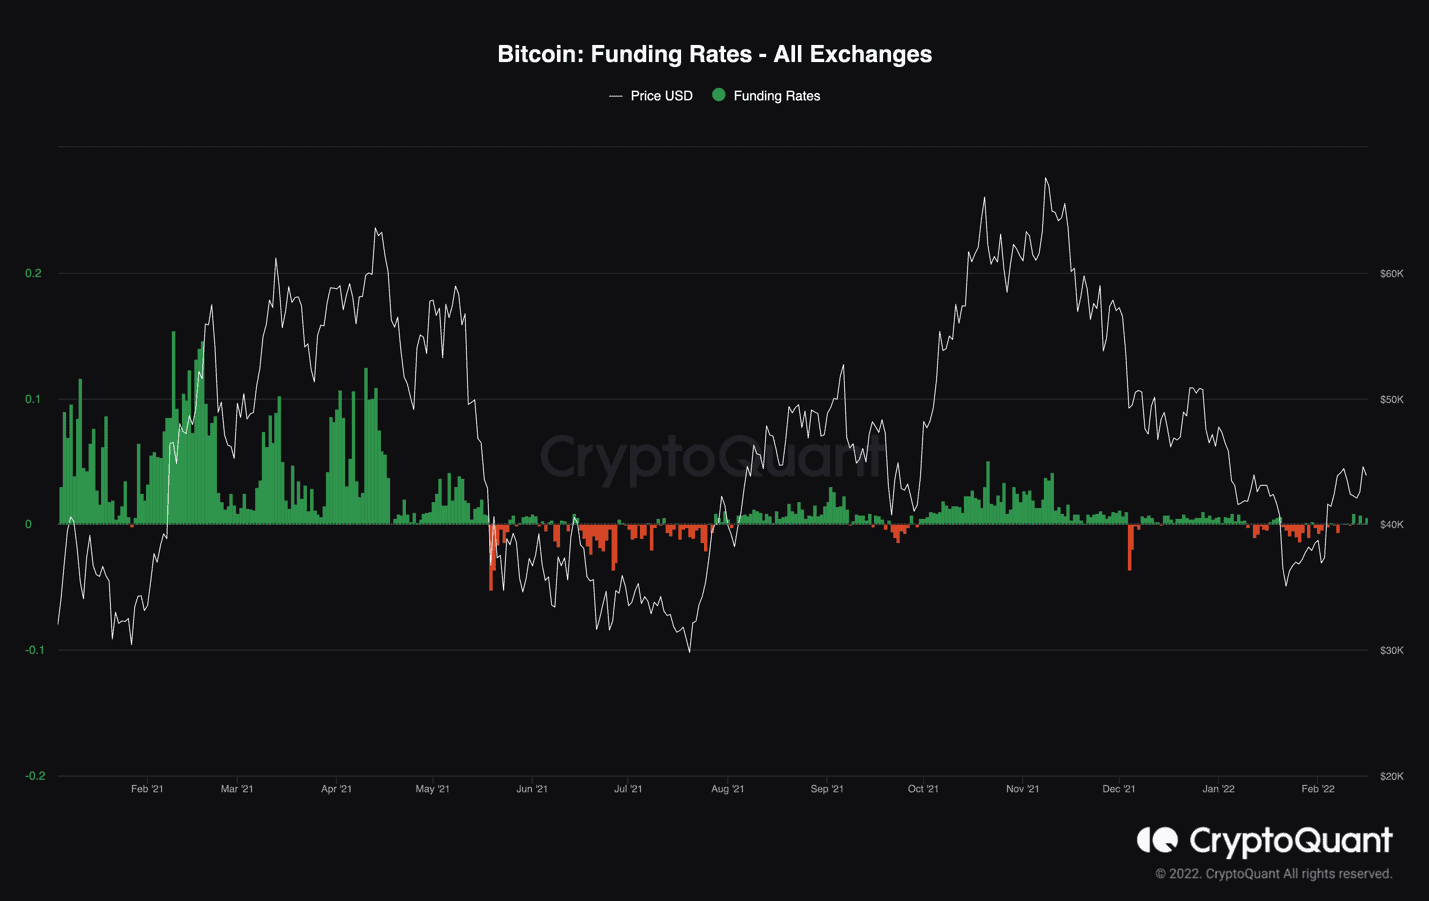
Funding rates have been turning positive in the past few days, after a period of negative values. This optimism appears irrational because a potential war is boiling between Russia and Ukraine, and the rumours about the fed are taking a 50 basis point rate hike instead of 25.
Additionally, many bears getting liquidated in the current rally also played a considerable part in painting the funding rates green. However, comparing the current state of the market to that of June 2021, there may be another drop in the short term to liquidate the impatient bulls and overleveraged speculators.