Bitcoin has been supported by the dynamic and static support levels on the daily frame. However, from an onchain perspective, the intensity of whale activities is signalling a possible sell pressure in short term. It remains to be seen if it can be absorbed by the buyers and seeing bitcoin breaking above the next major resistance around K. Technical Analysis By: Shayan Long-Term Bitcoin has been supported by the 100-day moving average and the K-K support zone simultaneously. The next major resistance area will be the K zone and the 200-day moving average. A new all-time high will become more probable if Bitcoin successfully breaks and consolidates above these two levels. Chart by TradingViewShort-Term On the 4H time frame, the price is currently testing a major
Topics:
CryptoVizArt considers the following as important: Bitcoin (BTC) Price, BTC Analysis, BTCEUR, BTCGBP, btcusd, btcusdt
This could be interesting, too:
Mandy Williams writes Bitcoin ETFs Record Over .6B in Outflows in the Past 2 Weeks
Chayanika Deka writes Bitcoin Whales Offload 6,813 BTC as Selling Pressure Mounts
Wayne Jones writes Bitcoin Sentiment Hits 2022 Lows as Fear & Greed Index Falls to 10
Jordan Lyanchev writes Bitcoin Falls Below K for the First Time in 3 Months, How Much Lower Can It Go?
Bitcoin has been supported by the dynamic and static support levels on the daily frame. However, from an onchain perspective, the intensity of whale activities is signalling a possible sell pressure in short term. It remains to be seen if it can be absorbed by the buyers and seeing bitcoin breaking above the next major resistance around $48K.
Technical Analysis
By: Shayan
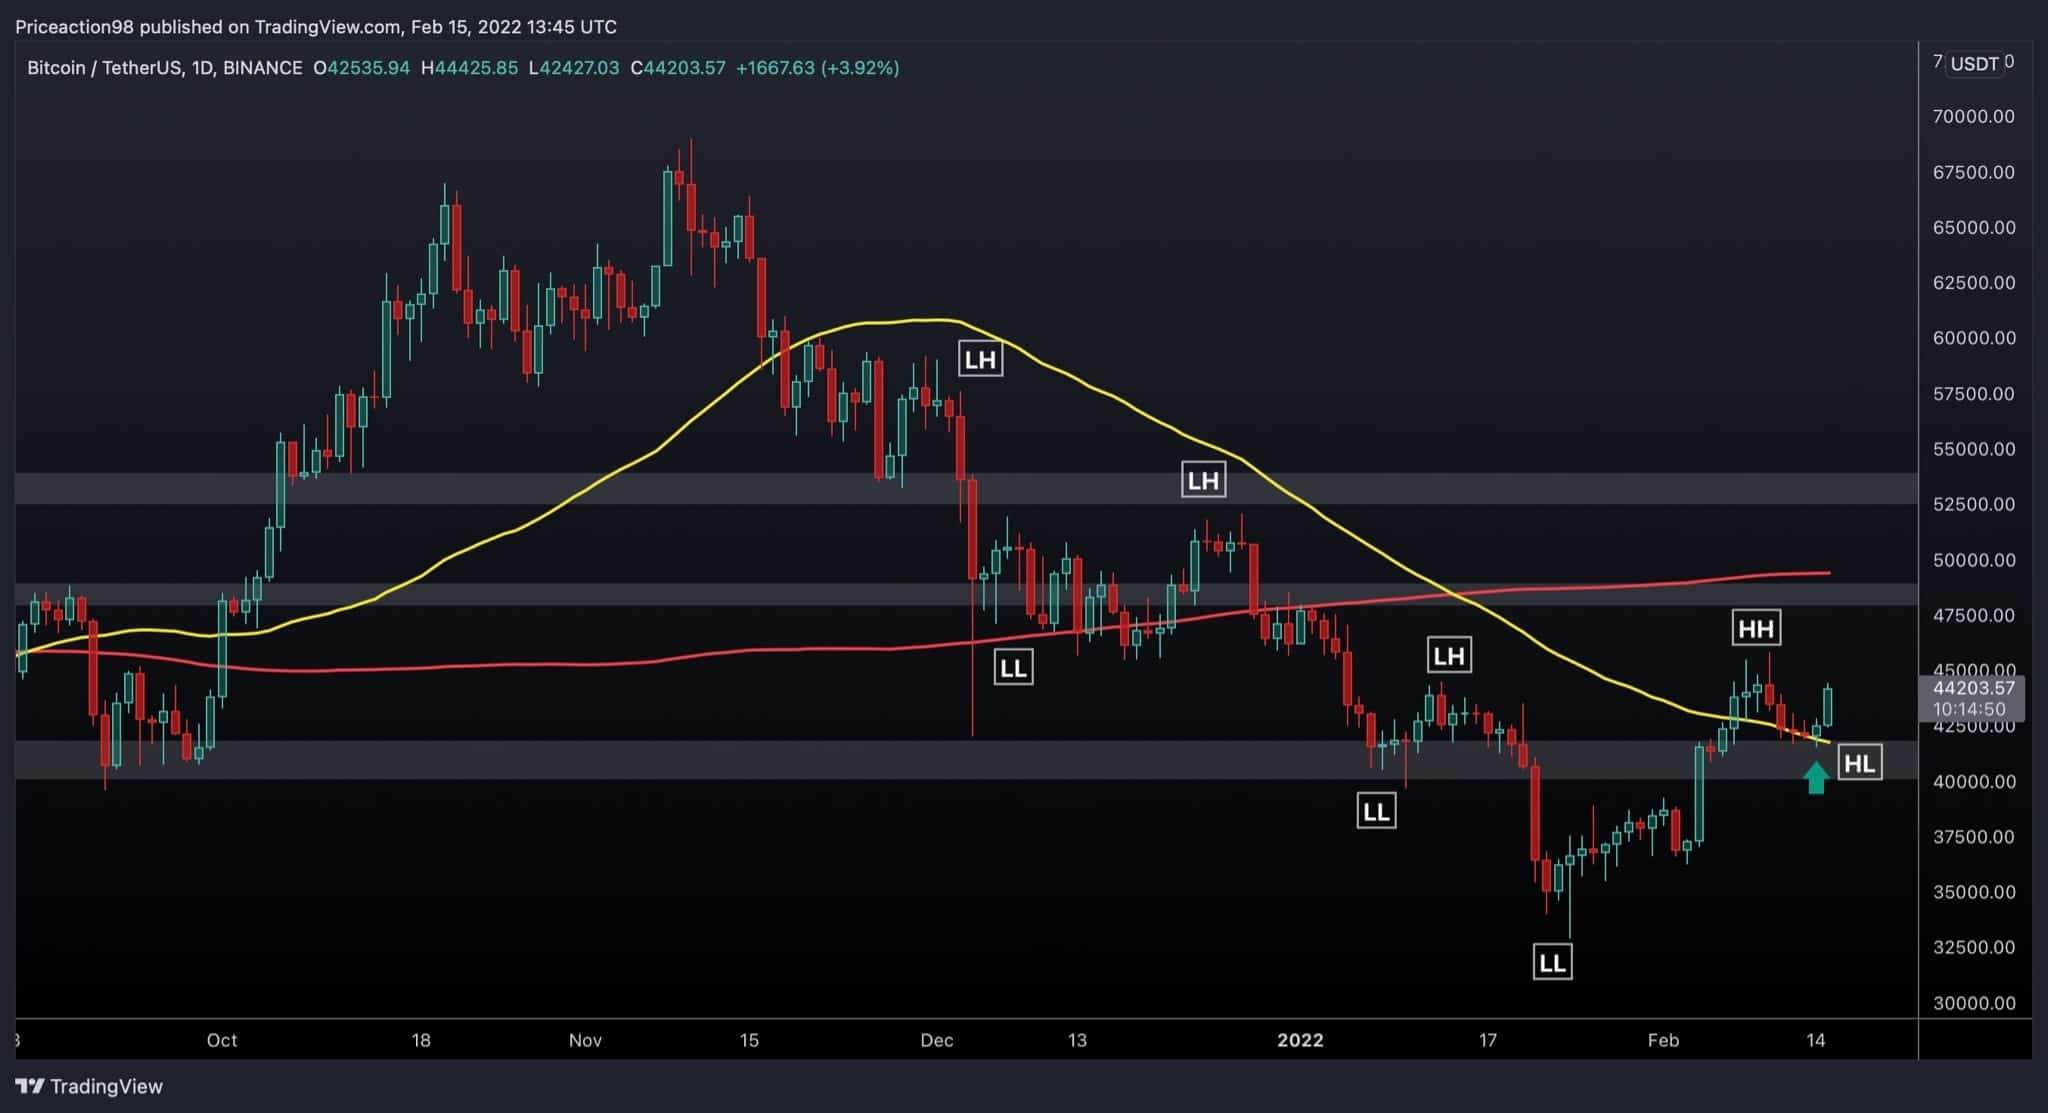
Long-Term
Bitcoin has been supported by the 100-day moving average and the $40K-$42K support zone simultaneously. The next major resistance area will be the $48K zone and the 200-day moving average. A new all-time high will become more probable if Bitcoin successfully breaks and consolidates above these two levels.
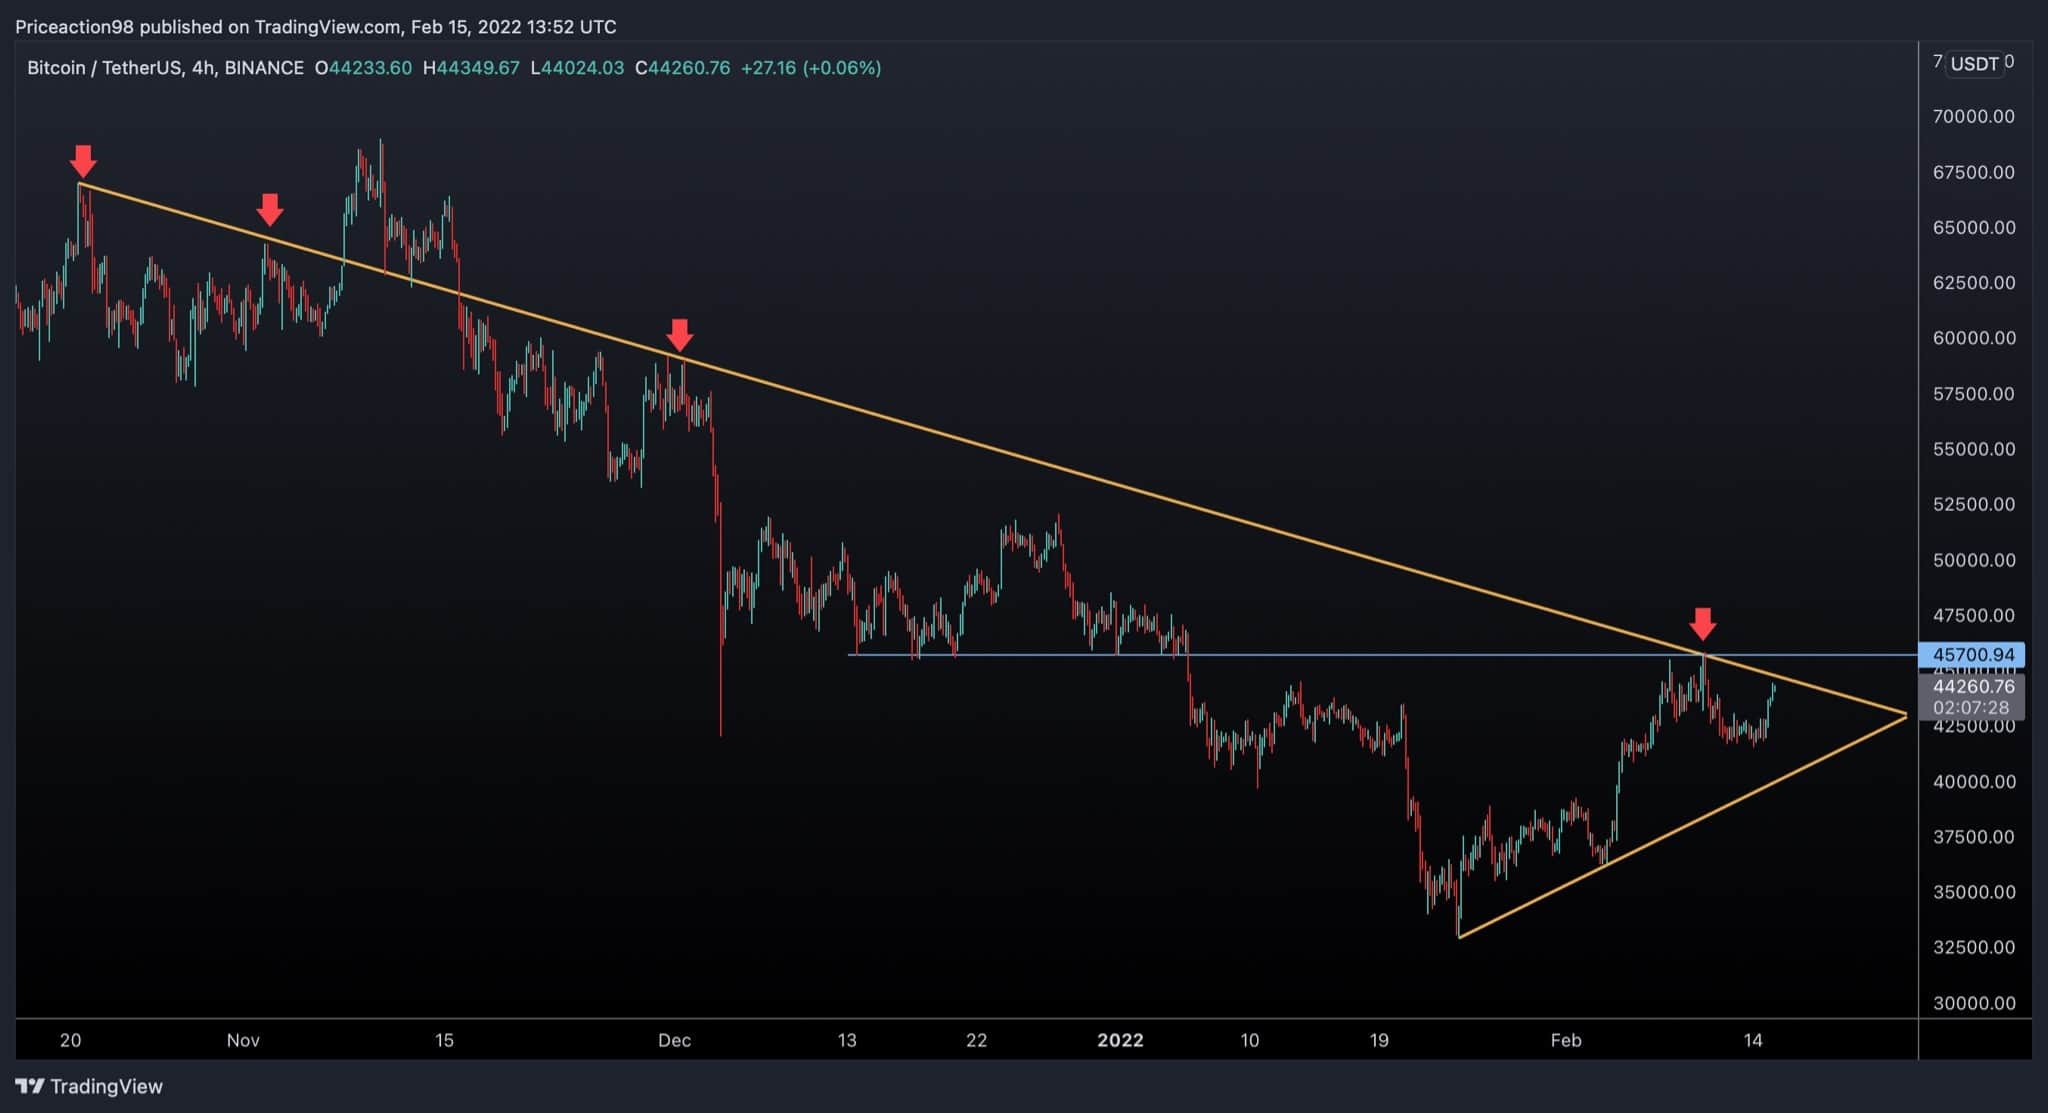
Short-Term
On the 4H time frame, the price is currently testing a major bearish trendline. If it can break this trendline, the next short-term resistance will be the $45.7K level (Blue horizontal line). However, a pullback to the demonstrated bullish trendline is expected if the price is rejected from the mentioned levels. A breakdown from the ascending line may cause BTC to drop deeper and test the $33K bottom.
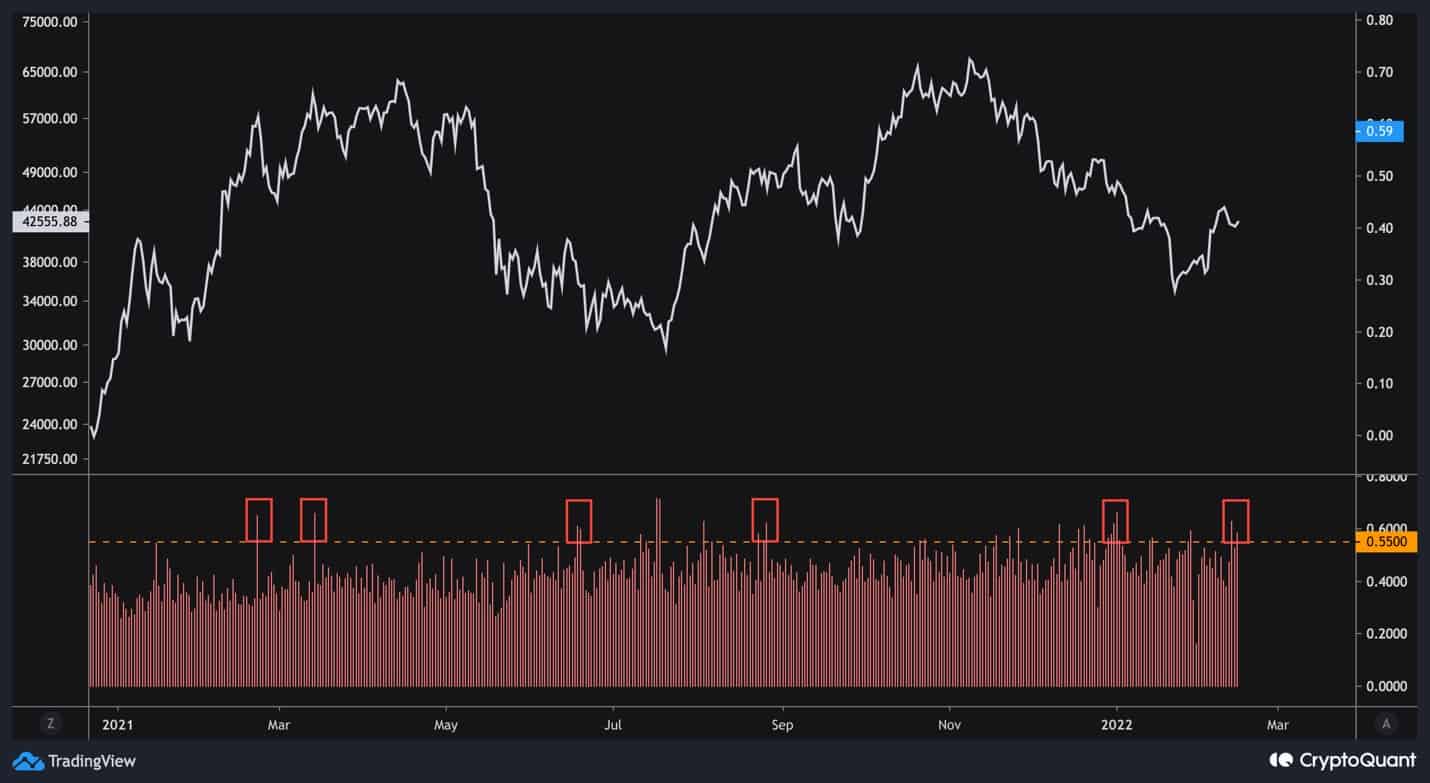
Onchain Analysis
By: Edris
Historically, high values of the whale ratio metric have led to a price correction. It is calculated by dividing bitcoin’s top 10 inflows to exchanges by all the inflows in a day. In this situation, we can conclude that the whales are depositing BTC to exchanges rapidly, and a correction is highly probable. In the last couple of days, the Whale Ratio has spiked – a bearish signal for the short term.