Bitcoin continues to print minor daily fluctuations as the price consolidates inside a tight range with low volatility. Currently, the price is testing a significant resistance area, and in case a rejection takes place – BTC is likely to retest lower-price areas. On the other hand, a breakout could lead to a mini-rally. Technical Analysis By Shayan The Daily Chart Bitcoin has failed to sustain above the 50-day and 100-day moving averages over the last few months. Most recently, the price got rejected from the 50-day moving average at K and has declined since then. However, it attempts to break above the 50-day moving average again. Despite the ongoing struggle with the 50-day MA, the price momentum is not promising, as the overall activity and demand are at low levels.
Topics:
CryptoVizArt considers the following as important: Bitcoin (BTC) Price, BTC Analysis, BTCEUR, BTCGBP, btcusd, btcusdt
This could be interesting, too:
Chayanika Deka writes XRP, SOL, and ADA Inclusion in US Crypto Reserve Pushes Traders on Edge
Chayanika Deka writes Why Arthur Hayes Is Bullish on Bitcoin Under Trump’s Economic Strategy
Mandy Williams writes Why the Bitcoin Market Is Stuck—and the Key Metric That Could Change It: CryptoQuant CEO
Wayne Jones writes Metaplanet Acquires 156 BTC, Bringing Total Holdings to 2,391
Bitcoin continues to print minor daily fluctuations as the price consolidates inside a tight range with low volatility. Currently, the price is testing a significant resistance area, and in case a rejection takes place – BTC is likely to retest lower-price areas. On the other hand, a breakout could lead to a mini-rally.
Technical Analysis
By Shayan
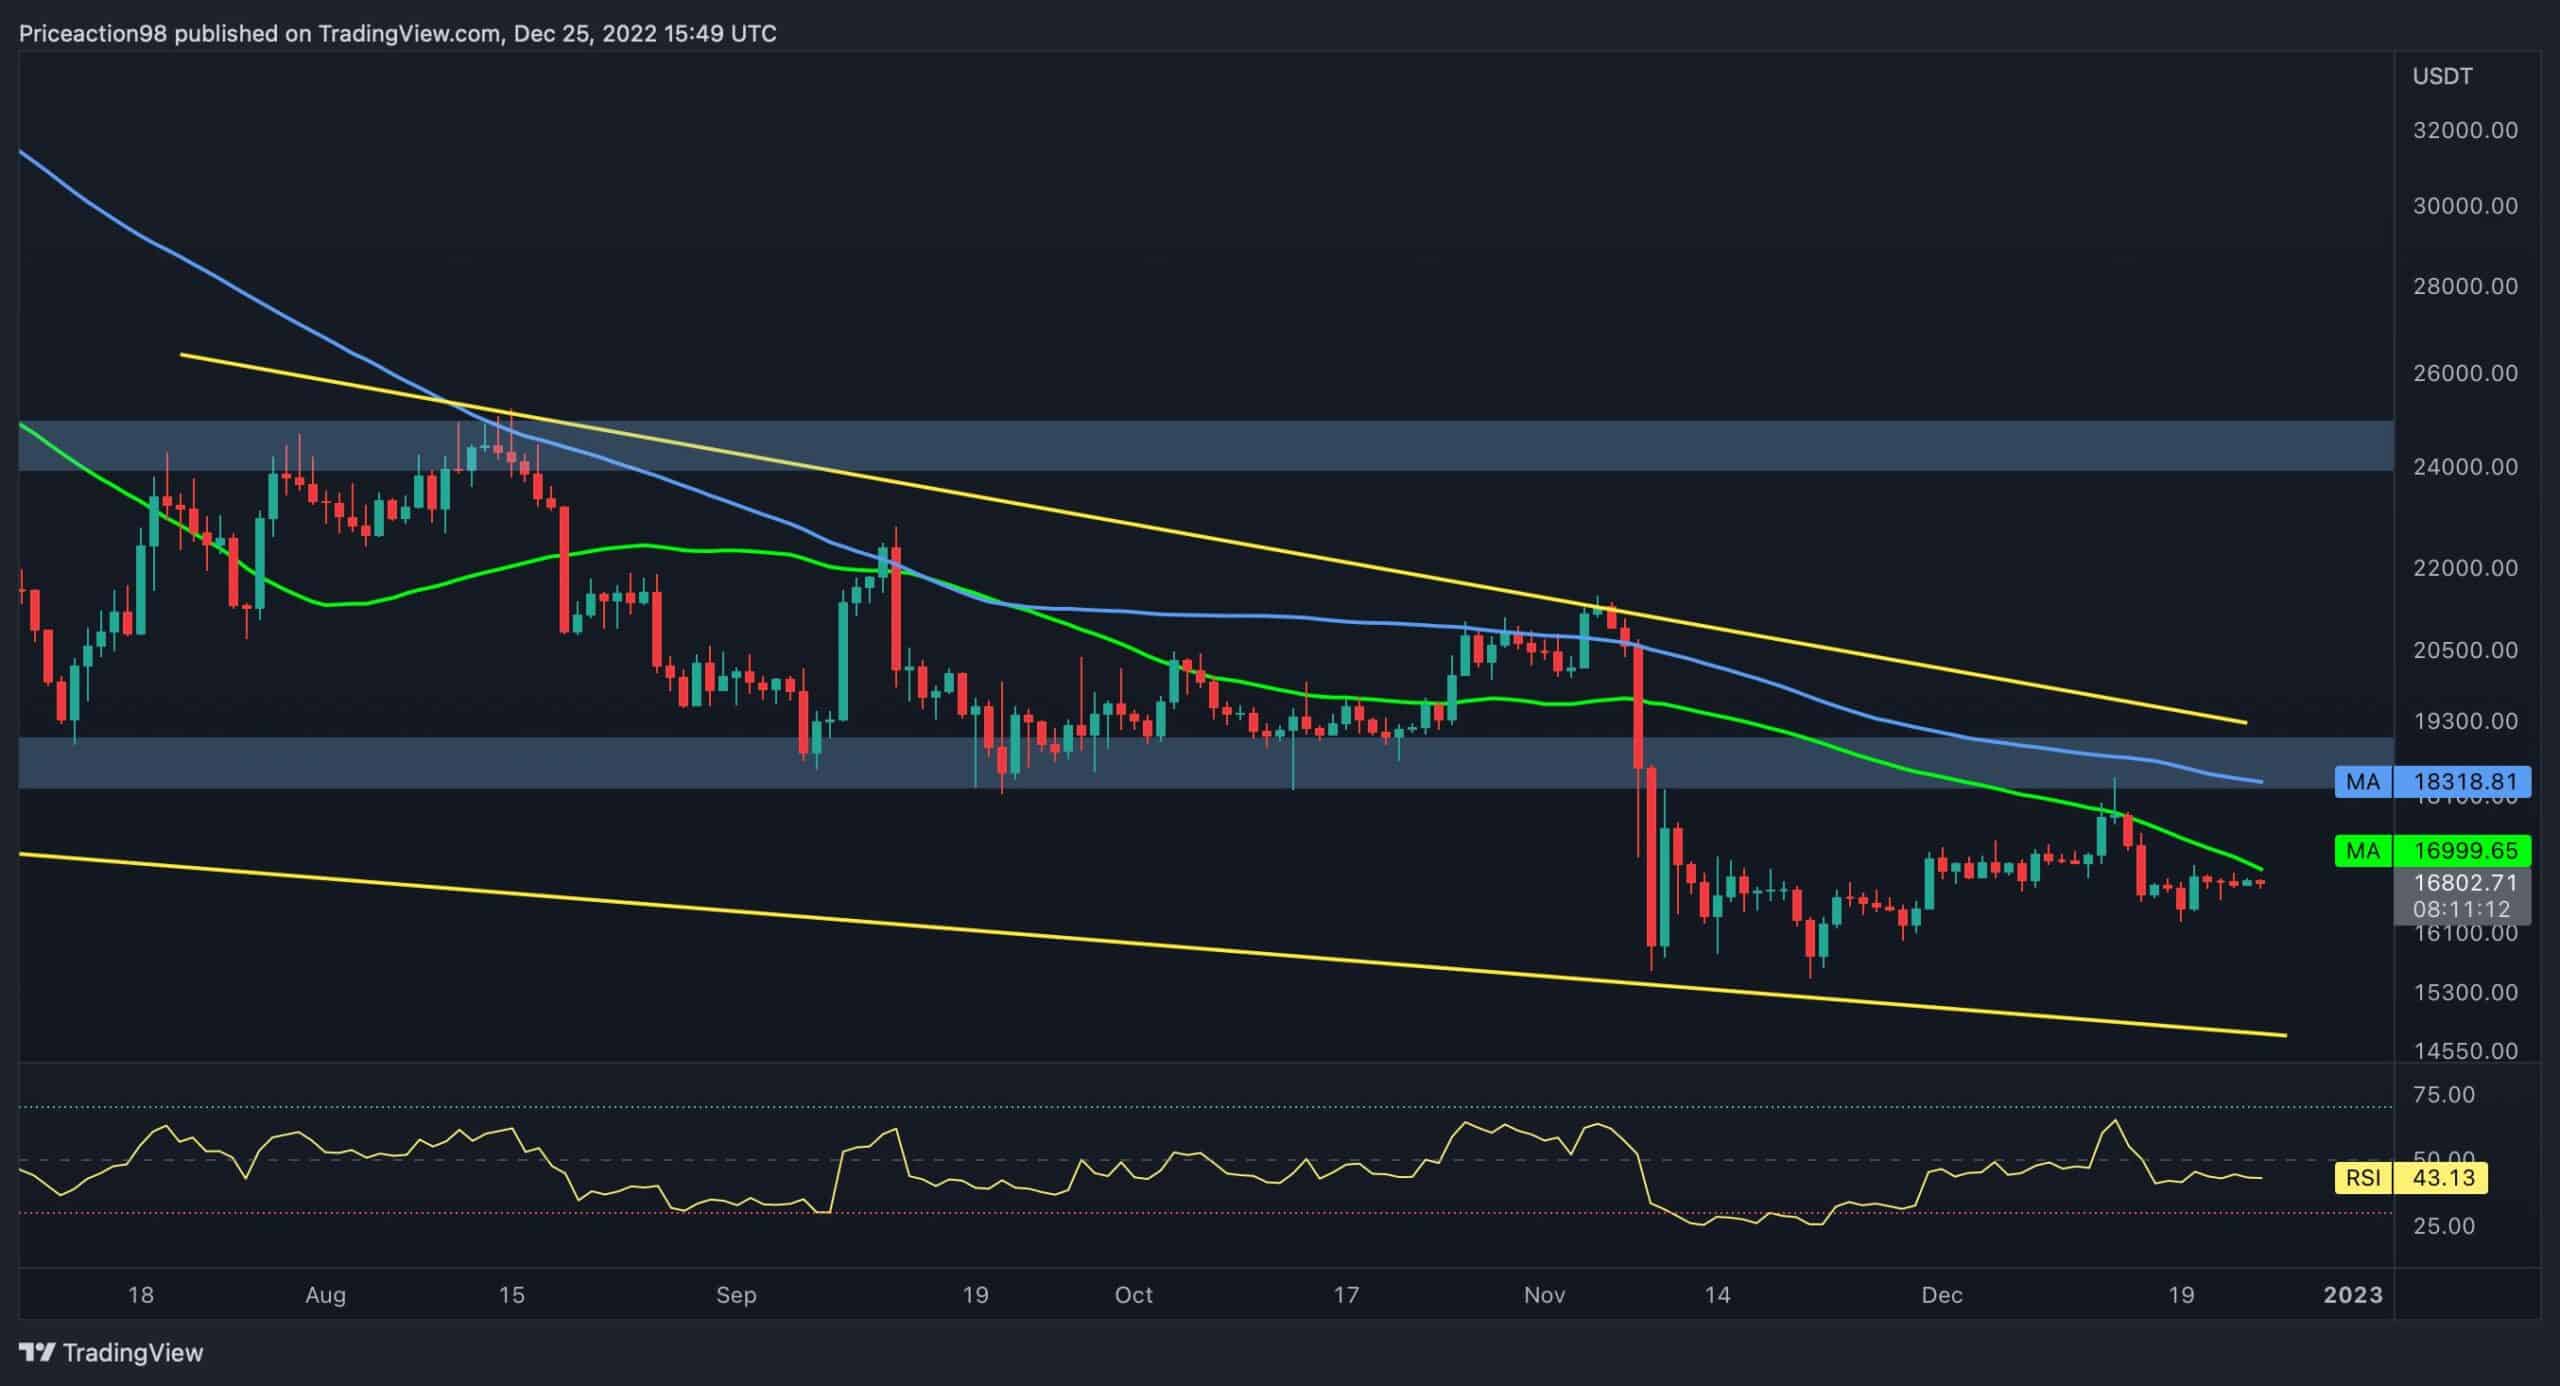
The Daily Chart
Bitcoin has failed to sustain above the 50-day and 100-day moving averages over the last few months. Most recently, the price got rejected from the 50-day moving average at $18K and has declined since then. However, it attempts to break above the 50-day moving average again.
Despite the ongoing struggle with the 50-day MA, the price momentum is not promising, as the overall activity and demand are at low levels. The market needs to recapture the players’ confidence before triggering a bullish rally.
In this regard, we can mention the MACD indicator: This indicator is about to turn green, signaling a first bullish sign in the short term, which might assist BTC in breaking above the 50-day moving average.
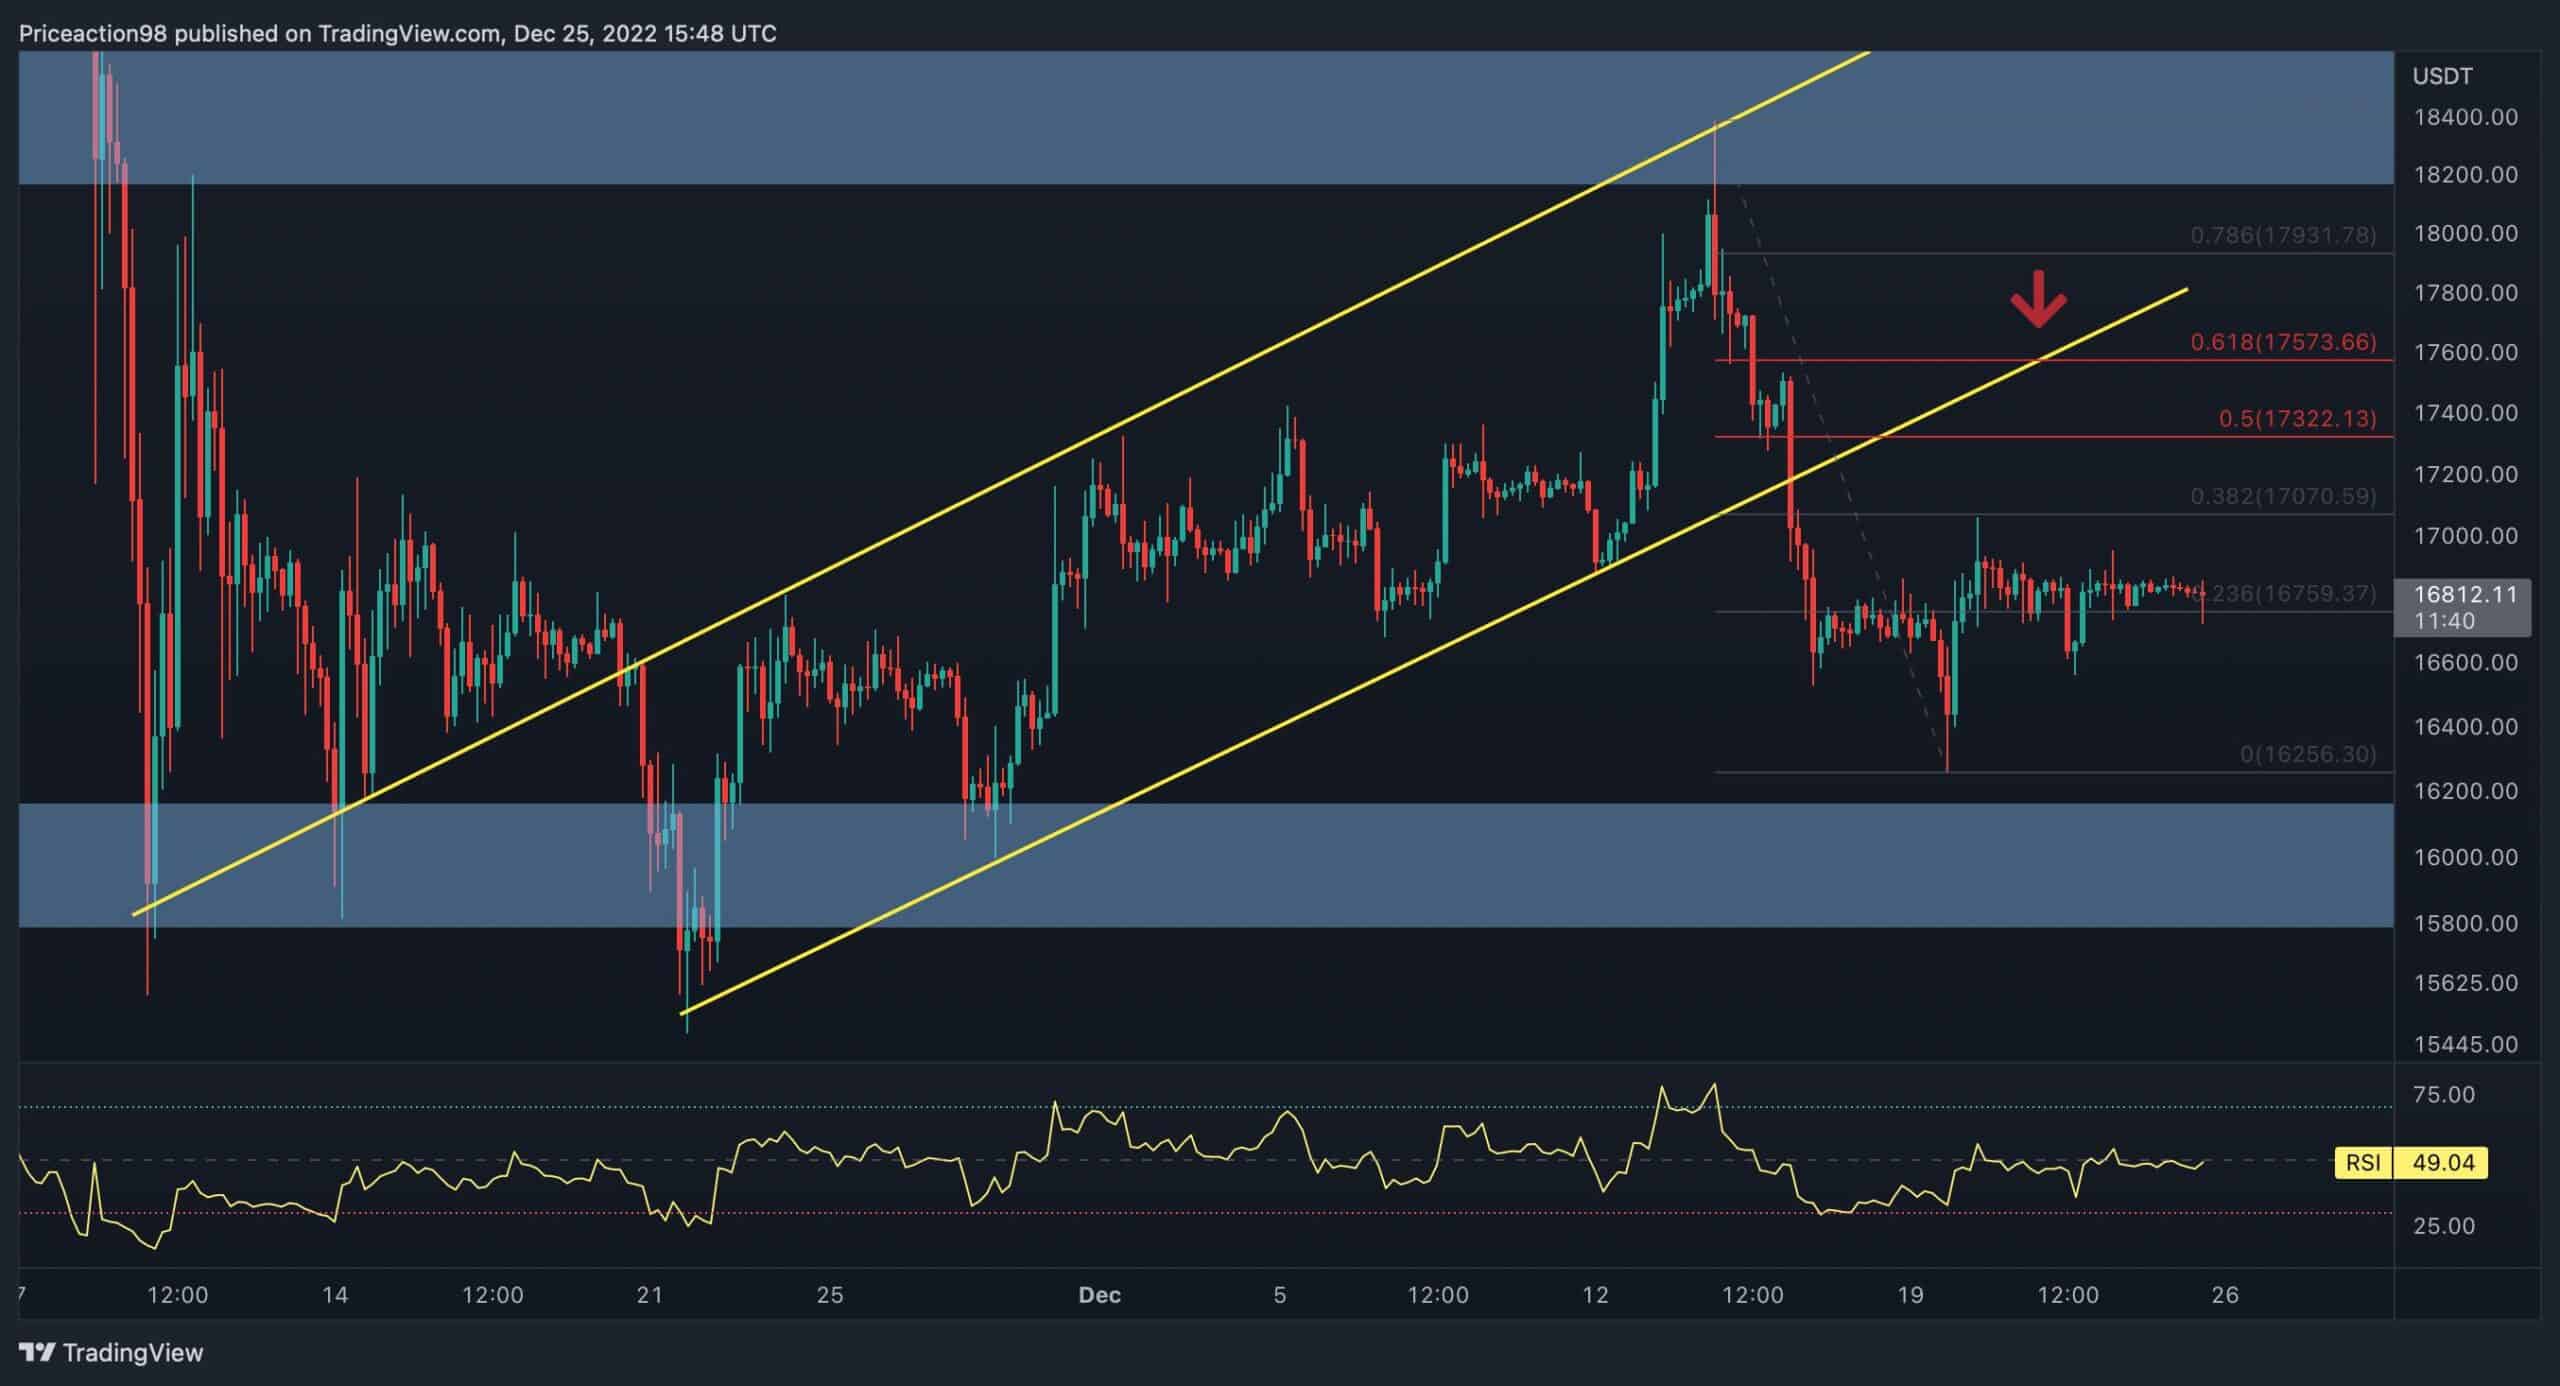
The 4-Hour Chart
The current lack of activity and low volatility is more evident on the following 4-hour timeframe chart. After going through a long-lasting downtrend, the price has rebounded from the $16K mark and is consolidating below the $17K threshold. However, the main struggle for Bitcoin is now surpassing this confluence zone.
Suppose the price returns above the mentioned level, a retracement to the 0.618 Fib level and the broken trendline will be the main barriers toward the $18K range.
On-chain Analysis
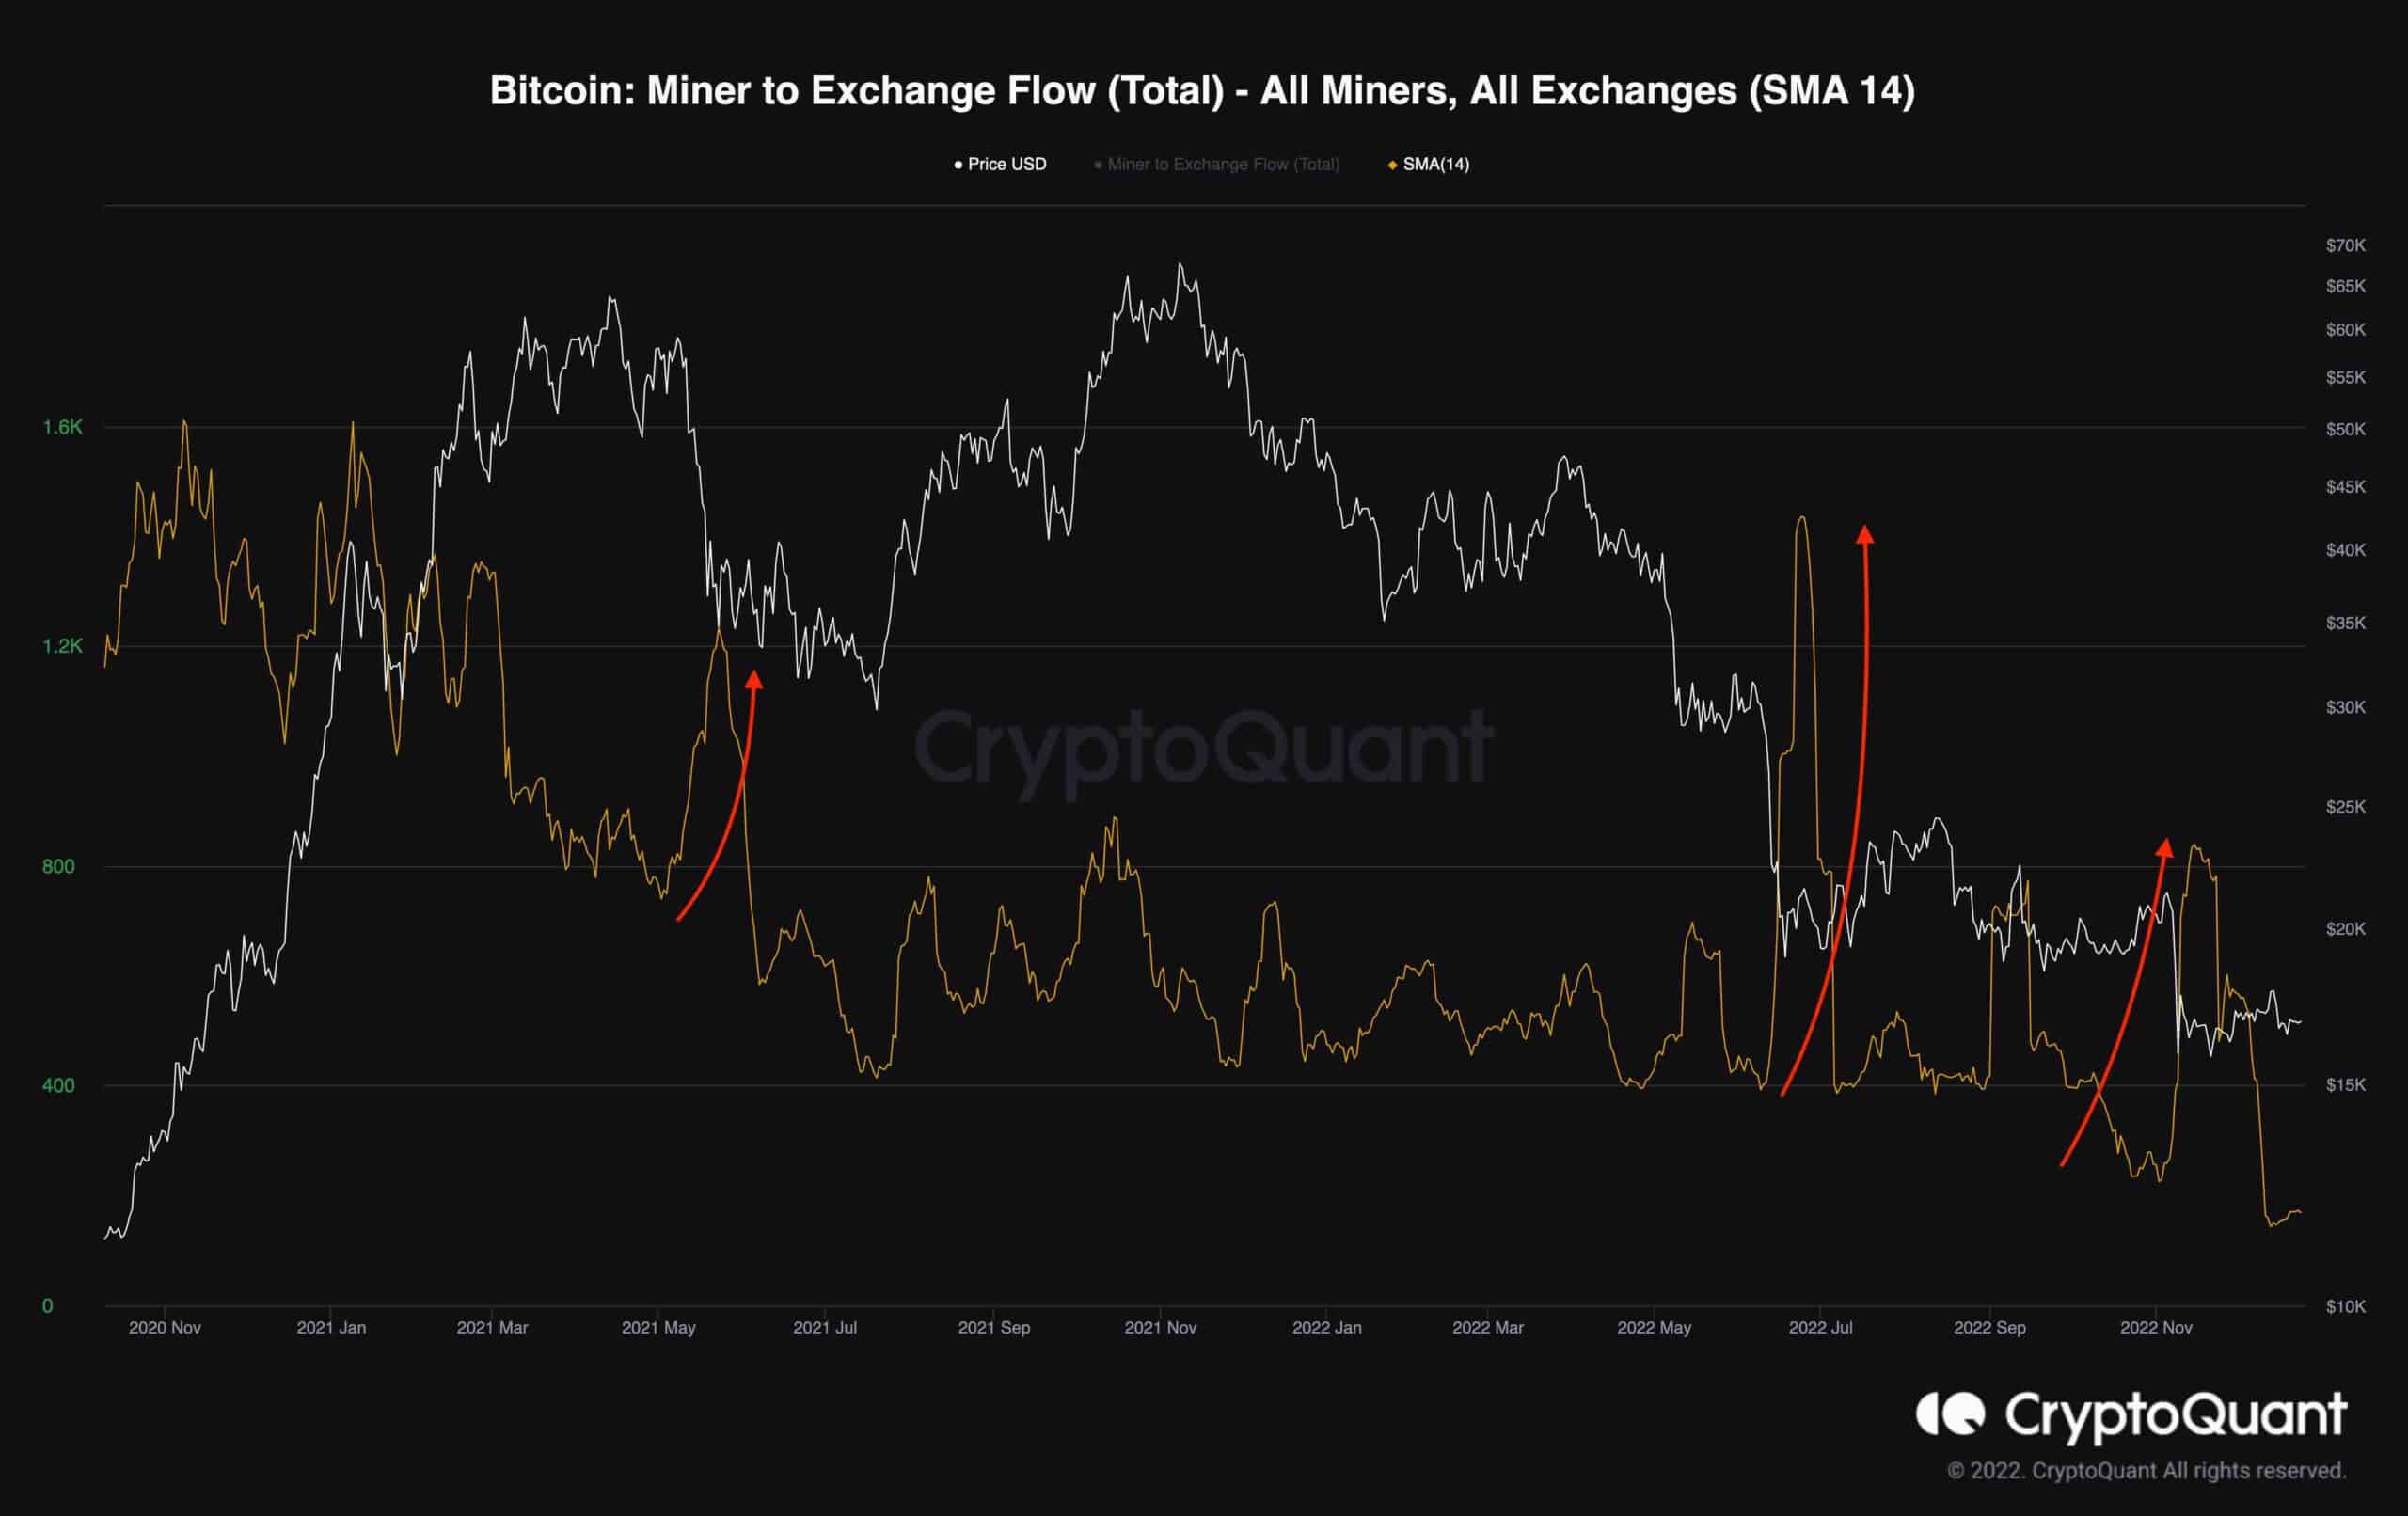
The following chart shows the 14-day moving average line of the Miner to Exchange Flow metric alongside Bitcoin’s price. This metric represents the total amount of coins transferred from the miners into exchanges.
A surge in the metric indicates possible selling pressure from the miners to cover their expenses during the bearish stage of the market. As is evident in the chart, the price declined significantly each time the metric experienced a spike.
However, the metric has recently plunged and marked a new multi-year low. This confirms that the miners’ selling pressure has been weakened, which might be considered a bullish sign for the price as they are a crucial cohort among the market participants.