Ethereum’s resilience has been one of the significant talking points during the recent market crash as opposed to Bitcoin, ETH’s price has not created a new lower low. However, more downside could be expected if the price fails to break a key resistance level. Technical Analysis Technical Analysis By: Edris The Daily Chart: On the daily chart, the cryptocurrency has been retesting the 00 resistance level over the past few days after dropping below it earlier during the FTX-related crash. These efforts, however, have led to no positive result as the level is still holding strong and pushing the price lower. In case of a significant bearish rejection, a continuation toward the 00 support level would be expected. This would be the bulls’ last resort to stop ETH from
Topics:
CryptoVizArt considers the following as important: ETH Analysis, ETHBTC, Ethereum (ETH) Price, ethusd
This could be interesting, too:
Mandy Williams writes Ethereum Derivatives Metrics Signal Modest Downside Tail Risk Ahead: Nansen
Jordan Lyanchev writes Weekly Bitcoin, Ethereum ETF Recap: Light at the End of the Tunnel for BTC
CryptoVizArt writes Will Weak Momentum Drive ETH to .5K? (Ethereum Price Analysis)
Jordan Lyanchev writes Bybit Hack Fallout: Arthur Hayes, Samson Mow Push for Ethereum Rollback
Ethereum’s resilience has been one of the significant talking points during the recent market crash as opposed to Bitcoin, ETH’s price has not created a new lower low. However, more downside could be expected if the price fails to break a key resistance level.
Technical Analysis
Technical Analysis By: Edris
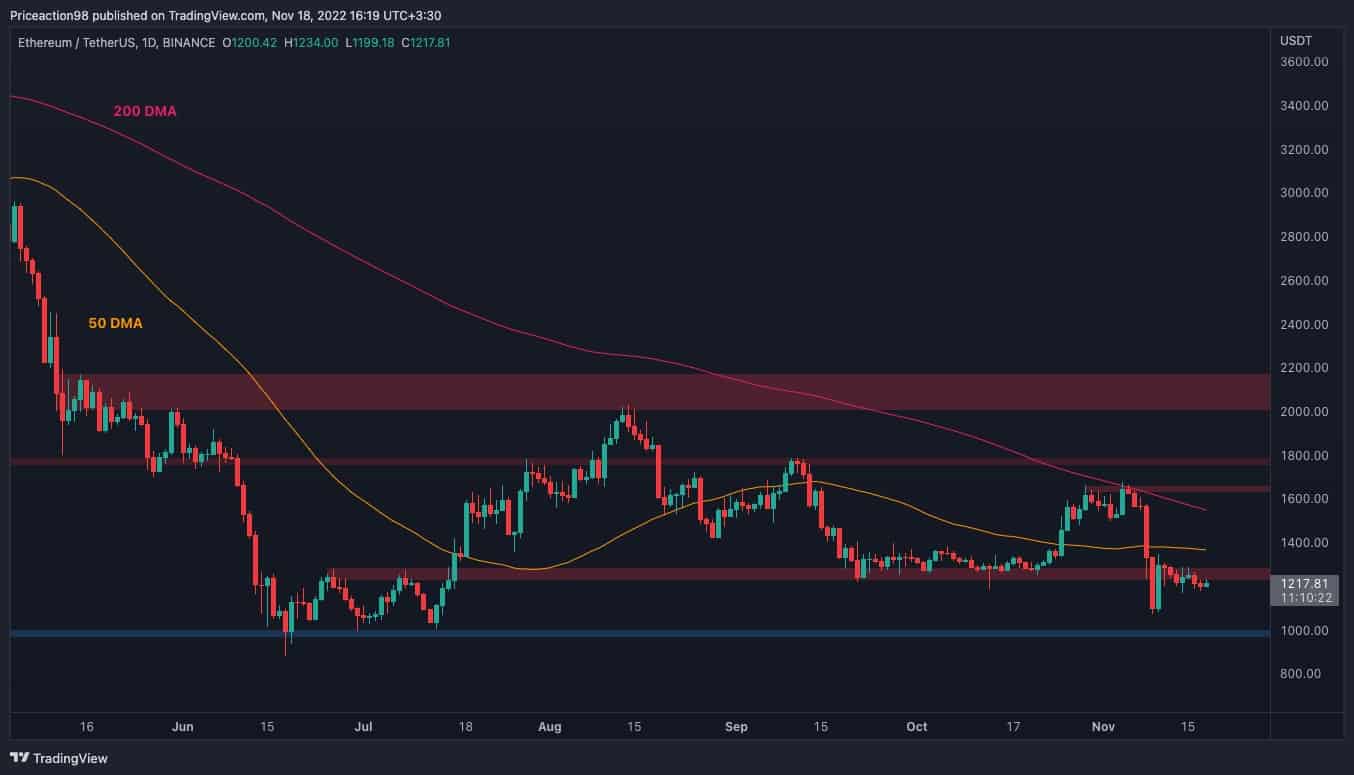
The Daily Chart:
On the daily chart, the cryptocurrency has been retesting the $1300 resistance level over the past few days after dropping below it earlier during the FTX-related crash. These efforts, however, have led to no positive result as the level is still holding strong and pushing the price lower.
In case of a significant bearish rejection, a continuation toward the $1000 support level would be expected. This would be the bulls’ last resort to stop ETH from plunging lower and making a new lower low. On the other hand, if the market finally breaks above the $1300 level, the 50-day and 200-day moving averages, located around the $1400 and $1550 marks, respectively, would be next in line as significant dynamic resistance levels.
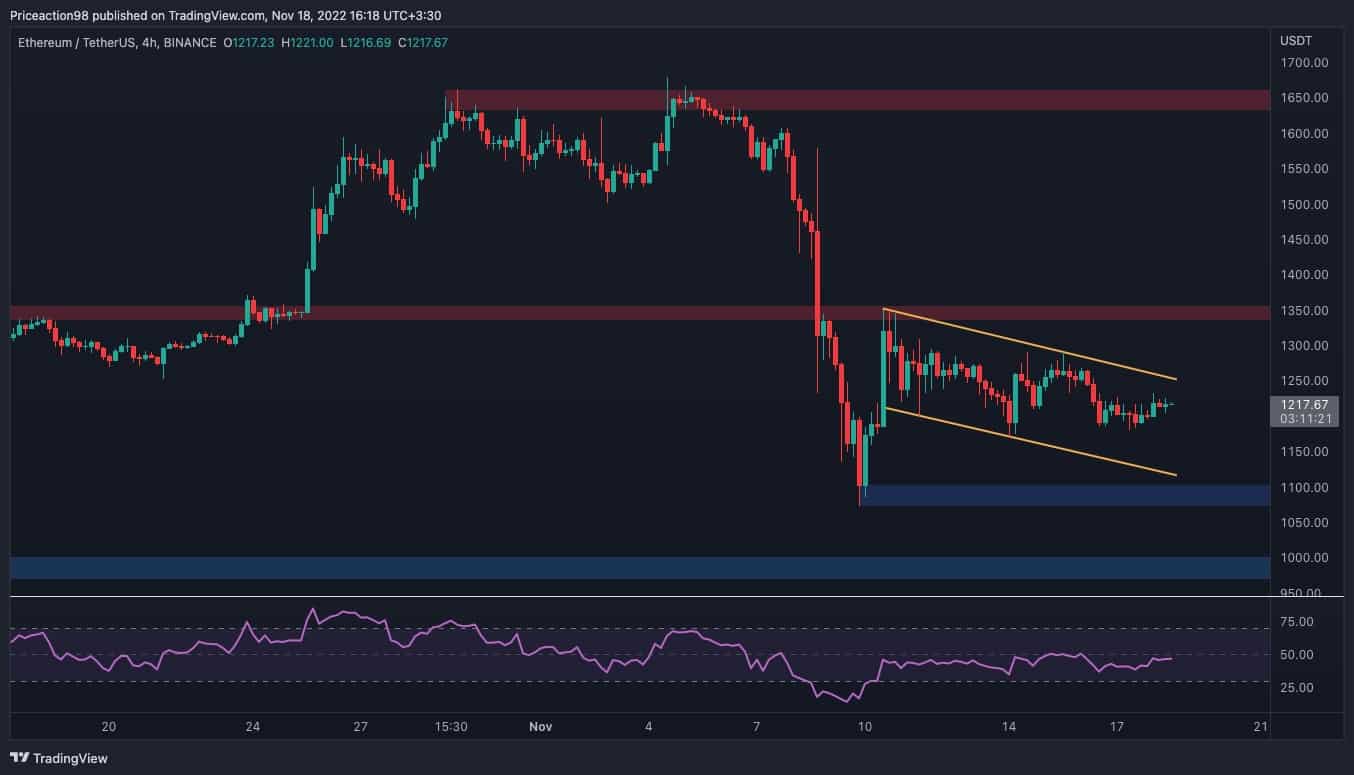
The 4-Hour Chart:
Looking at the 4-hour timeframe, it becomes clearer that the price ranges between $1100 and $1350 levels. Furthermore, a large bullish flag is seemingly forming on this timeframe which, if broken to the upside, could indicate a rally towards the $1350 level and likely beyond in the short term.
However, considering the current bearish market environment, the failure of the flag and drop toward the $1100 level could not be ruled out. The RSI indicator is also demonstrating a momentum equilibrium as it is oscillating around the 50% mark and does not provide any useful hint on the short-term direction of the price in this timeframe.