Options Market Analysis After bitcoin dipped to K on December 4th on Omicron fears, its price could not move higher than k over the last month. BTC is now trading at k. Short-dated ATM-implied volatility peaked at 94 and is currently sitting at 66. Source: Laevitas.chCalls for a K strike price have the highest open interest for 2,3 & January 7th expiries. Lots of calls were sold for these expiries over the last few days. It seems that low demand in the spot market caused option traders not to be optimistic about an increase in price higher than K for the expires in the first week of January. Source: Laevitas.chTechnical Analysis On the daily timeframe, bitcoin is completing the pullback to the broken trend line (yellow ones), both price and RSI. But we can
Topics:
George Georgiev considers the following as important: Bitcoin (BTC) Price, BTC Analysis, BTCEUR, BTCGBP, btcusd, btcusdt
This could be interesting, too:
Mandy Williams writes Bitcoin ETFs Record Over .6B in Outflows in the Past 2 Weeks
Chayanika Deka writes Bitcoin Whales Offload 6,813 BTC as Selling Pressure Mounts
Wayne Jones writes Bitcoin Sentiment Hits 2022 Lows as Fear & Greed Index Falls to 10
Jordan Lyanchev writes Bitcoin Falls Below K for the First Time in 3 Months, How Much Lower Can It Go?
Options Market Analysis
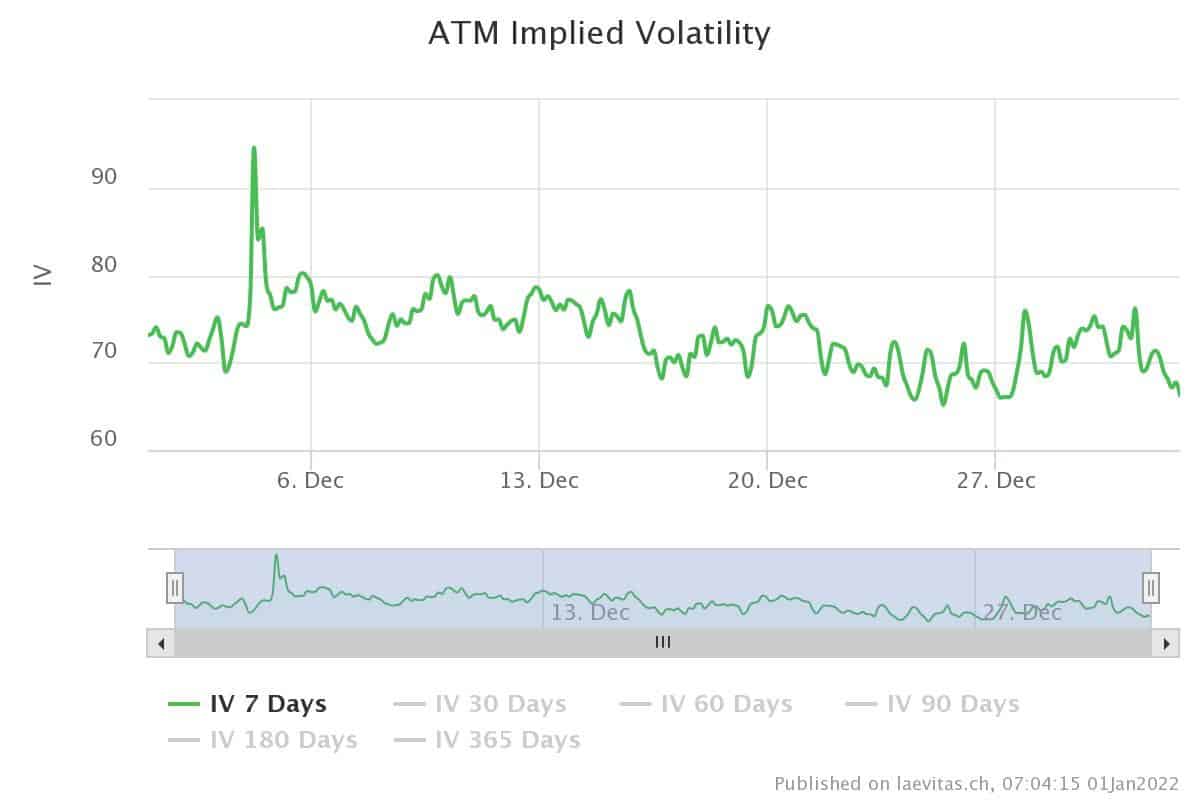
After bitcoin dipped to $42K on December 4th on Omicron fears, its price could not move higher than $52k over the last month. BTC is now trading at $47k. Short-dated ATM-implied volatility peaked at 94 and is currently sitting at 66.
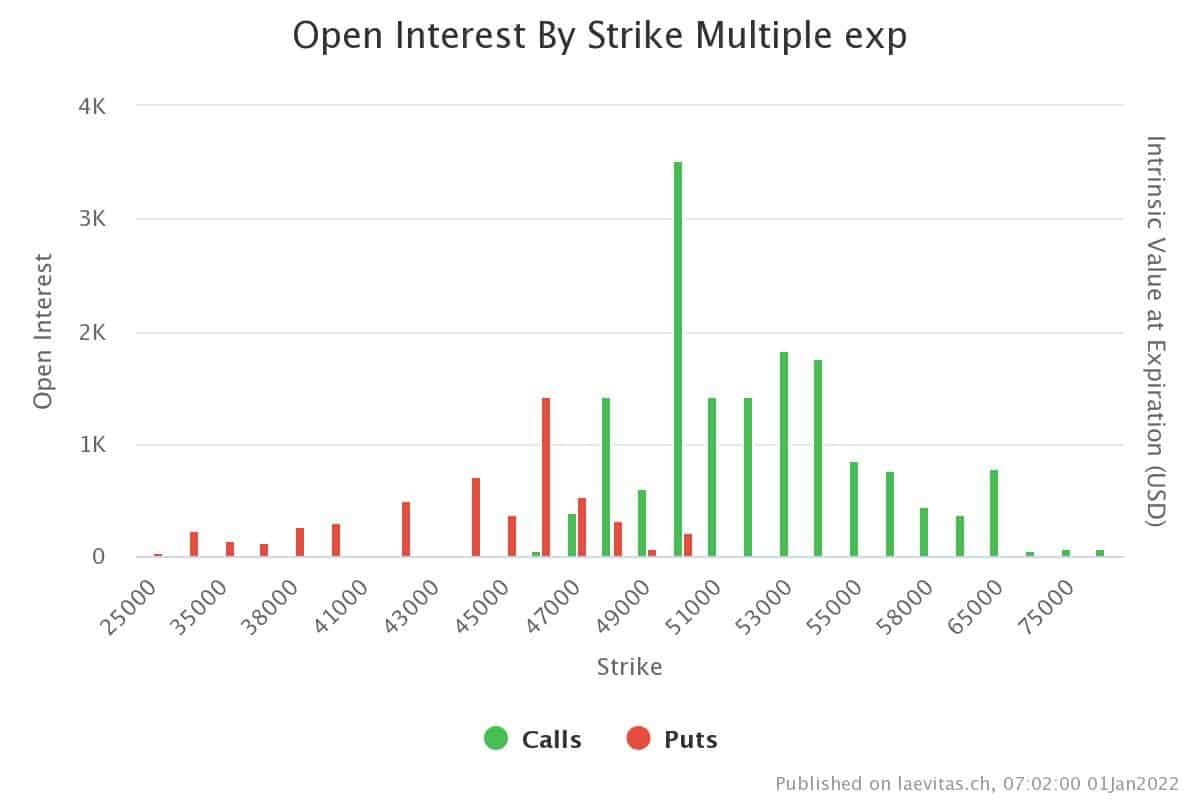
Calls for a $50K strike price have the highest open interest for 2,3 & January 7th expiries. Lots of calls were sold for these expiries over the last few days. It seems that low demand in the spot market caused option traders not to be optimistic about an increase in price higher than $54K for the expires in the first week of January.
Technical Analysis
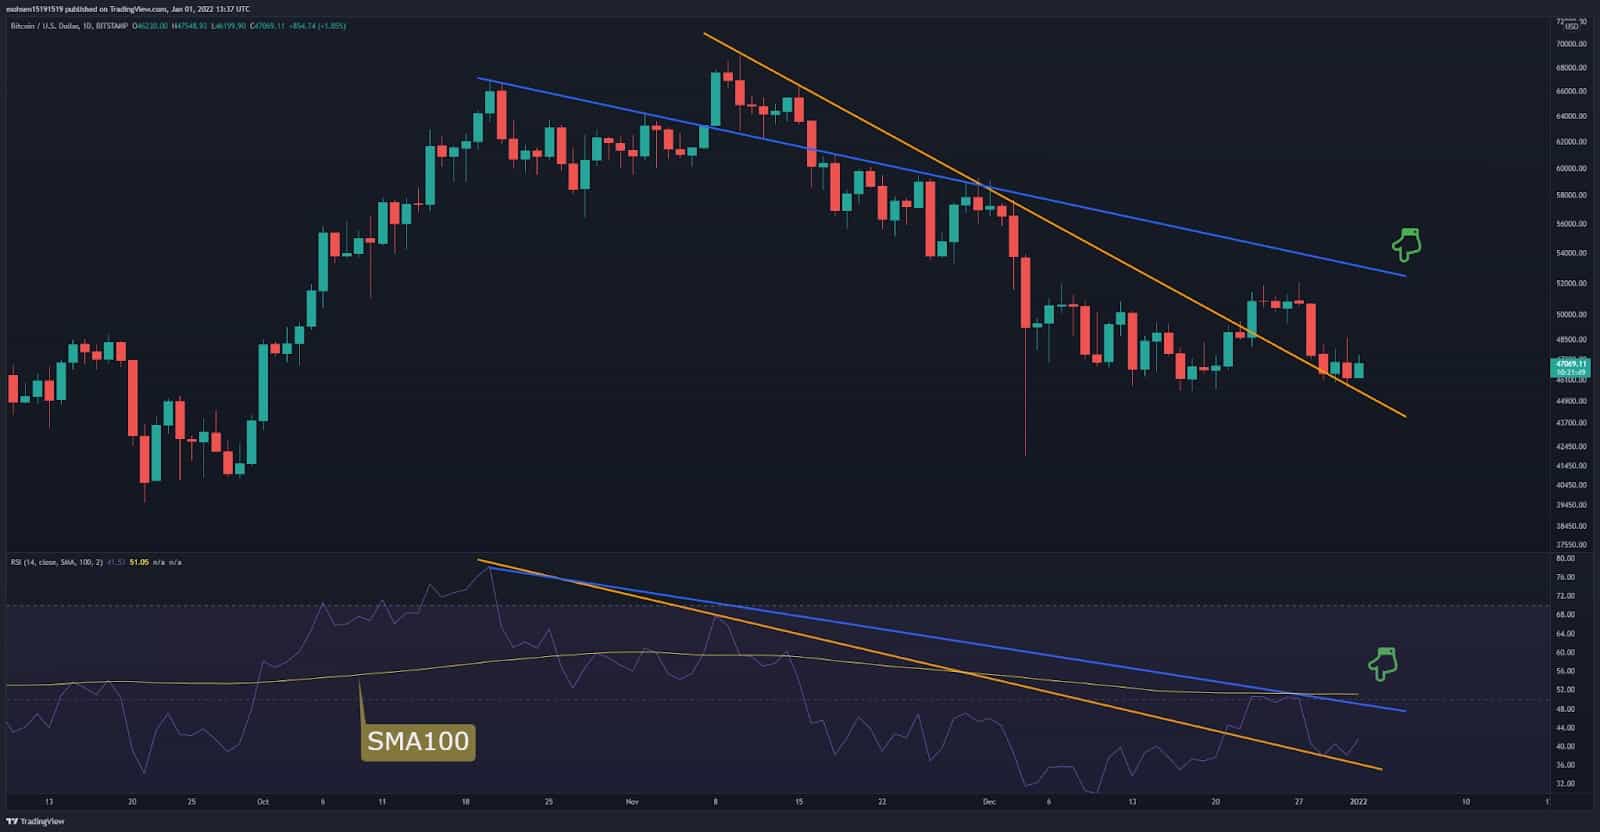
On the daily timeframe, bitcoin is completing the pullback to the broken trend line (yellow ones), both price and RSI. But we can not yet say that the correction is over. The price needs to form a higher high and break the blue trend line in the price chart and RSI. This resistance in RSI is the intersection of SM100 and baseline 50, and crossing it indicates bears are kicking out of the market.
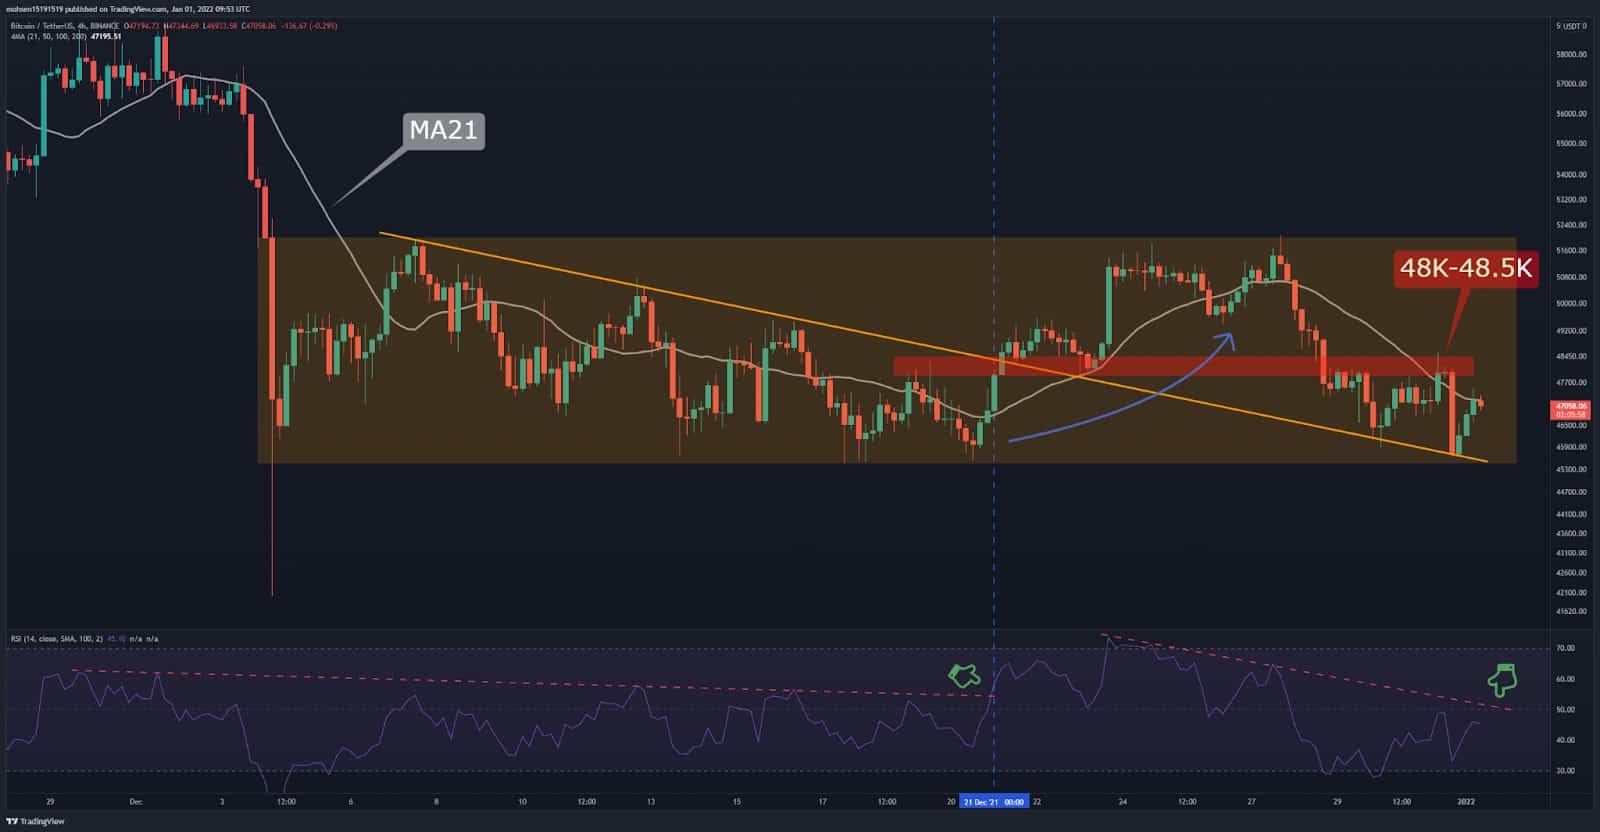
On the lower timeframe, the price is mostly fluctuating in a rectangle (yellow box). In the short term, a safe spot could be the break of the RSI downtrend and MA21 as it happened on December 21st and led to an 11% increase.
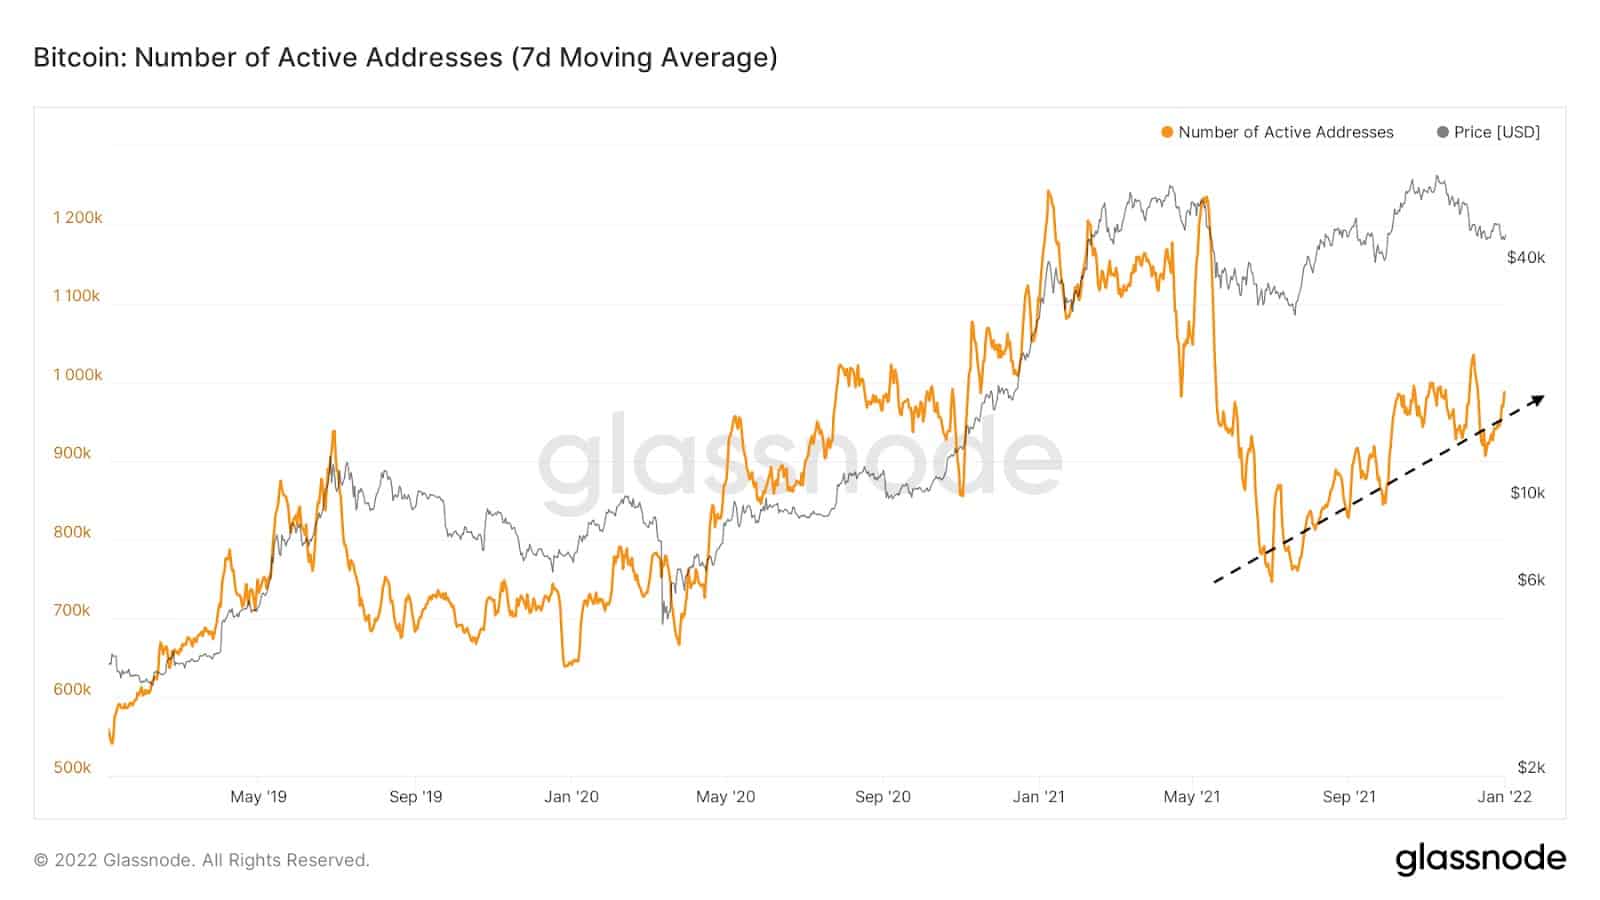
On-Chain Analysis
Despite the neutral to negative sentiment of the futures market, the mid-term and long-term indicators in on-chain data are positive. Alongside the continuing hashrate recovery, the weekly-averaged number of active users is growing. This trend confirms that demand is still in the market, and any catalyst could initiate another rally.
The above analysis was complied by analysts @greatest_trader, @N__E__D__A, and @CryptoVizArt exclusively for CryptoPotato.