The market has struggled to push above the significant resistance level of K, and now the price is slowly declining. Therefore, the possibility of a correction before the next rally has increased. Technical Analysis By Shayan The Daily Chart The K-K region is currently providing the most significant resistance for Bitcoin on the daily timeframe. It’s also a vital psychological level, as it has been the main barrier during the last eight months. However, due to the recent bullish stage of the market, the price has surged and reached the K region. Yet, the bulls failed to push the price above it, and it was rejected. Also, a prolonged bearish divergence between the price and the RSI indicator increases the likelihood of a short-term correction. Nevertheless, the
Topics:
CryptoVizArt considers the following as important: Bitcoin (BTC) Price, BTC Analysis, BTCEUR, BTCGBP, btcusd, btcusdt
This could be interesting, too:
Chayanika Deka writes XRP, SOL, and ADA Inclusion in US Crypto Reserve Pushes Traders on Edge
Chayanika Deka writes Why Arthur Hayes Is Bullish on Bitcoin Under Trump’s Economic Strategy
Mandy Williams writes Why the Bitcoin Market Is Stuck—and the Key Metric That Could Change It: CryptoQuant CEO
Wayne Jones writes Metaplanet Acquires 156 BTC, Bringing Total Holdings to 2,391
The market has struggled to push above the significant resistance level of $25K, and now the price is slowly declining. Therefore, the possibility of a correction before the next rally has increased.
Technical Analysis
By Shayan
The Daily Chart
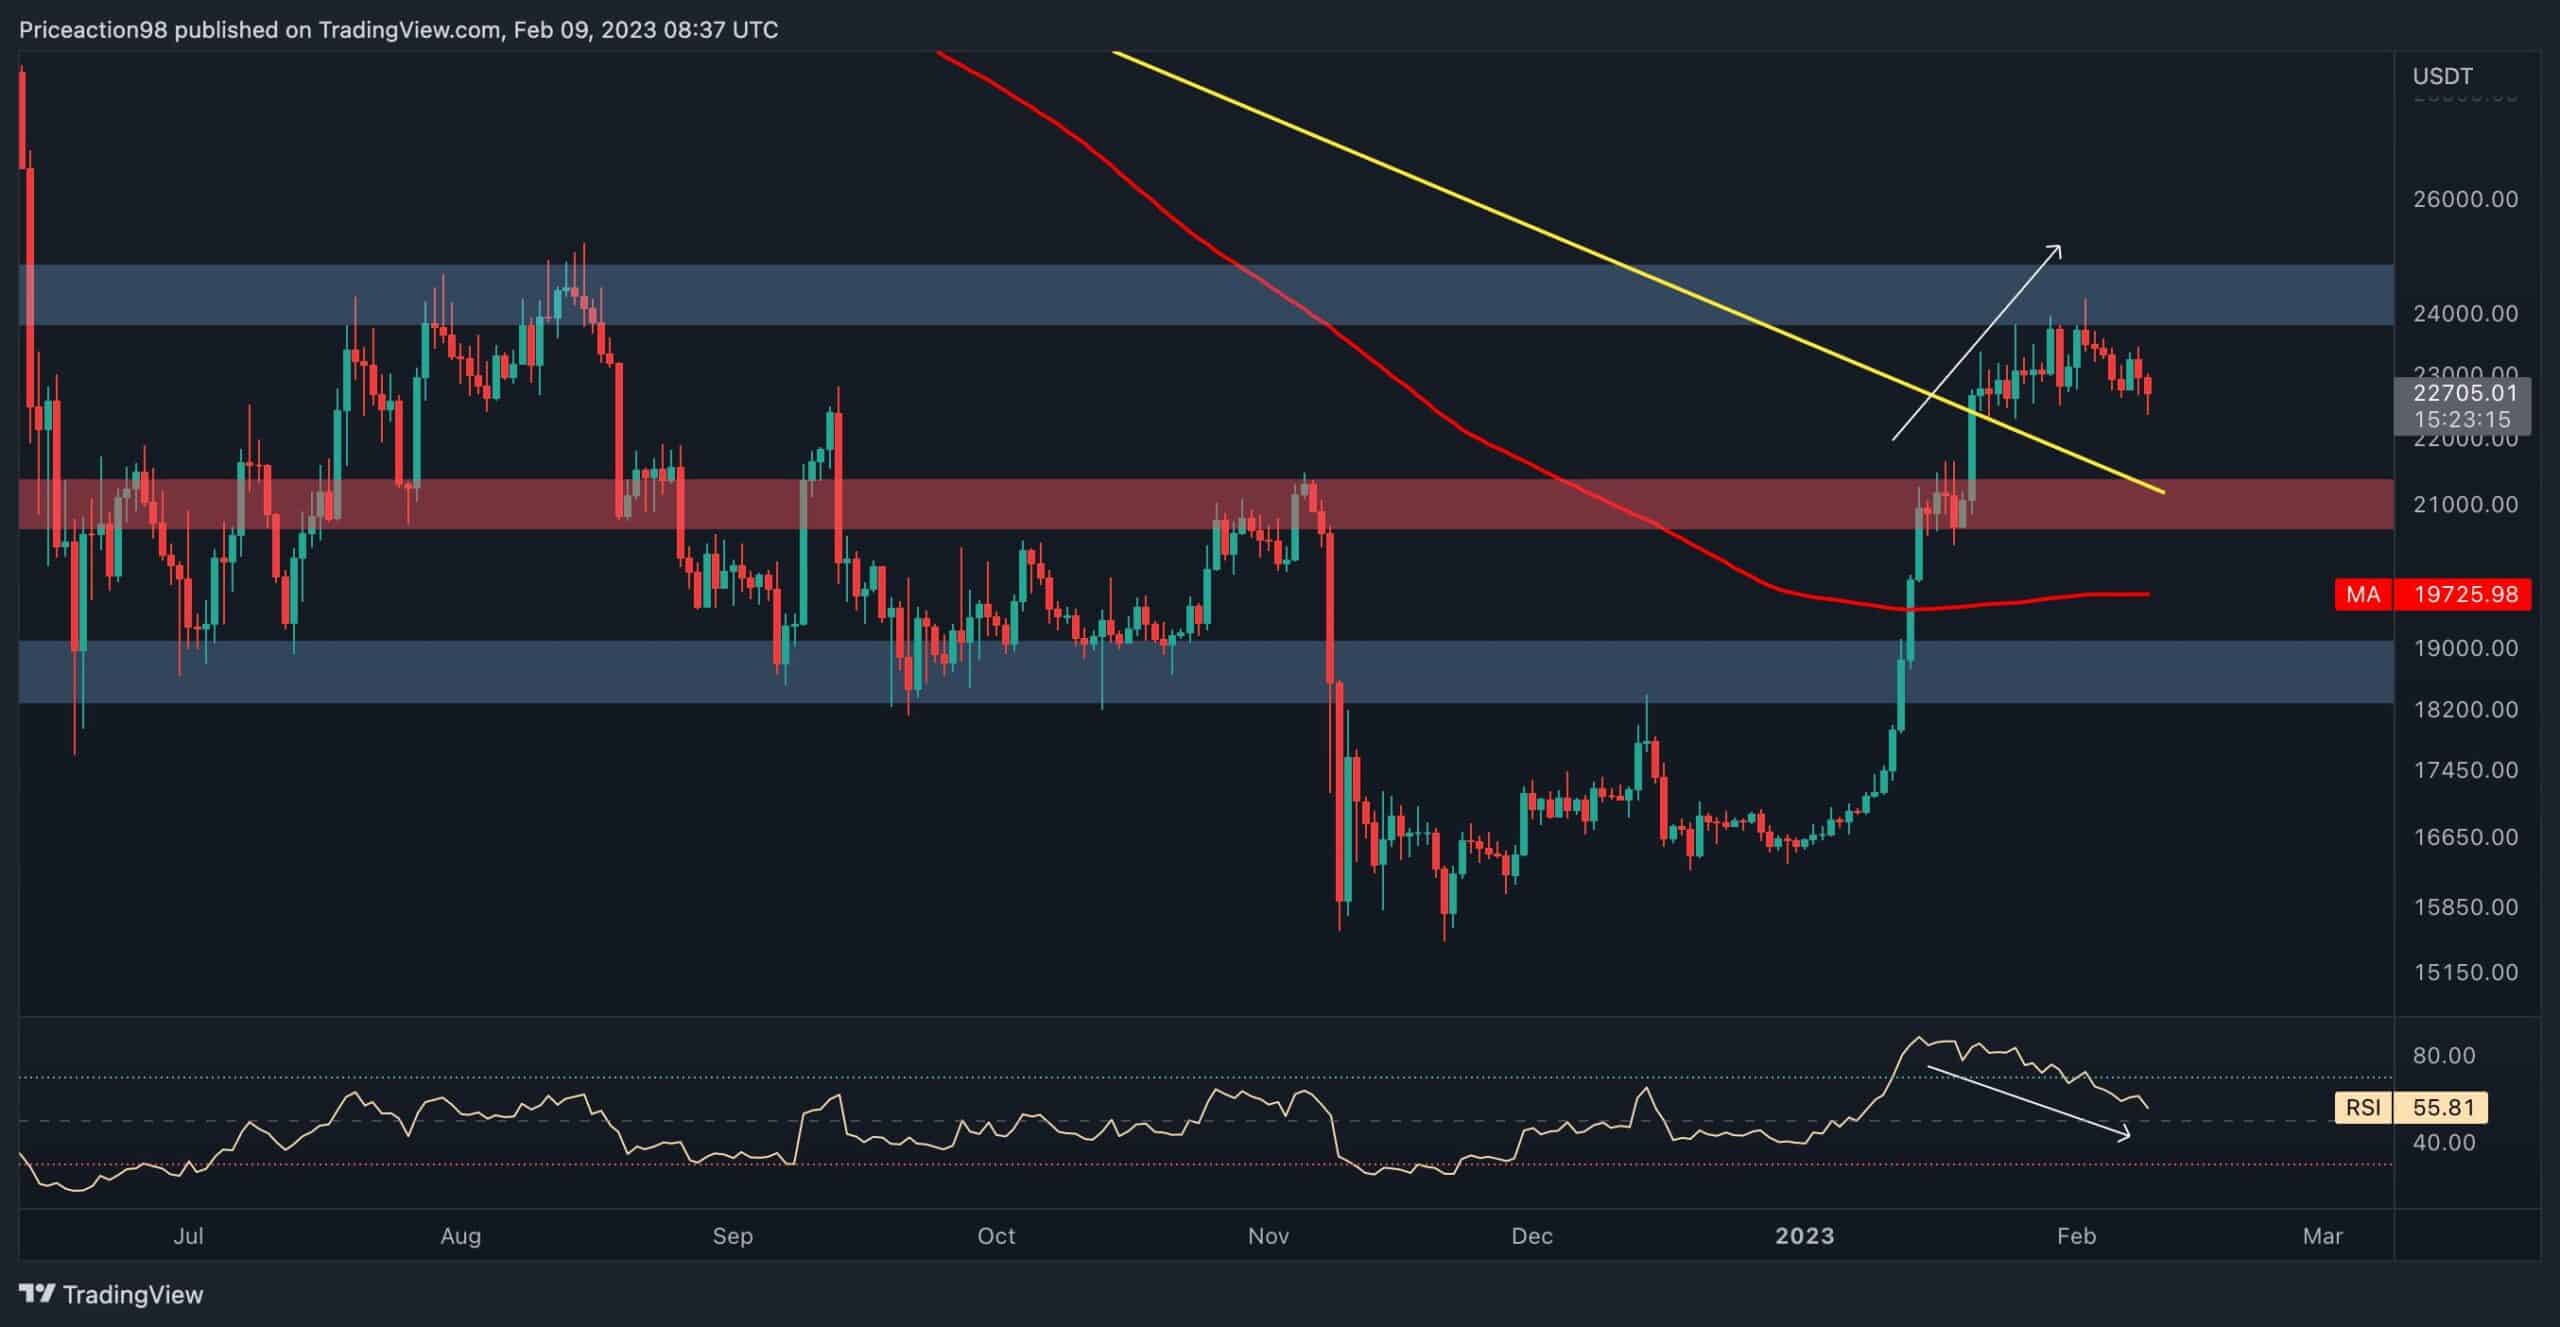
The $24K-$25K region is currently providing the most significant resistance for Bitcoin on the daily timeframe. It’s also a vital psychological level, as it has been the main barrier during the last eight months.
However, due to the recent bullish stage of the market, the price has surged and reached the $24K region. Yet, the bulls failed to push the price above it, and it was rejected. Also, a prolonged bearish divergence between the price and the RSI indicator increases the likelihood of a short-term correction.
Nevertheless, the cryptocurrency might retest the 200-day moving average and the broken trendline before initiating another rally, aiming for $25K.
The 4-Hour Chart
On the 4-hour timeframe, the price plummeted below the flag’s lower boundary and retested the trendline to complete the pullback, signaling a validation of the described pattern. However, the positive momentum was weaker than expected, causing BTC to fluctuate.
Meanwhile, a static support level has formed at the $22.3K level. As a result, many sell-stop orders below this support level provide adequate liquidity for the market to grab before initiating the next move.
Hence, this approves the short-term consolidation correction scenario for now, unless the bulls surprise the market and print a big green candle on the BTC charts.

On-chain Analysis
By Shayan
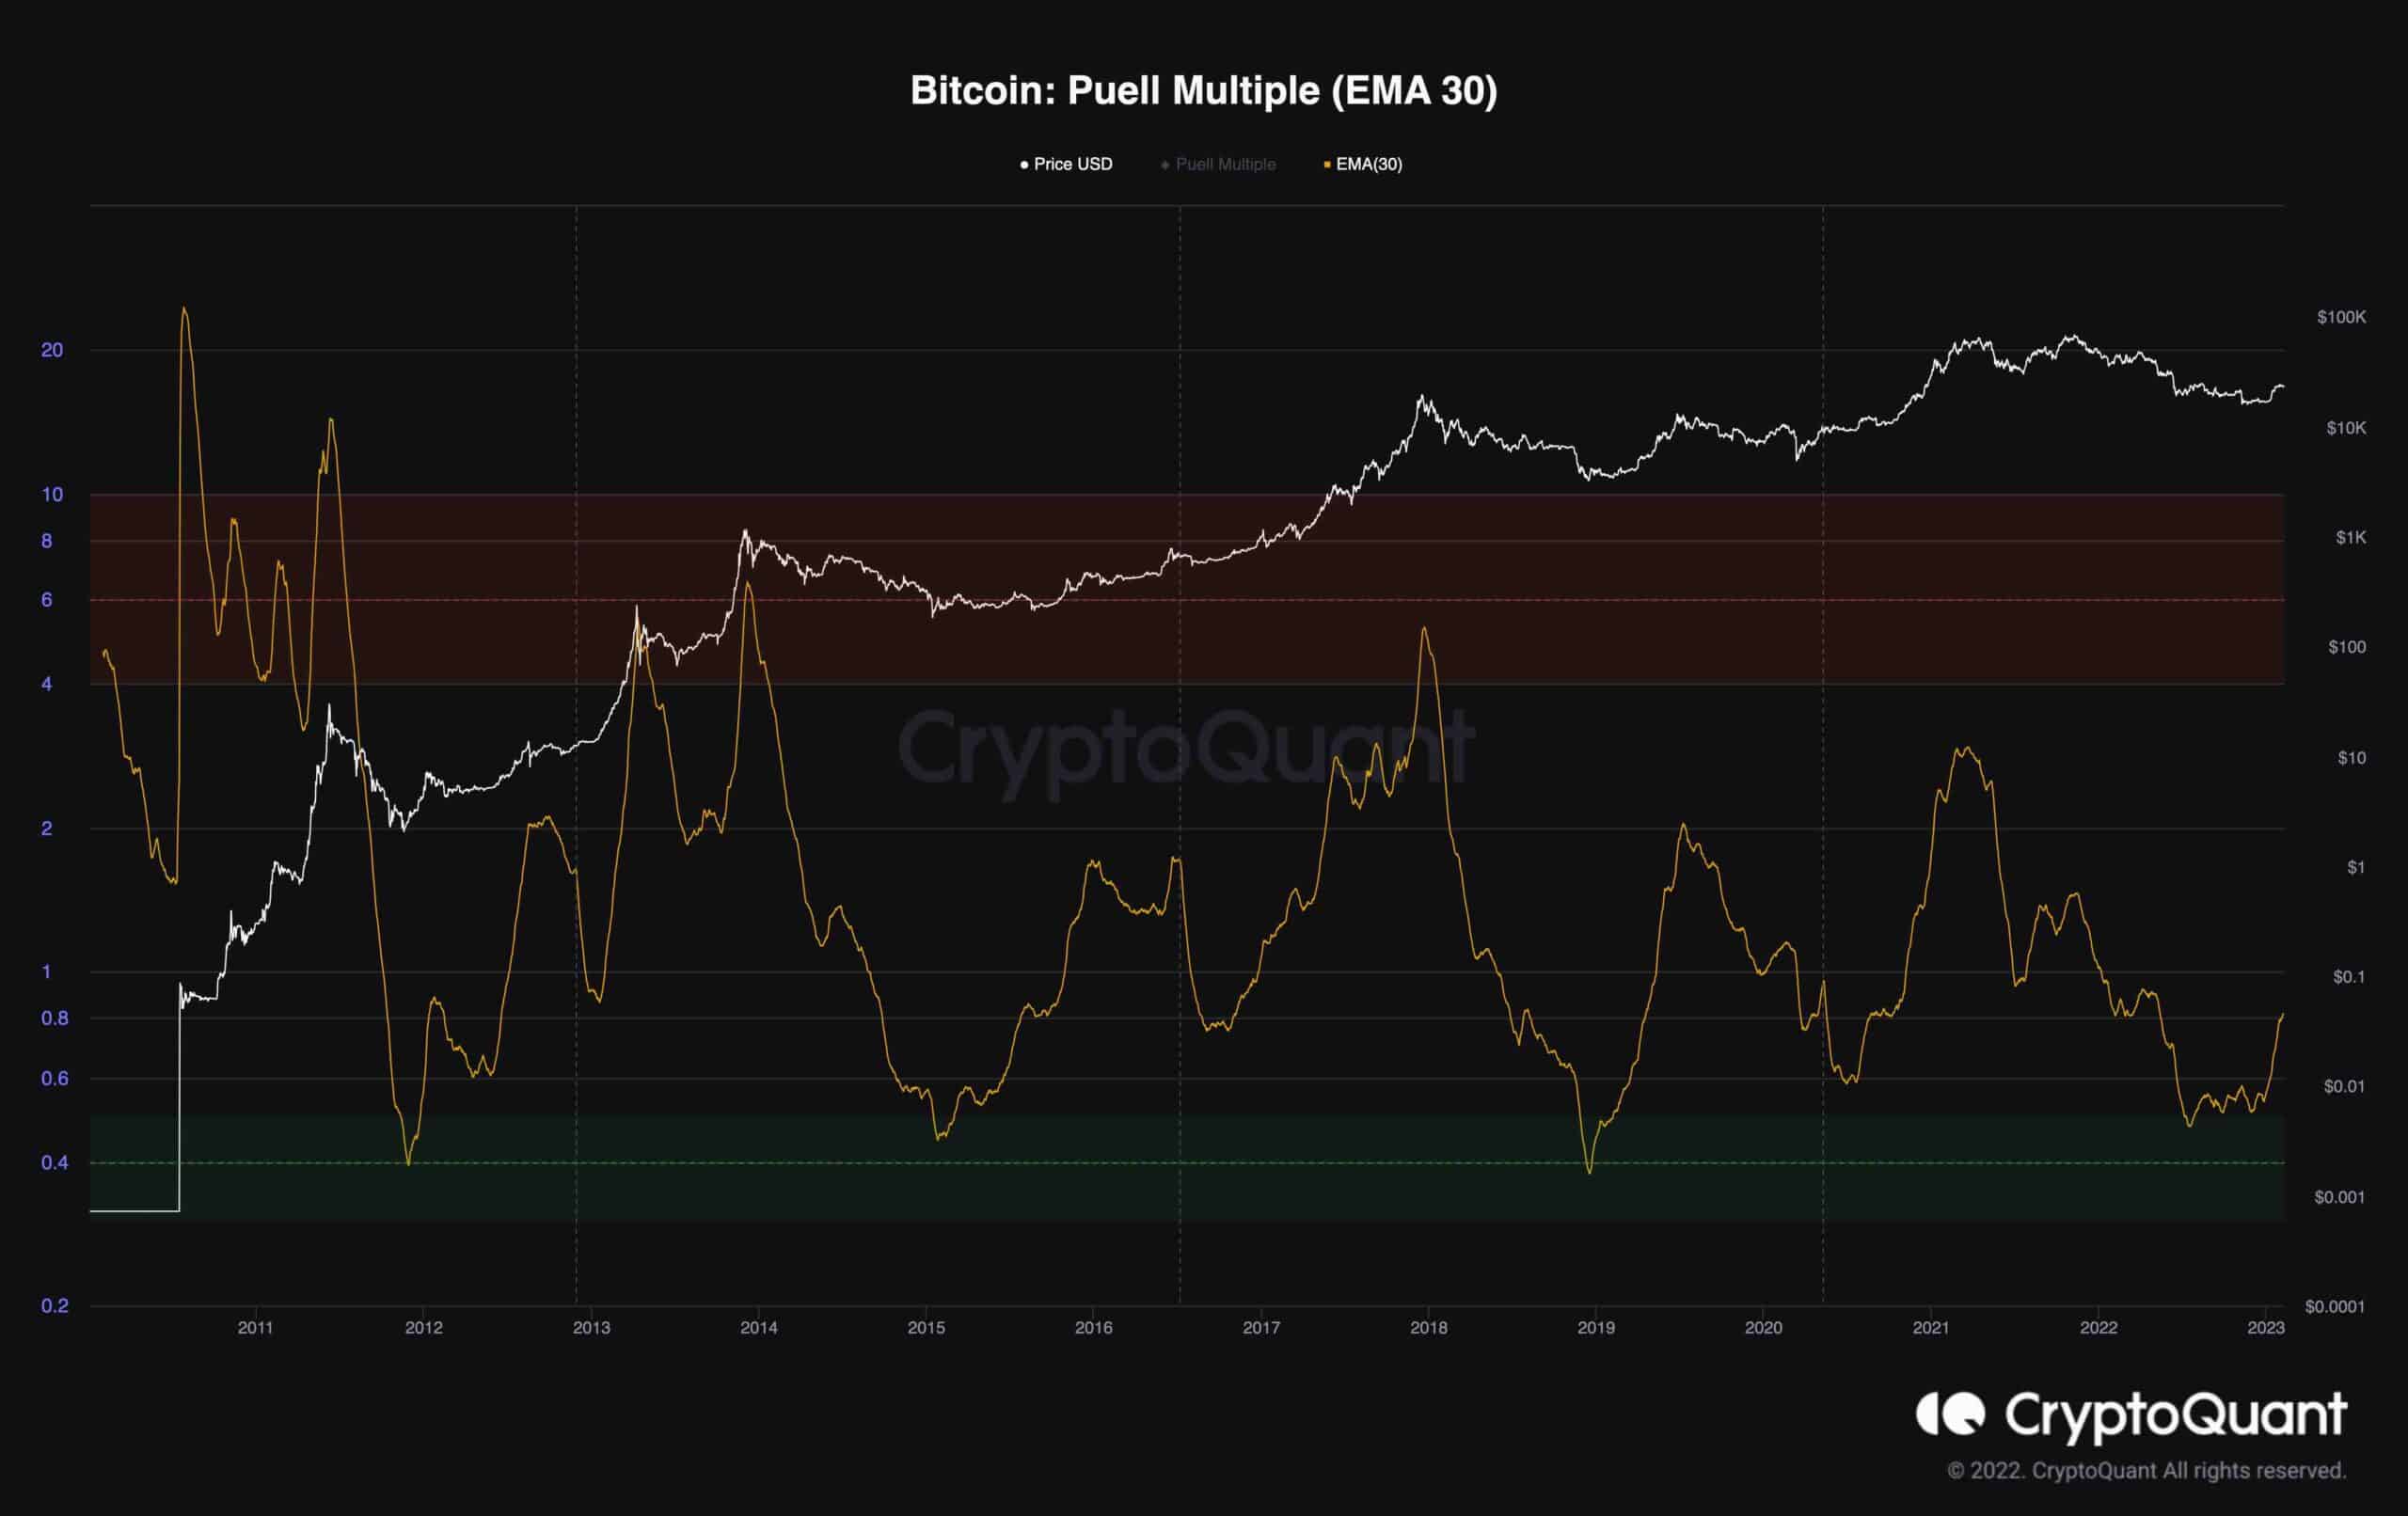
The Puell Multiple metrics provide participants with a broader insight into the market stage by asking, “How profitable are mining pools in comparison to the past year if all the Bitcoins created were distributed instantly on the market?”
Historically, each time the metric declined to the green zone, the market finally found a bottom and marked the final phase of the bear stage. Accordingly, the metric had dropped to the green zone due to Bitcoin’s massive downtrend over the last months. However, the recent uptrend in Bitcoin’s price has led to a surge and the green zone’s exit.
This could be interpreted as a bullish sign, indicating the bear market is over, and Bitcoin might have found its bottom. Nevertheless, a reverse scenario is always on the table, and the recent price surge might be another significant bull trap. Hence, it is better to watch out.