Bitcoin’s price rallies after breaking above a significant resistance level. However, the 2022 bear market is not over yet until another critical level is broken to the upside. Technical Analysis By: Edris The Daily Chart On the daily chart, Bitcoin’s price had seen a massive uptrend over the past week, following a V-shaped rebound from the 200-day moving average located amid the K mark, followed by a decent breakout above the K resistance level. Currently, the price is heading towards the key K area, a mid-term resistance, in which a breakout above it would likely lead to a bullish phase in the coming months. However, the RSI indicator has entered the overbought area and is signaling a potential pullback or consolidation in the short term. In this case, the K
Topics:
CryptoVizArt considers the following as important: Bitcoin (BTC) Price, BTC Analysis, BTCEUR, BTCGBP, btcusd, btcusdt
This could be interesting, too:
Chayanika Deka writes XRP, SOL, and ADA Inclusion in US Crypto Reserve Pushes Traders on Edge
Chayanika Deka writes Why Arthur Hayes Is Bullish on Bitcoin Under Trump’s Economic Strategy
Mandy Williams writes Why the Bitcoin Market Is Stuck—and the Key Metric That Could Change It: CryptoQuant CEO
Wayne Jones writes Metaplanet Acquires 156 BTC, Bringing Total Holdings to 2,391
Bitcoin’s price rallies after breaking above a significant resistance level. However, the 2022 bear market is not over yet until another critical level is broken to the upside.
Technical Analysis
By: Edris
The Daily Chart
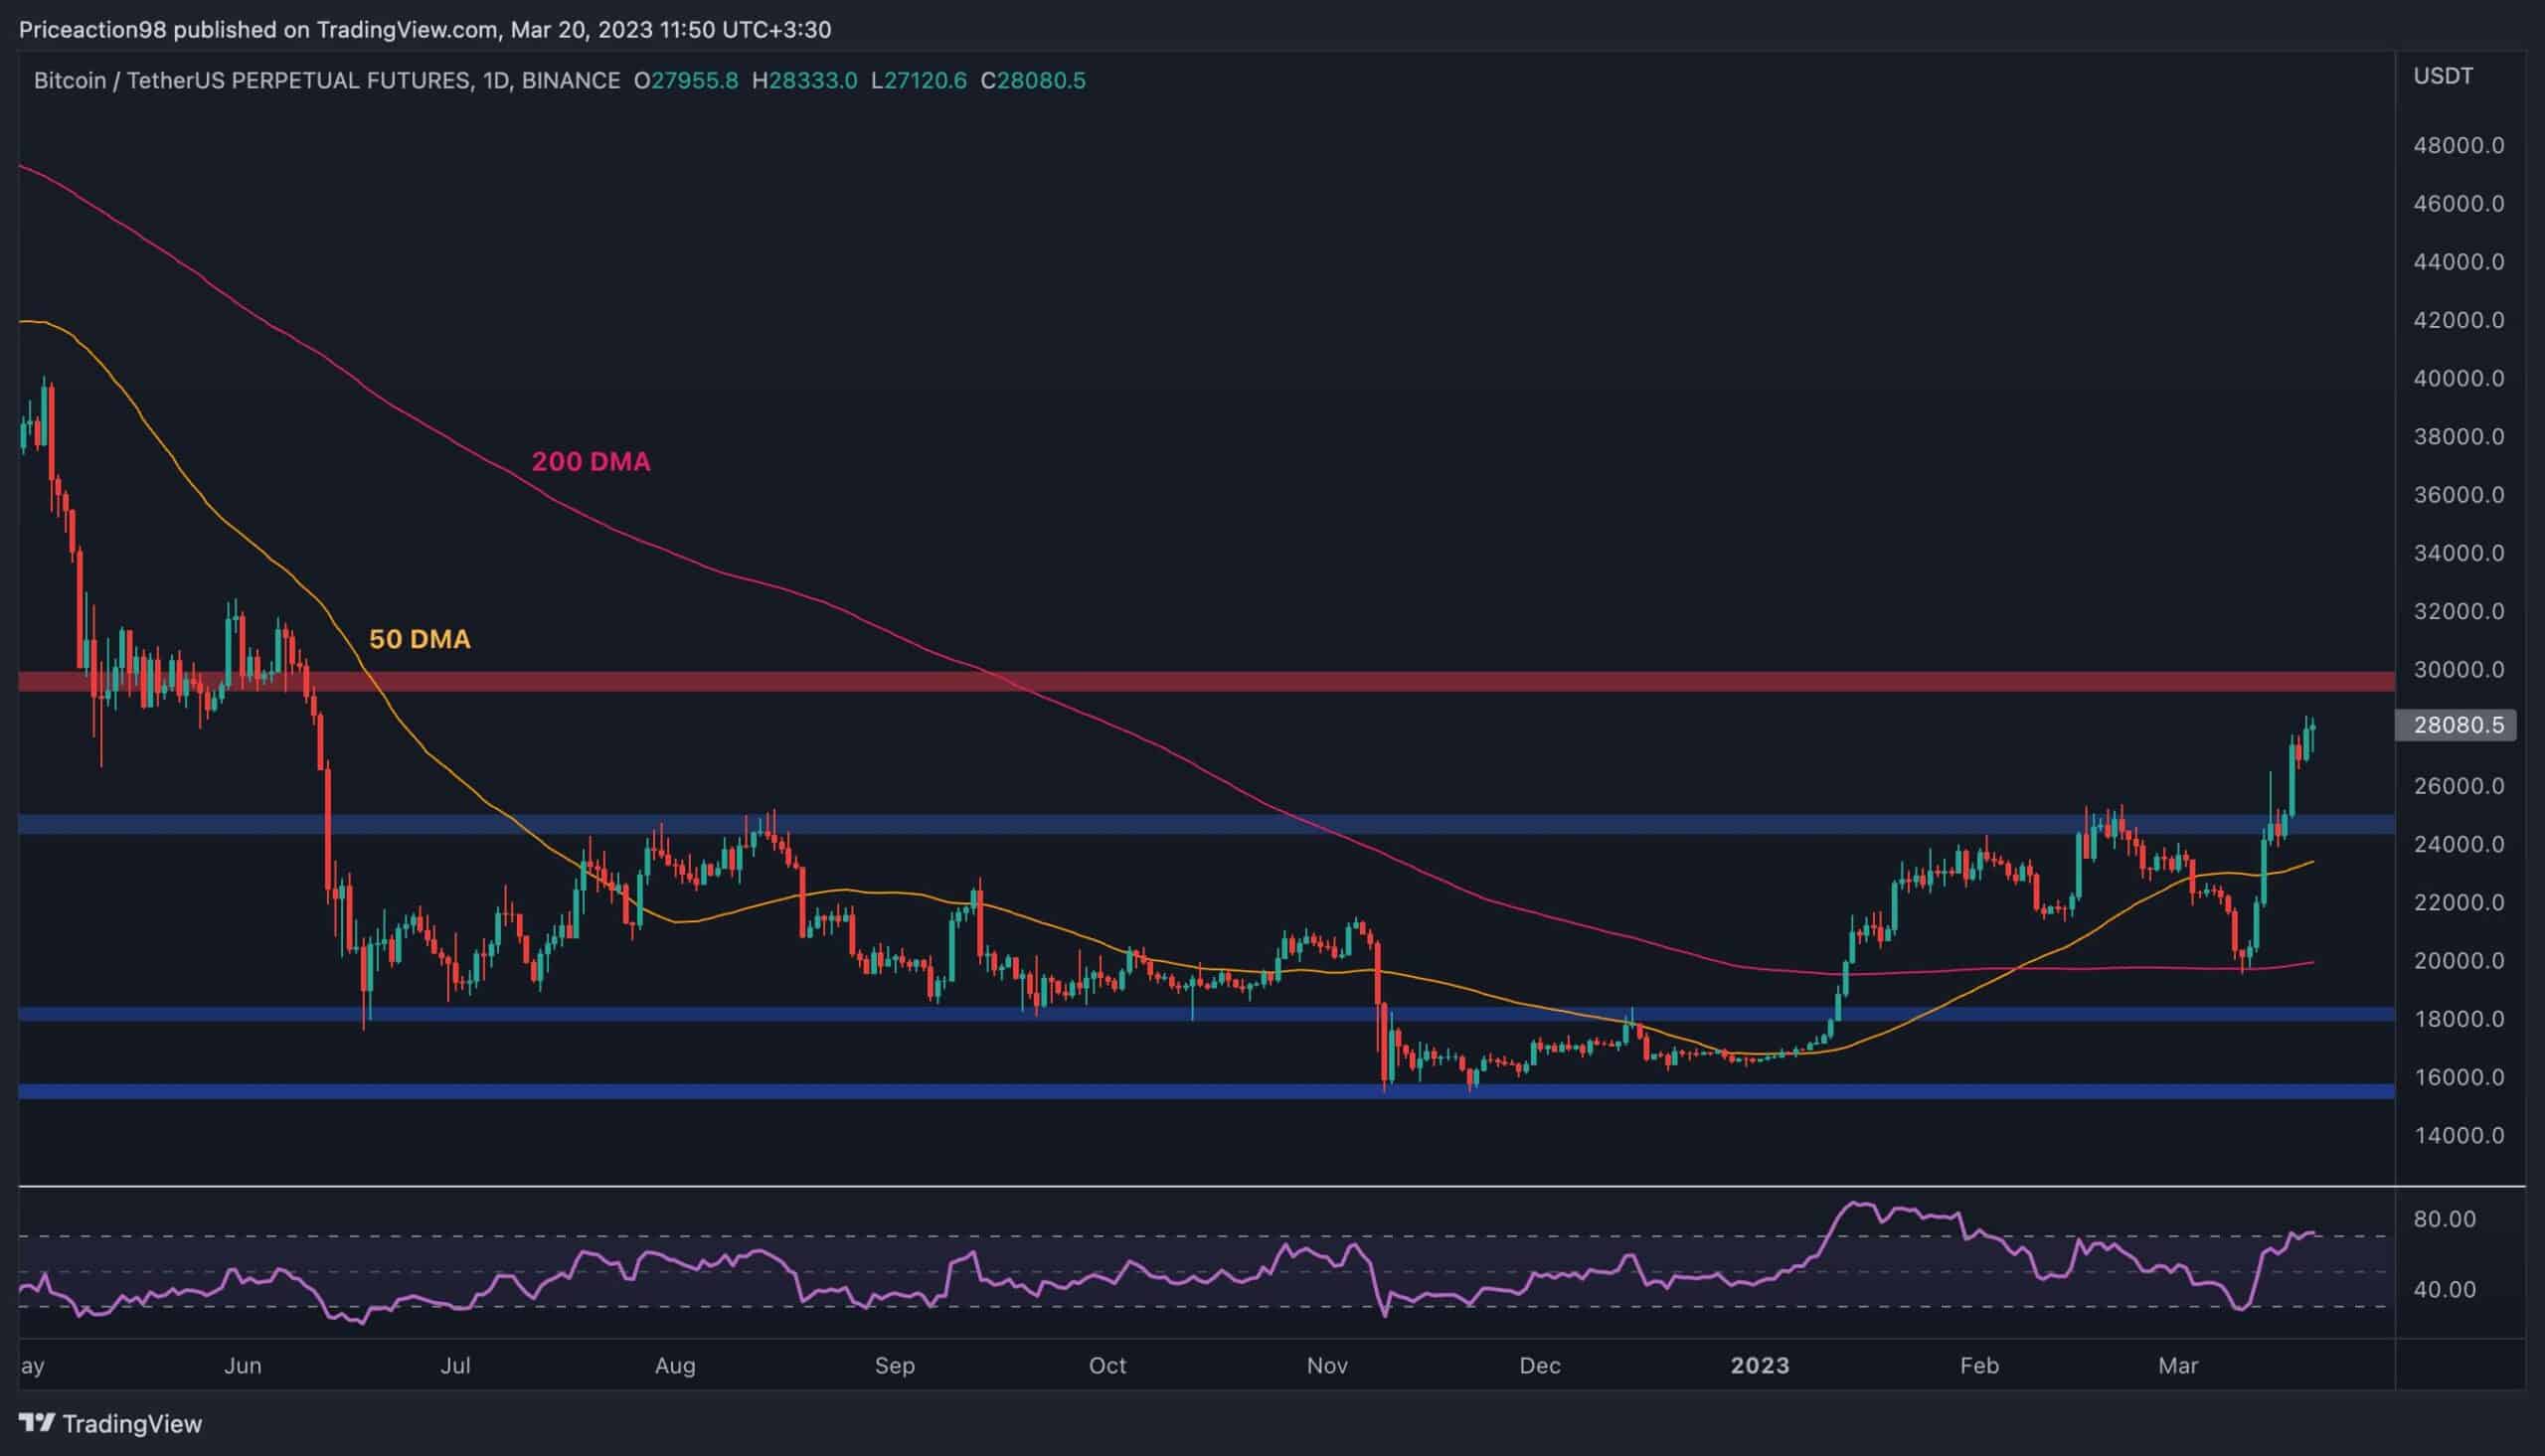
On the daily chart, Bitcoin’s price had seen a massive uptrend over the past week, following a V-shaped rebound from the 200-day moving average located amid the $20K mark, followed by a decent breakout above the $25K resistance level.
Currently, the price is heading towards the key $30K area, a mid-term resistance, in which a breakout above it would likely lead to a bullish phase in the coming months.
However, the RSI indicator has entered the overbought area and is signaling a potential pullback or consolidation in the short term. In this case, the $25K area could be tested again as it now acts as a support level.
The 4-Hour Chart
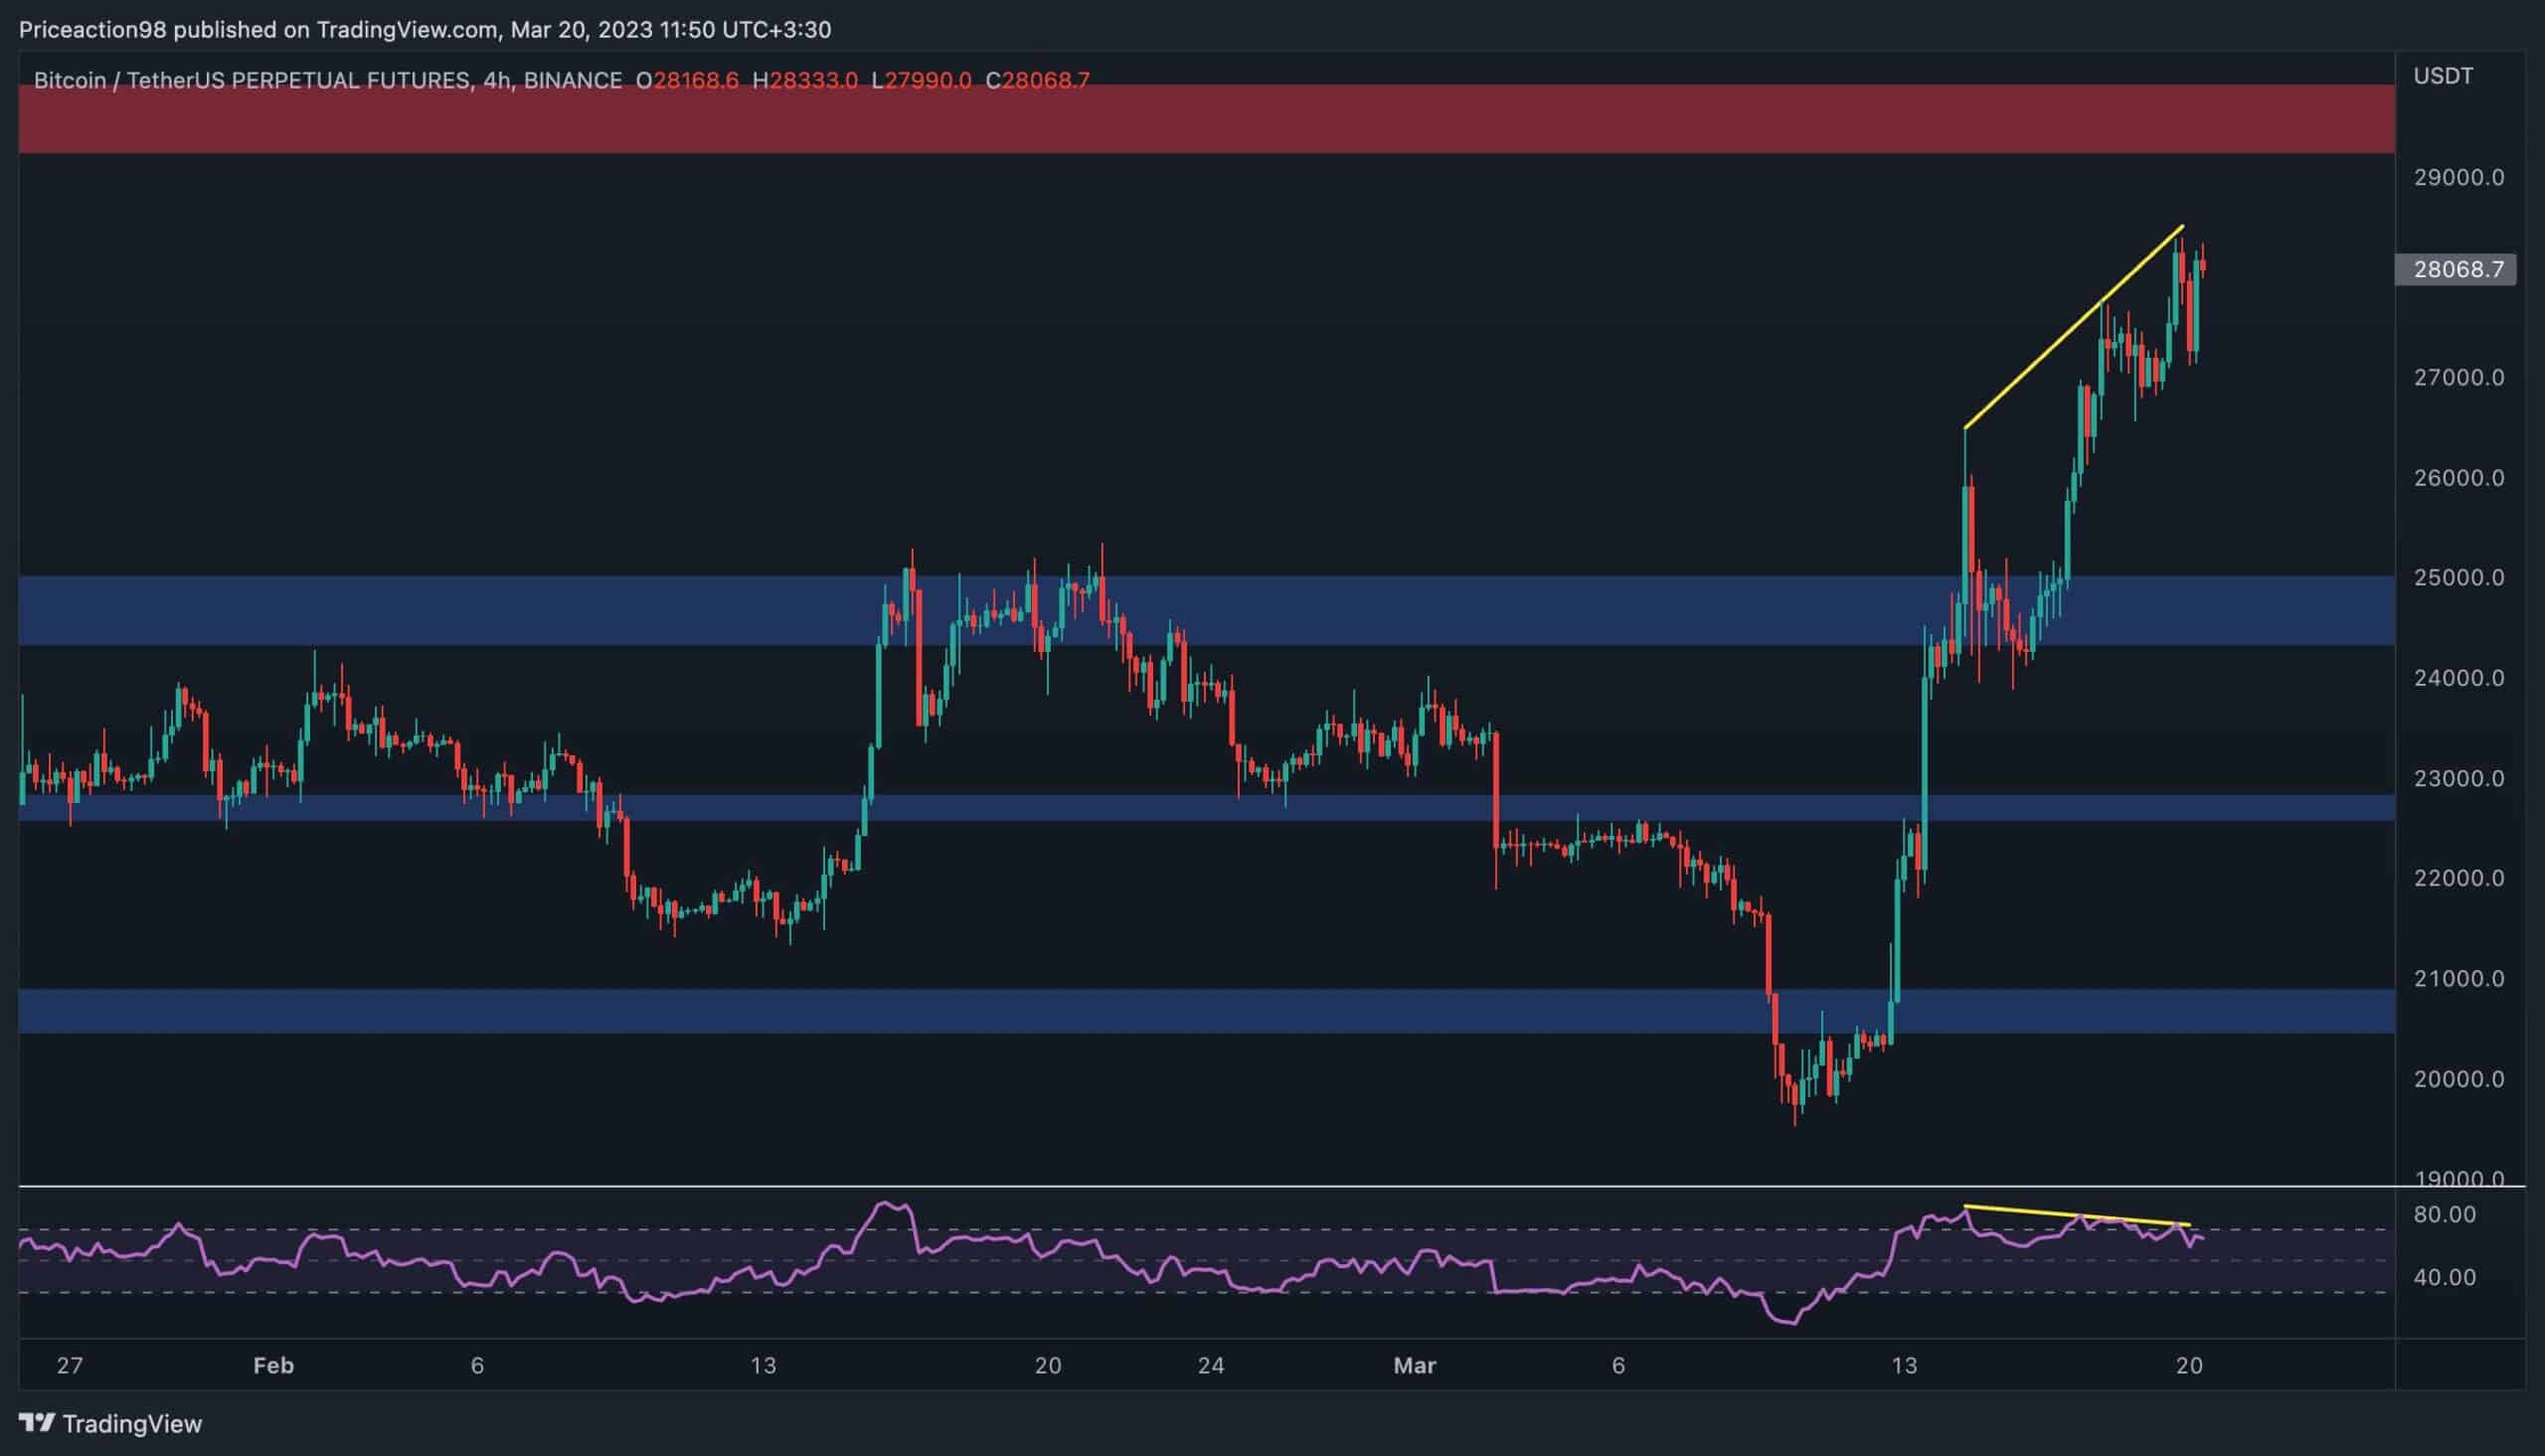
In the 4-hour time frame, the price of Bitcoin has been rising almost vertically. It recently broke the $25K level and retested it before continuing to rise.
While the market structure is bullish on this time frame, a consolidation or pullback is still possible because the 4-hour RSI indicator indicates a clear bearish divergence between recent price highs. Although the $25K level should provide support, a deeper pullback could lead to a retest of the $23K level.
Despite the above, considering the price action on both the daily and 4-hour charts, it may only be a matter of time before Bitcoin reaches the $30K mark for the first time in almost a year. The pullback could get delayed till reaching the $30K level.
On-chain Analysis
By Shayan
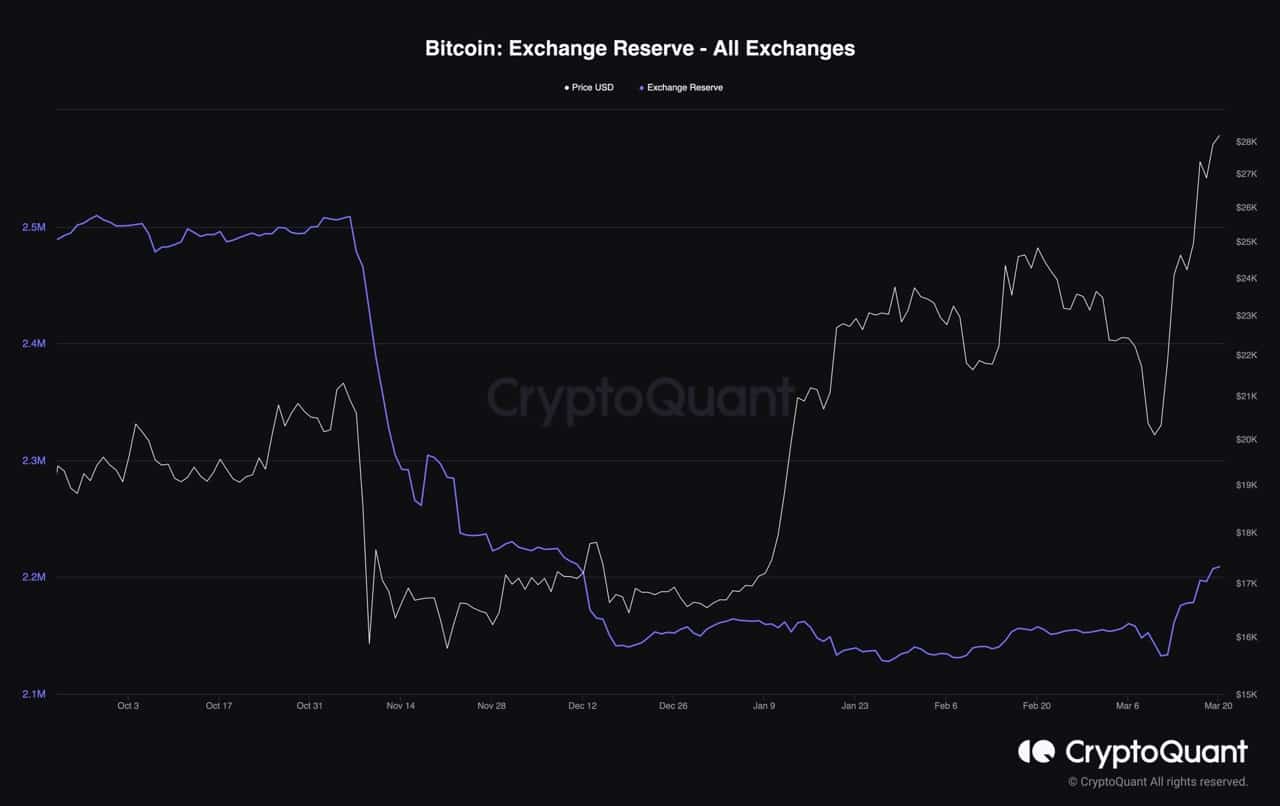
Bitcoin’s price has initiated a powerful uptrend during the last few weeks, printing a sudden surge. However, the market participant, especially the retail investors, might find the recent price increase an opportunity to realize some profits and manage their risk.
As the chart below shows, the Exchange Reserves metric had declined until the price suddenly surged and surpassed the $25K crucial level. Since then, the metric has seen a slight increase and started an uptrend, meaning that the inflows to the exchanges exceed the outflows, and participants are sending bitcoin to exchanges with the purpose of selling. This metric’s behavior should be tracked in the upcoming days.