After a period of sustained upward momentum characterized by higher highs and higher lows, the price has reached a critical resistance zone where the 100 and 200-day moving averages intersect. This is a crucial juncture where the price could either undergo a pullback and enter a downtrend or break through the zone and aim for the K mark. Technical Analysis By Shayan The Daily Chart Analyzing the daily chart, Bitcoin went through a consolidation phase around the K mark before gaining momentum and entering an uptrend. This bullish move pushed the price towards a significant resistance region at K, where the 100-day and 200-day moving averages converge. Considering the importance of this resistance area, there is a high probability of rejection, leading to a pullback
Topics:
CryptoVizArt considers the following as important: Bitcoin (BTC) Price, BTC Analysis, BTCEUR, BTCGBP, btcusd, btcusdt
This could be interesting, too:
Mandy Williams writes Bitcoin ETFs Record Over .6B in Outflows in the Past 2 Weeks
Chayanika Deka writes Bitcoin Whales Offload 6,813 BTC as Selling Pressure Mounts
Wayne Jones writes Bitcoin Sentiment Hits 2022 Lows as Fear & Greed Index Falls to 10
Jordan Lyanchev writes Bitcoin Falls Below K for the First Time in 3 Months, How Much Lower Can It Go?
After a period of sustained upward momentum characterized by higher highs and higher lows, the price has reached a critical resistance zone where the 100 and 200-day moving averages intersect.
This is a crucial juncture where the price could either undergo a pullback and enter a downtrend or break through the zone and aim for the $30K mark.
Technical Analysis
By Shayan
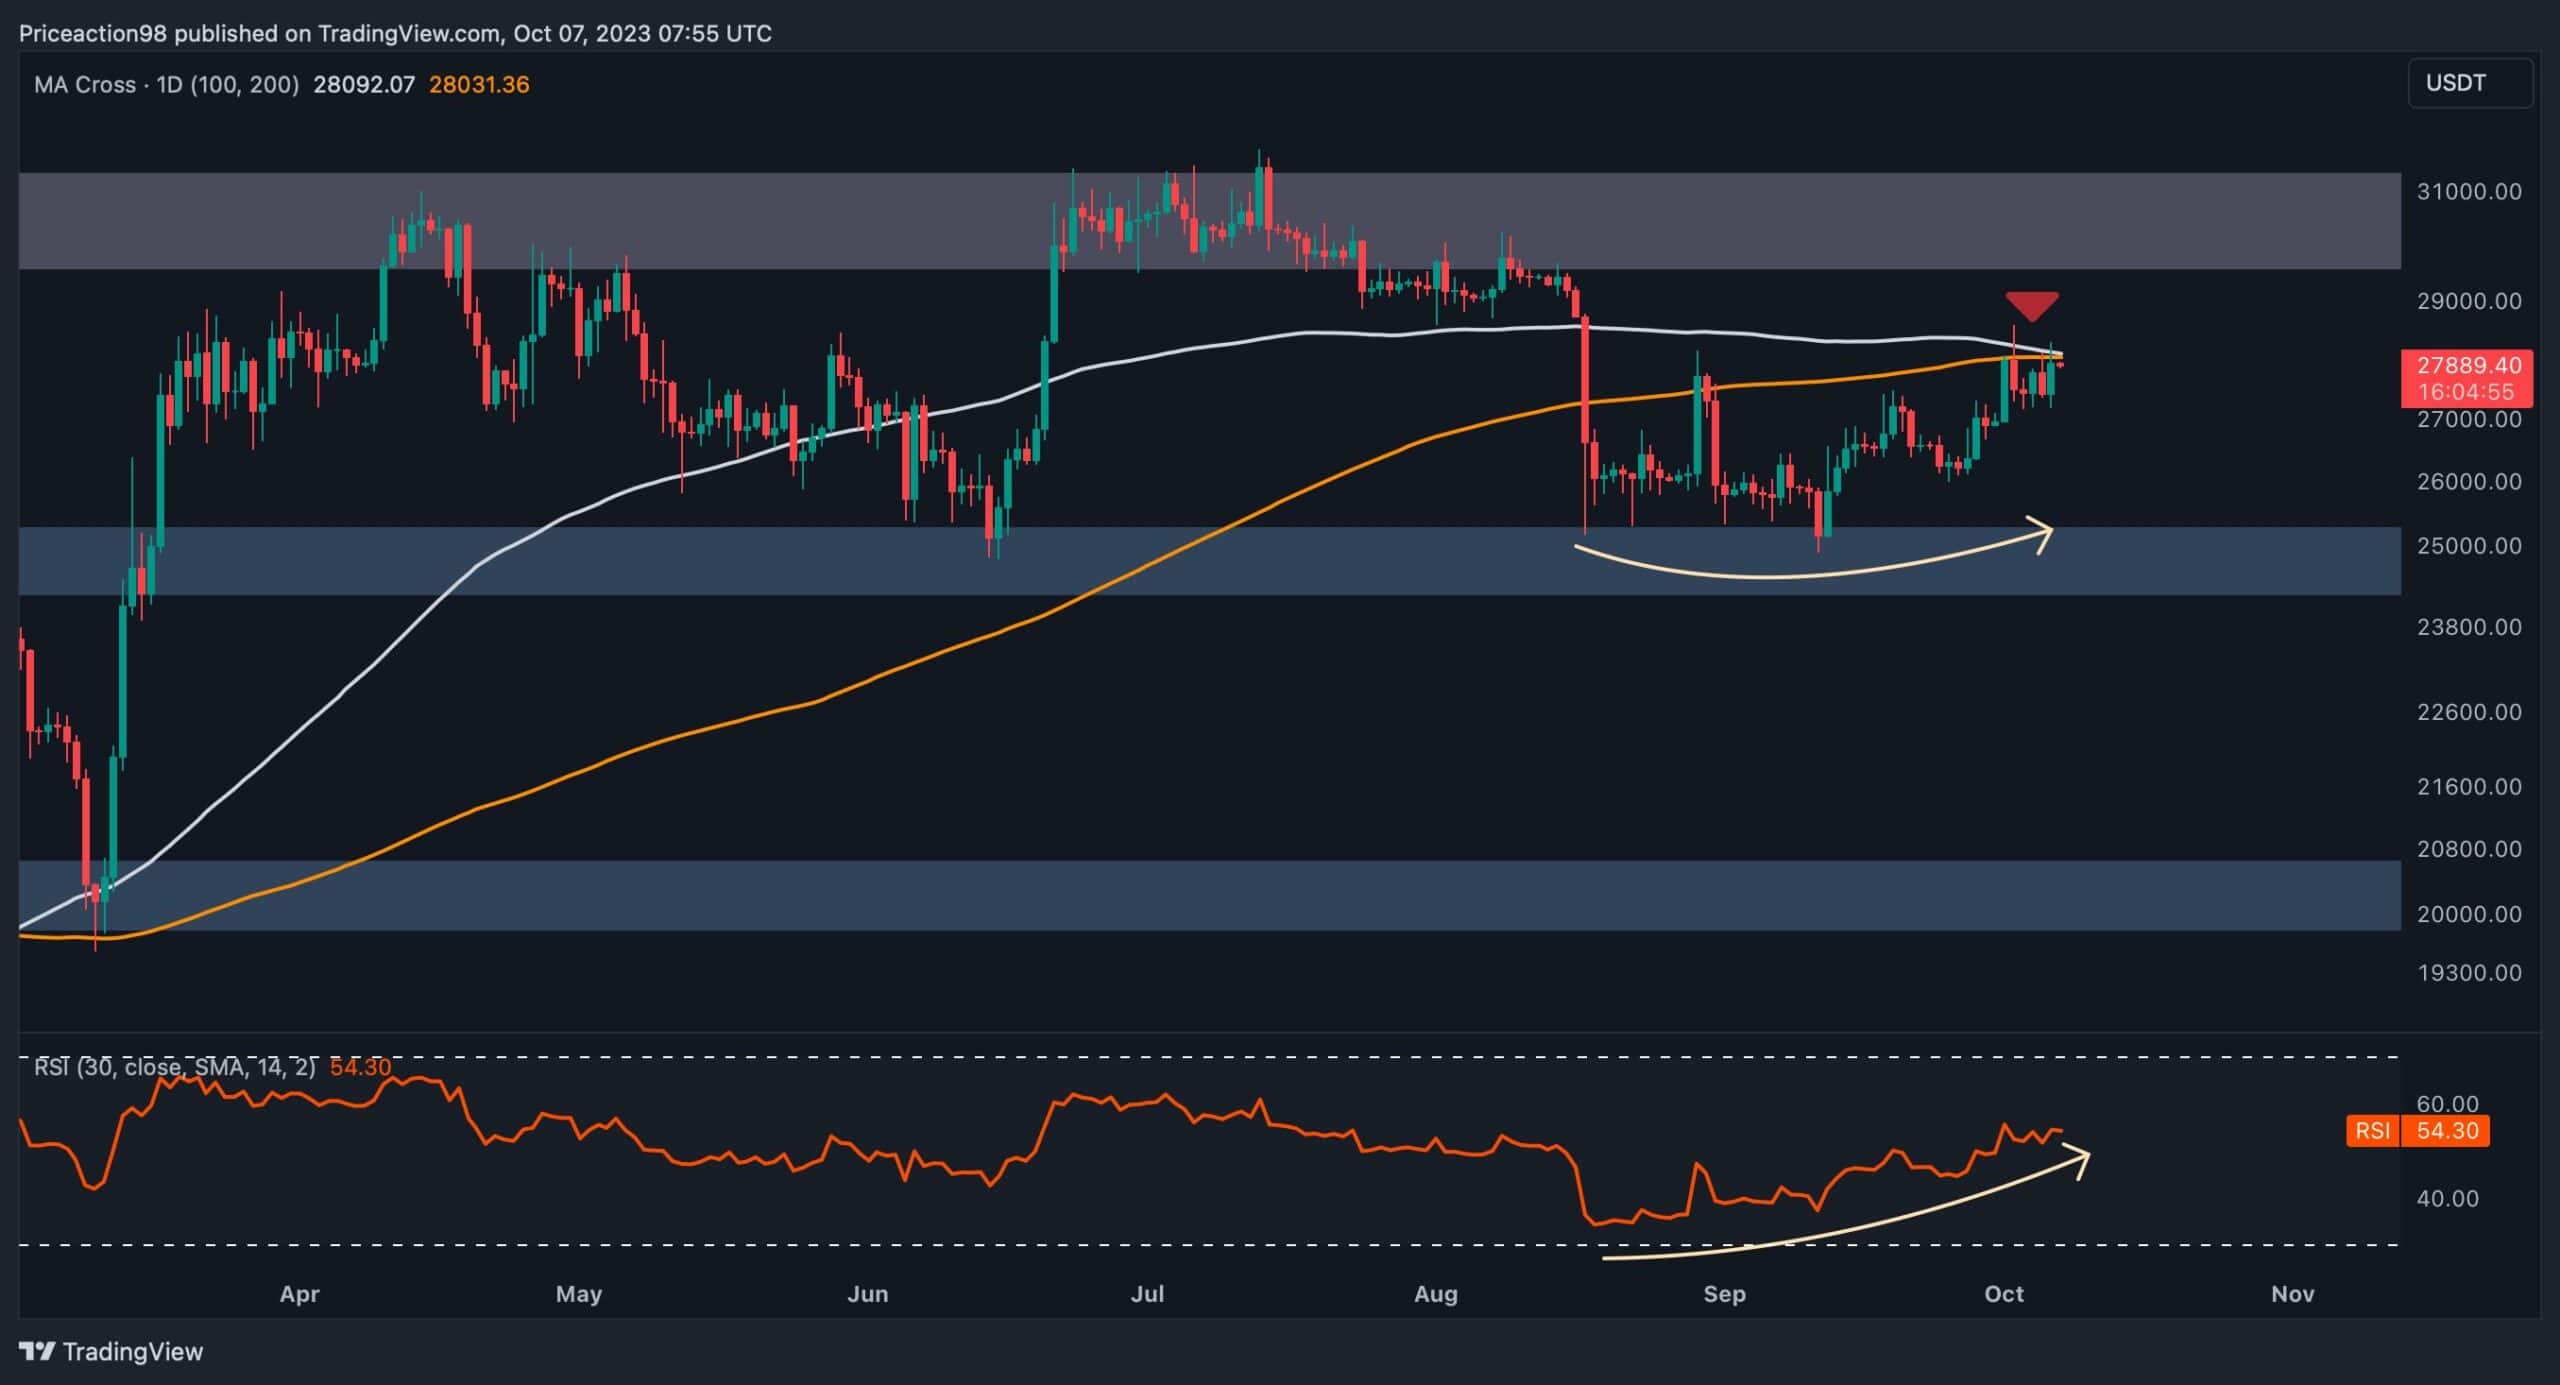
The Daily Chart
Analyzing the daily chart, Bitcoin went through a consolidation phase around the $25K mark before gaining momentum and entering an uptrend. This bullish move pushed the price towards a significant resistance region at $28K, where the 100-day and 200-day moving averages converge.
Considering the importance of this resistance area, there is a high probability of rejection, leading to a pullback and potentially initiating a sharp downtrend. However, there is a small chance that buyers could hold the price and push it above the moving averages, reinstating bullish sentiment in the market.
Regardless of the outcome, monitoring the price action closely in the coming days is crucial, as increased volatility can be expected in the medium term.
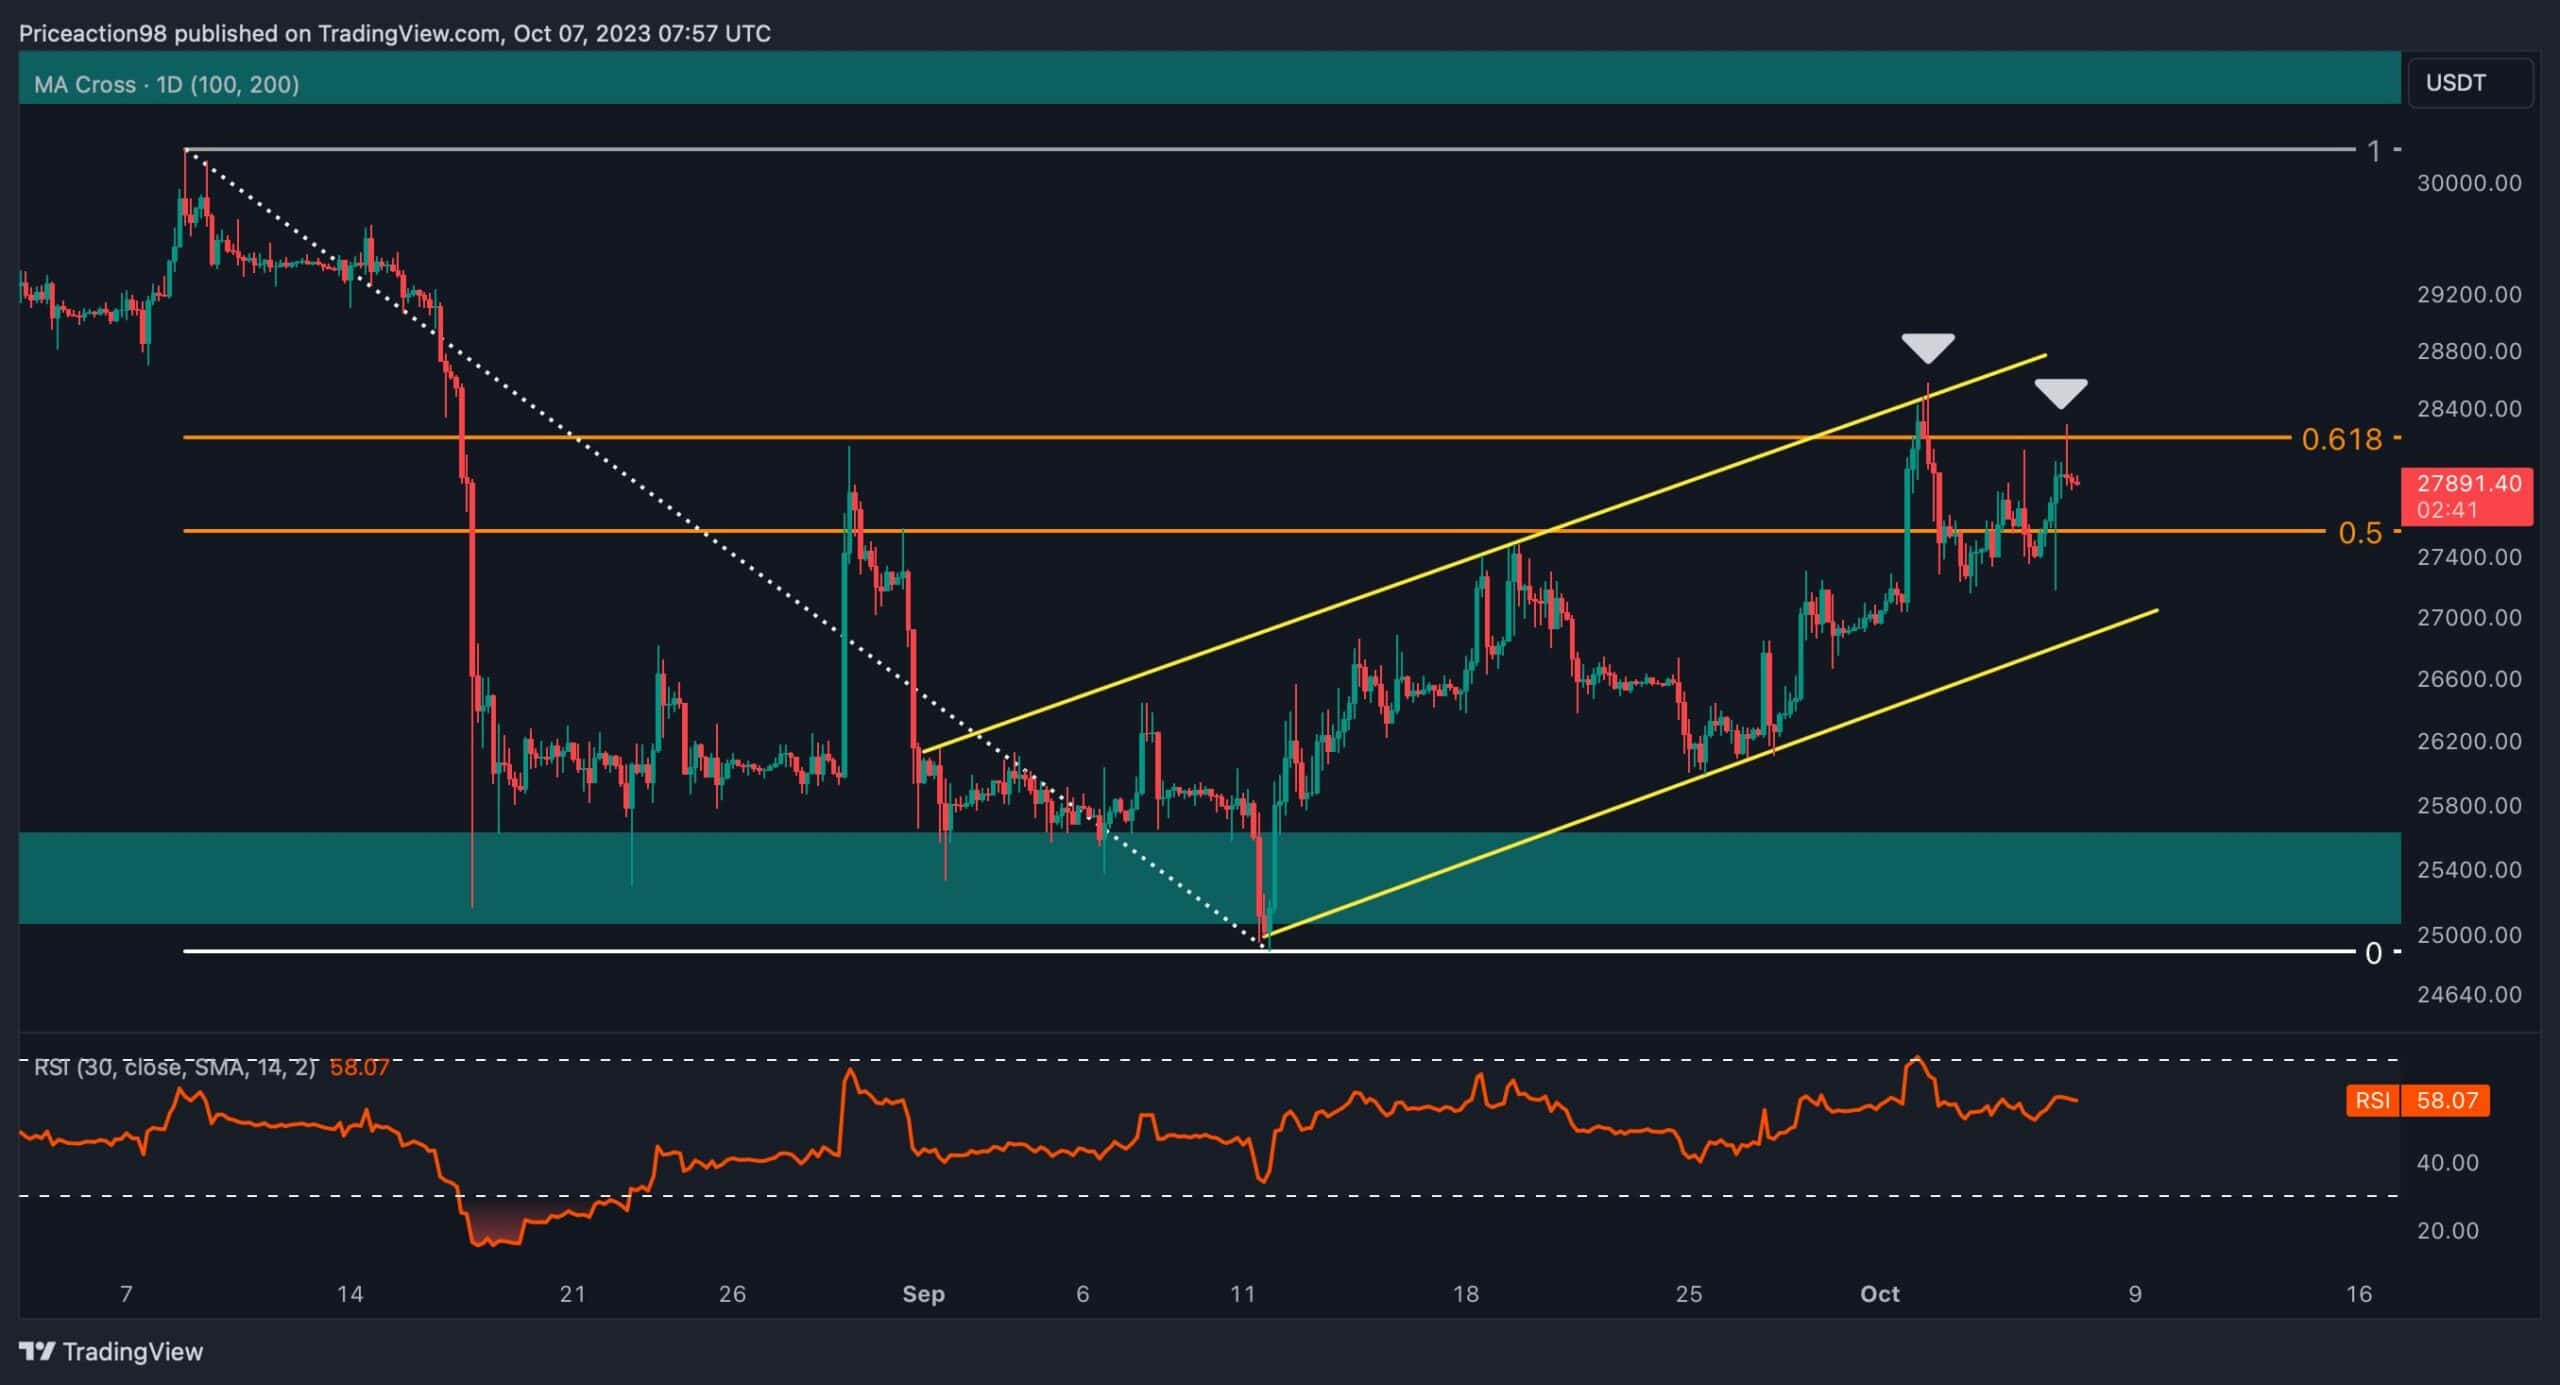
The 4-Hour Chart
Shifting the focus to the 4-hour timeframe, Bitcoin found strong support at $25K after a significant decline. The subsequent uptrend saw the price consistently surpassing previous highs, indicating growing interest among market participants.
However, the cryptocurrency has been trading within an ascending channel and was rejected from the upper trendline, which aligns with the 0.618 Fibonacci retracement level for the third time. This pattern suggests that sellers are dominant and indicates the potential for another downward movement in Bitcoin’s price.
Despite these bearish signals, if the price manages to unexpectedly break through this critical resistance region and shows signs of strength, it could pave the way for a sudden surge toward the $30K mark. The market’s response to these key levels will determine Bitcoin’s short-term trajectory.
On-Chain Analysis
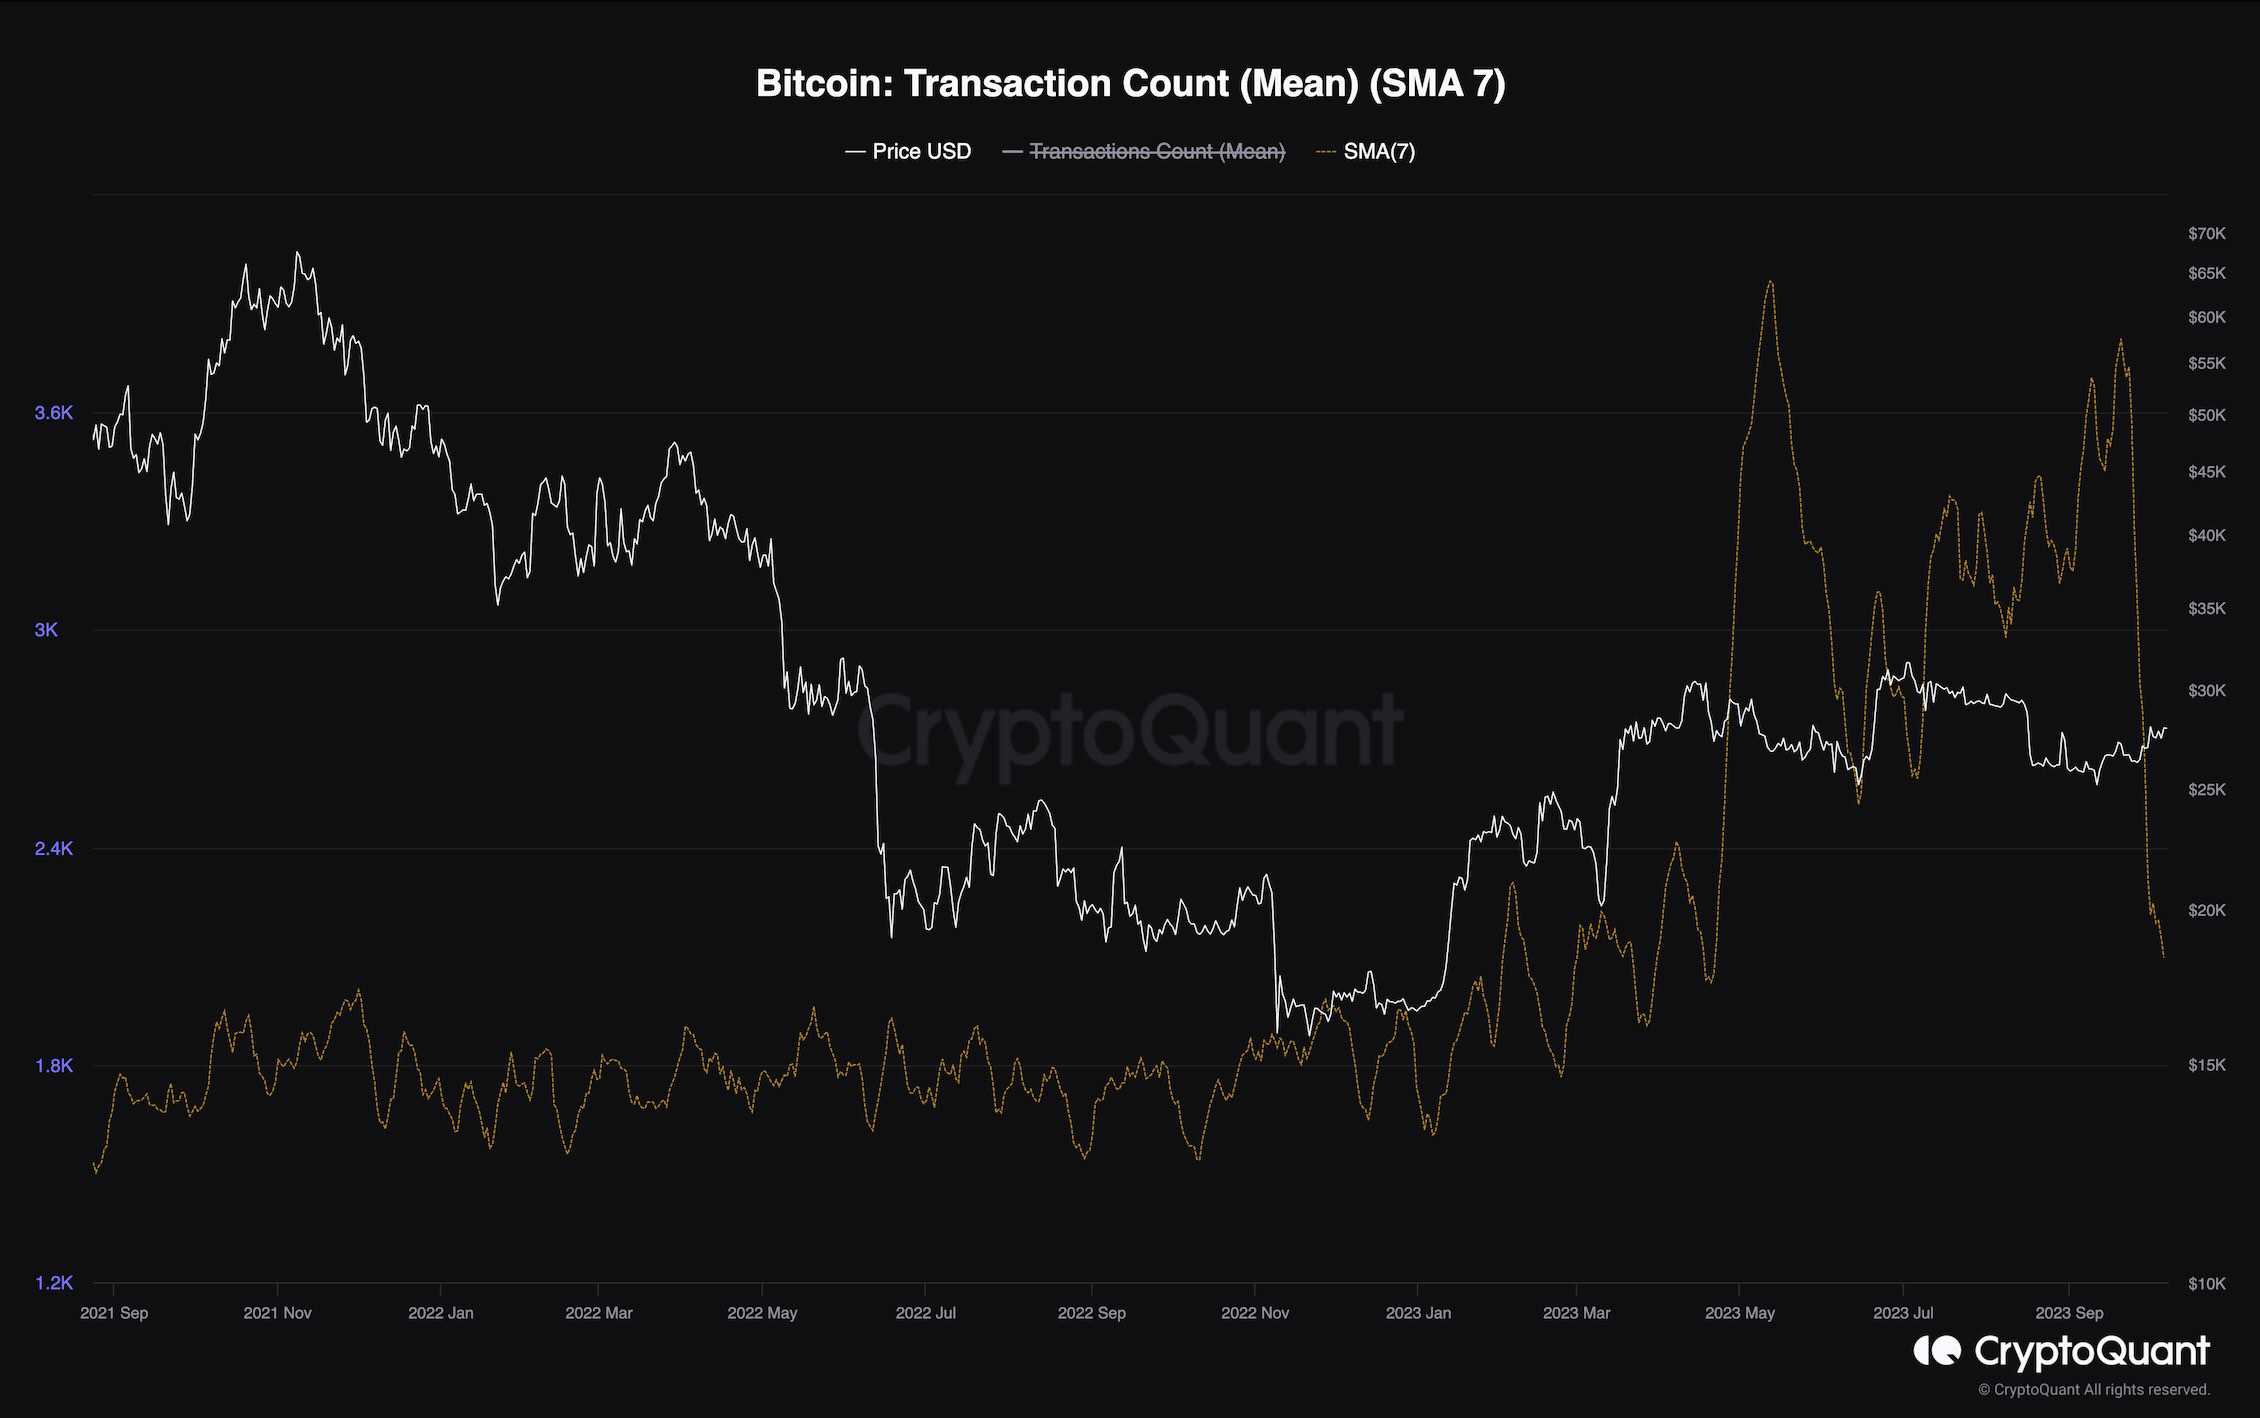
Transaction Count (Mean)
By Edris
Following the recent bounce in Bitcoin’s price, there has been a significant increase in network activity. The on-chain transaction count is commonly used to measure this activity. Historically, there has been a positive correlation between Bitcoin’s price and this metric, indicating that increases in activity often lead to price rallies.
The chart shows the 7-day moving average of the mean transaction count. This metric has been increasing since the beginning of Bitcoin’s price rise towards $30K. However, there has been a recent sharp drop in transaction counts. This is not a positive sign and could have a negative impact on the market soon. If network activity does not pick up again, the price may experience a decline shortly.