Bitcoin’s price has been dropping continuously over the last week, and there may still be more. However, the bearish momentum is much lower than expected, and multiple support levels are available for the market to rely on. Technical Analysis By: Edris The Daily Chart Looking at the daily timeframe, the price has been declining since getting rejected from the K resistance level in April, and it has also broken below the 50-day moving average, located around the K mark. Judging by the recent candlestick shapes, a bullish pullback to the broken moving average could be likely. Yet, the price could still push lower toward the K static support level before returning higher. Source: TradingViewThe 4-Hour Chart The 4-hour chart shows that BTC has broken below the ,500
Topics:
CryptoVizArt considers the following as important: Bitcoin (BTC) Price, BTC Analysis, BTCEUR, BTCGBP, btcusd, btcusdt
This could be interesting, too:
Mandy Williams writes Bitcoin ETFs Record Over .6B in Outflows in the Past 2 Weeks
Chayanika Deka writes Bitcoin Whales Offload 6,813 BTC as Selling Pressure Mounts
Wayne Jones writes Bitcoin Sentiment Hits 2022 Lows as Fear & Greed Index Falls to 10
Jordan Lyanchev writes Bitcoin Falls Below K for the First Time in 3 Months, How Much Lower Can It Go?
Bitcoin’s price has been dropping continuously over the last week, and there may still be more. However, the bearish momentum is much lower than expected, and multiple support levels are available for the market to rely on.
Technical Analysis
By: Edris
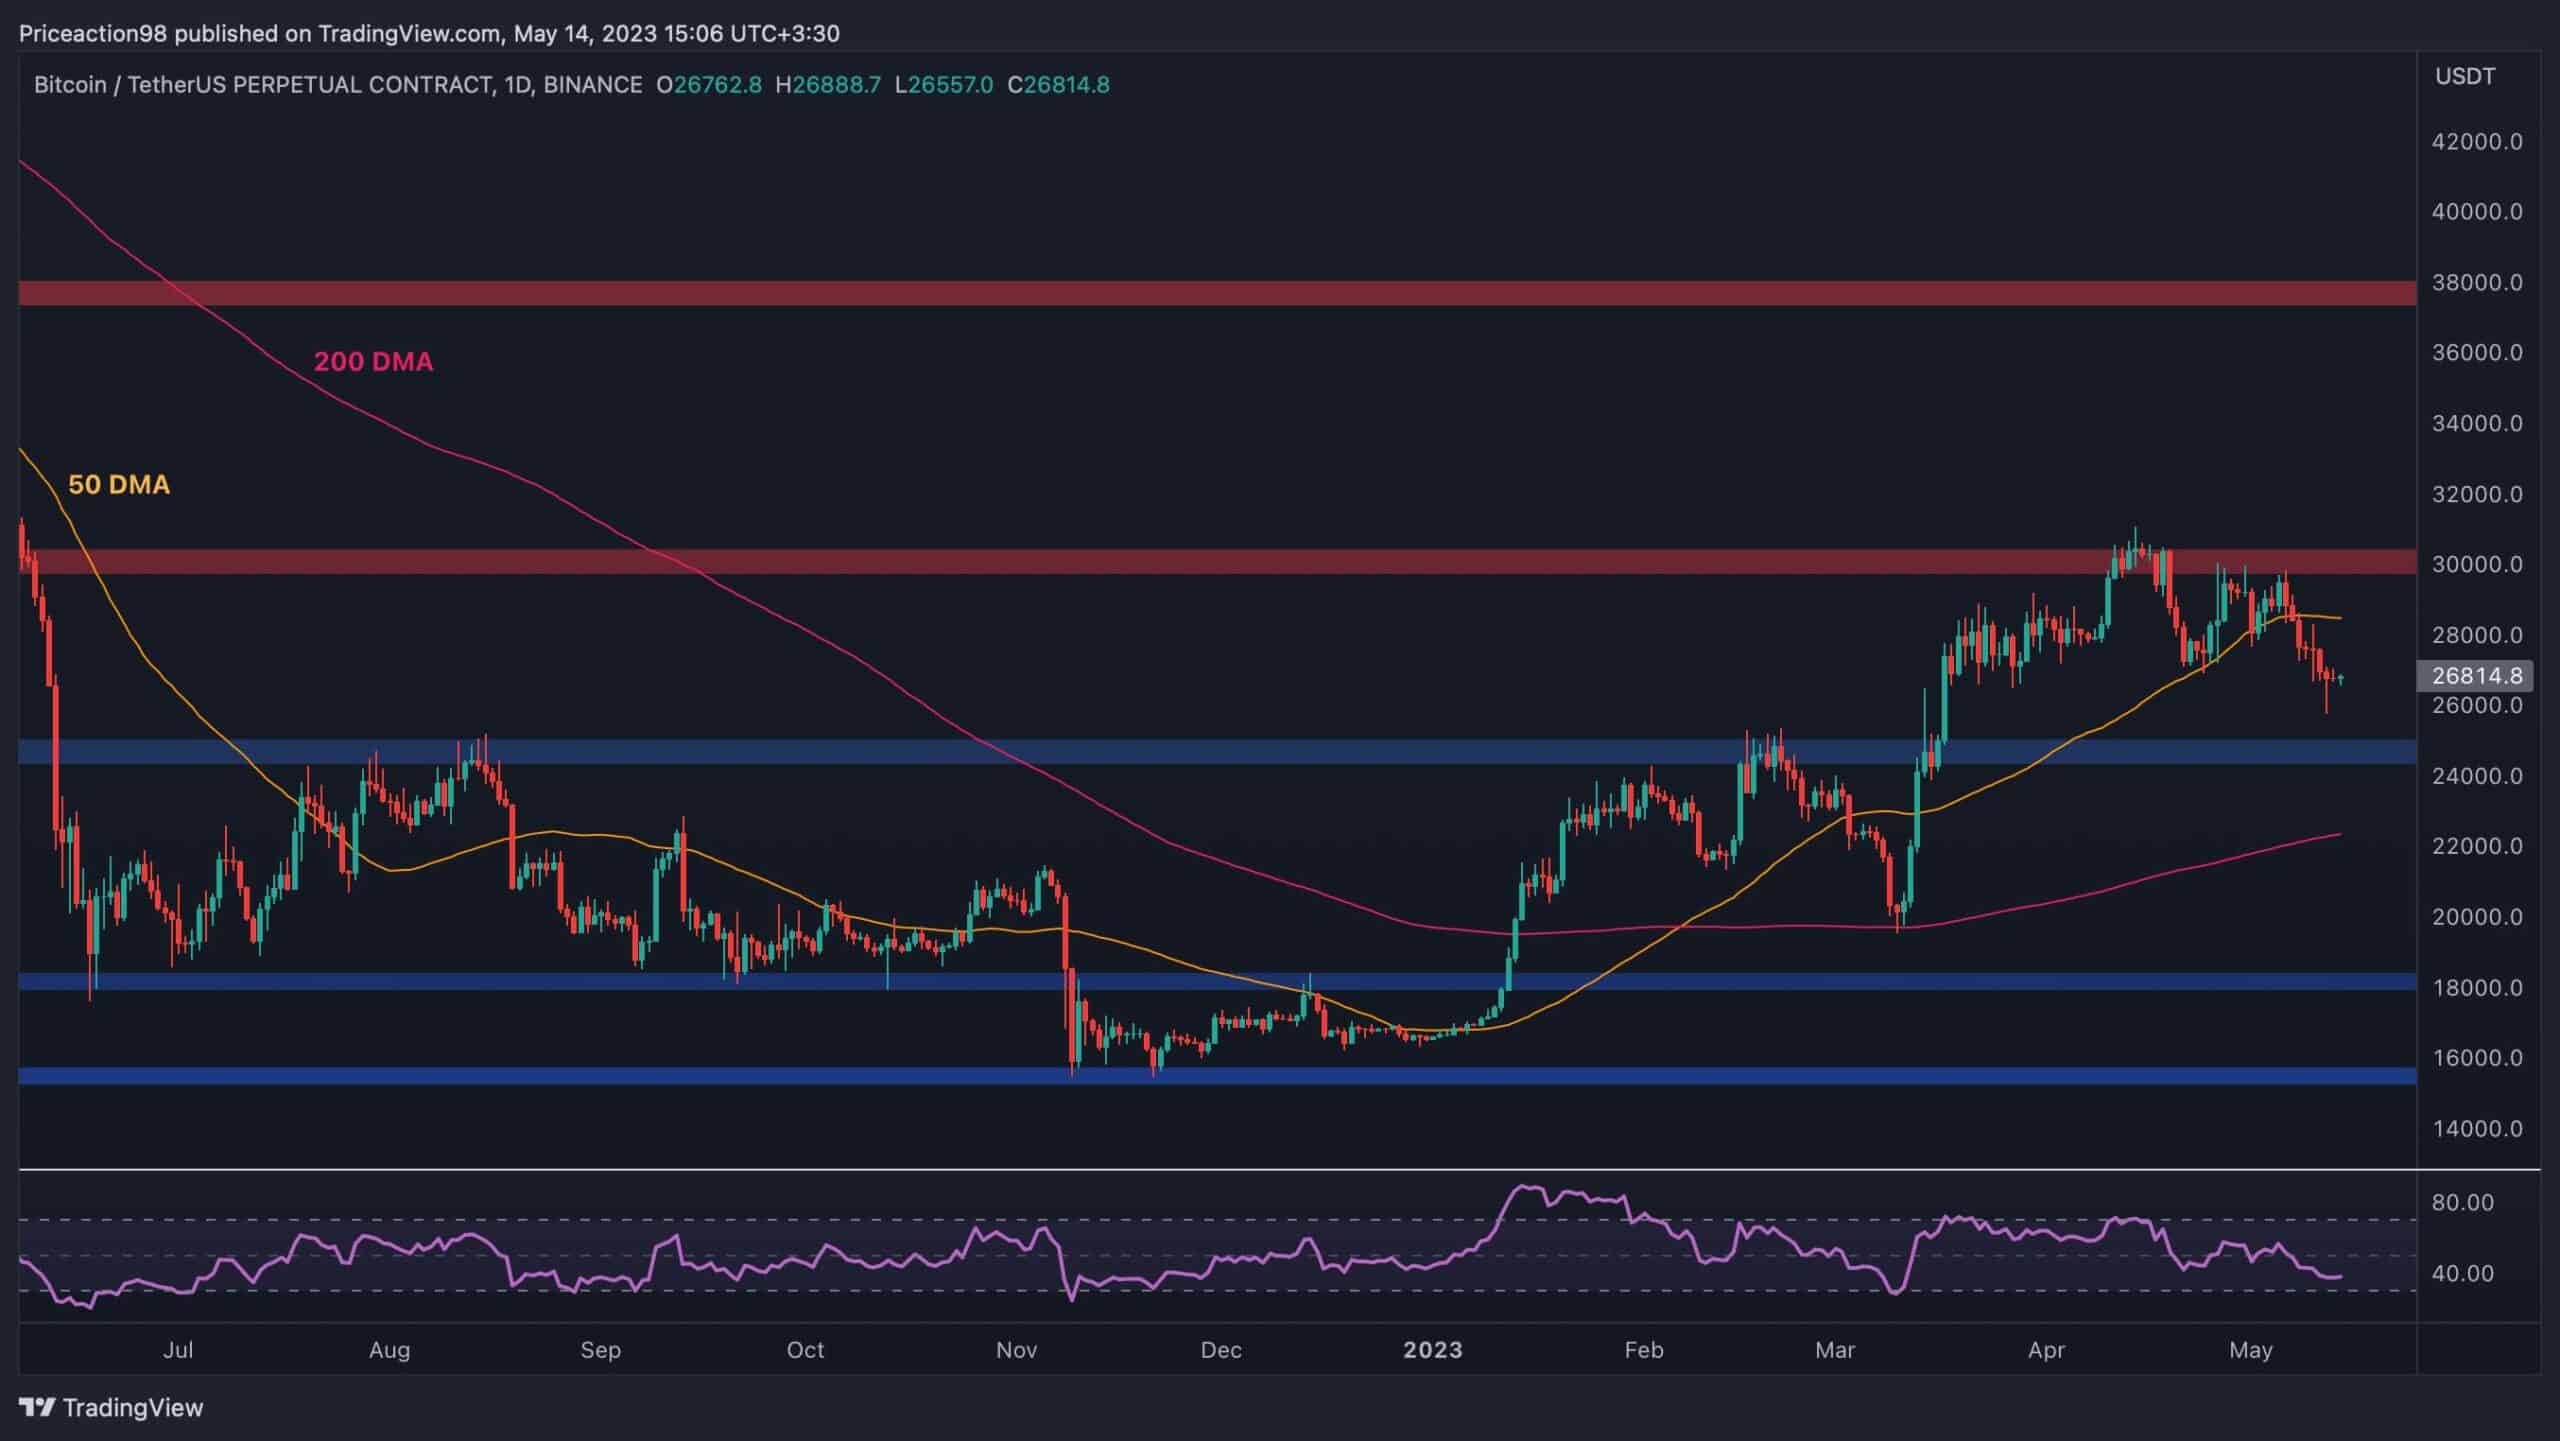
The Daily Chart
Looking at the daily timeframe, the price has been declining since getting rejected from the $30K resistance level in April, and it has also broken below the 50-day moving average, located around the $29K mark.
Judging by the recent candlestick shapes, a bullish pullback to the broken moving average could be likely. Yet, the price could still push lower toward the $25K static support level before returning higher.
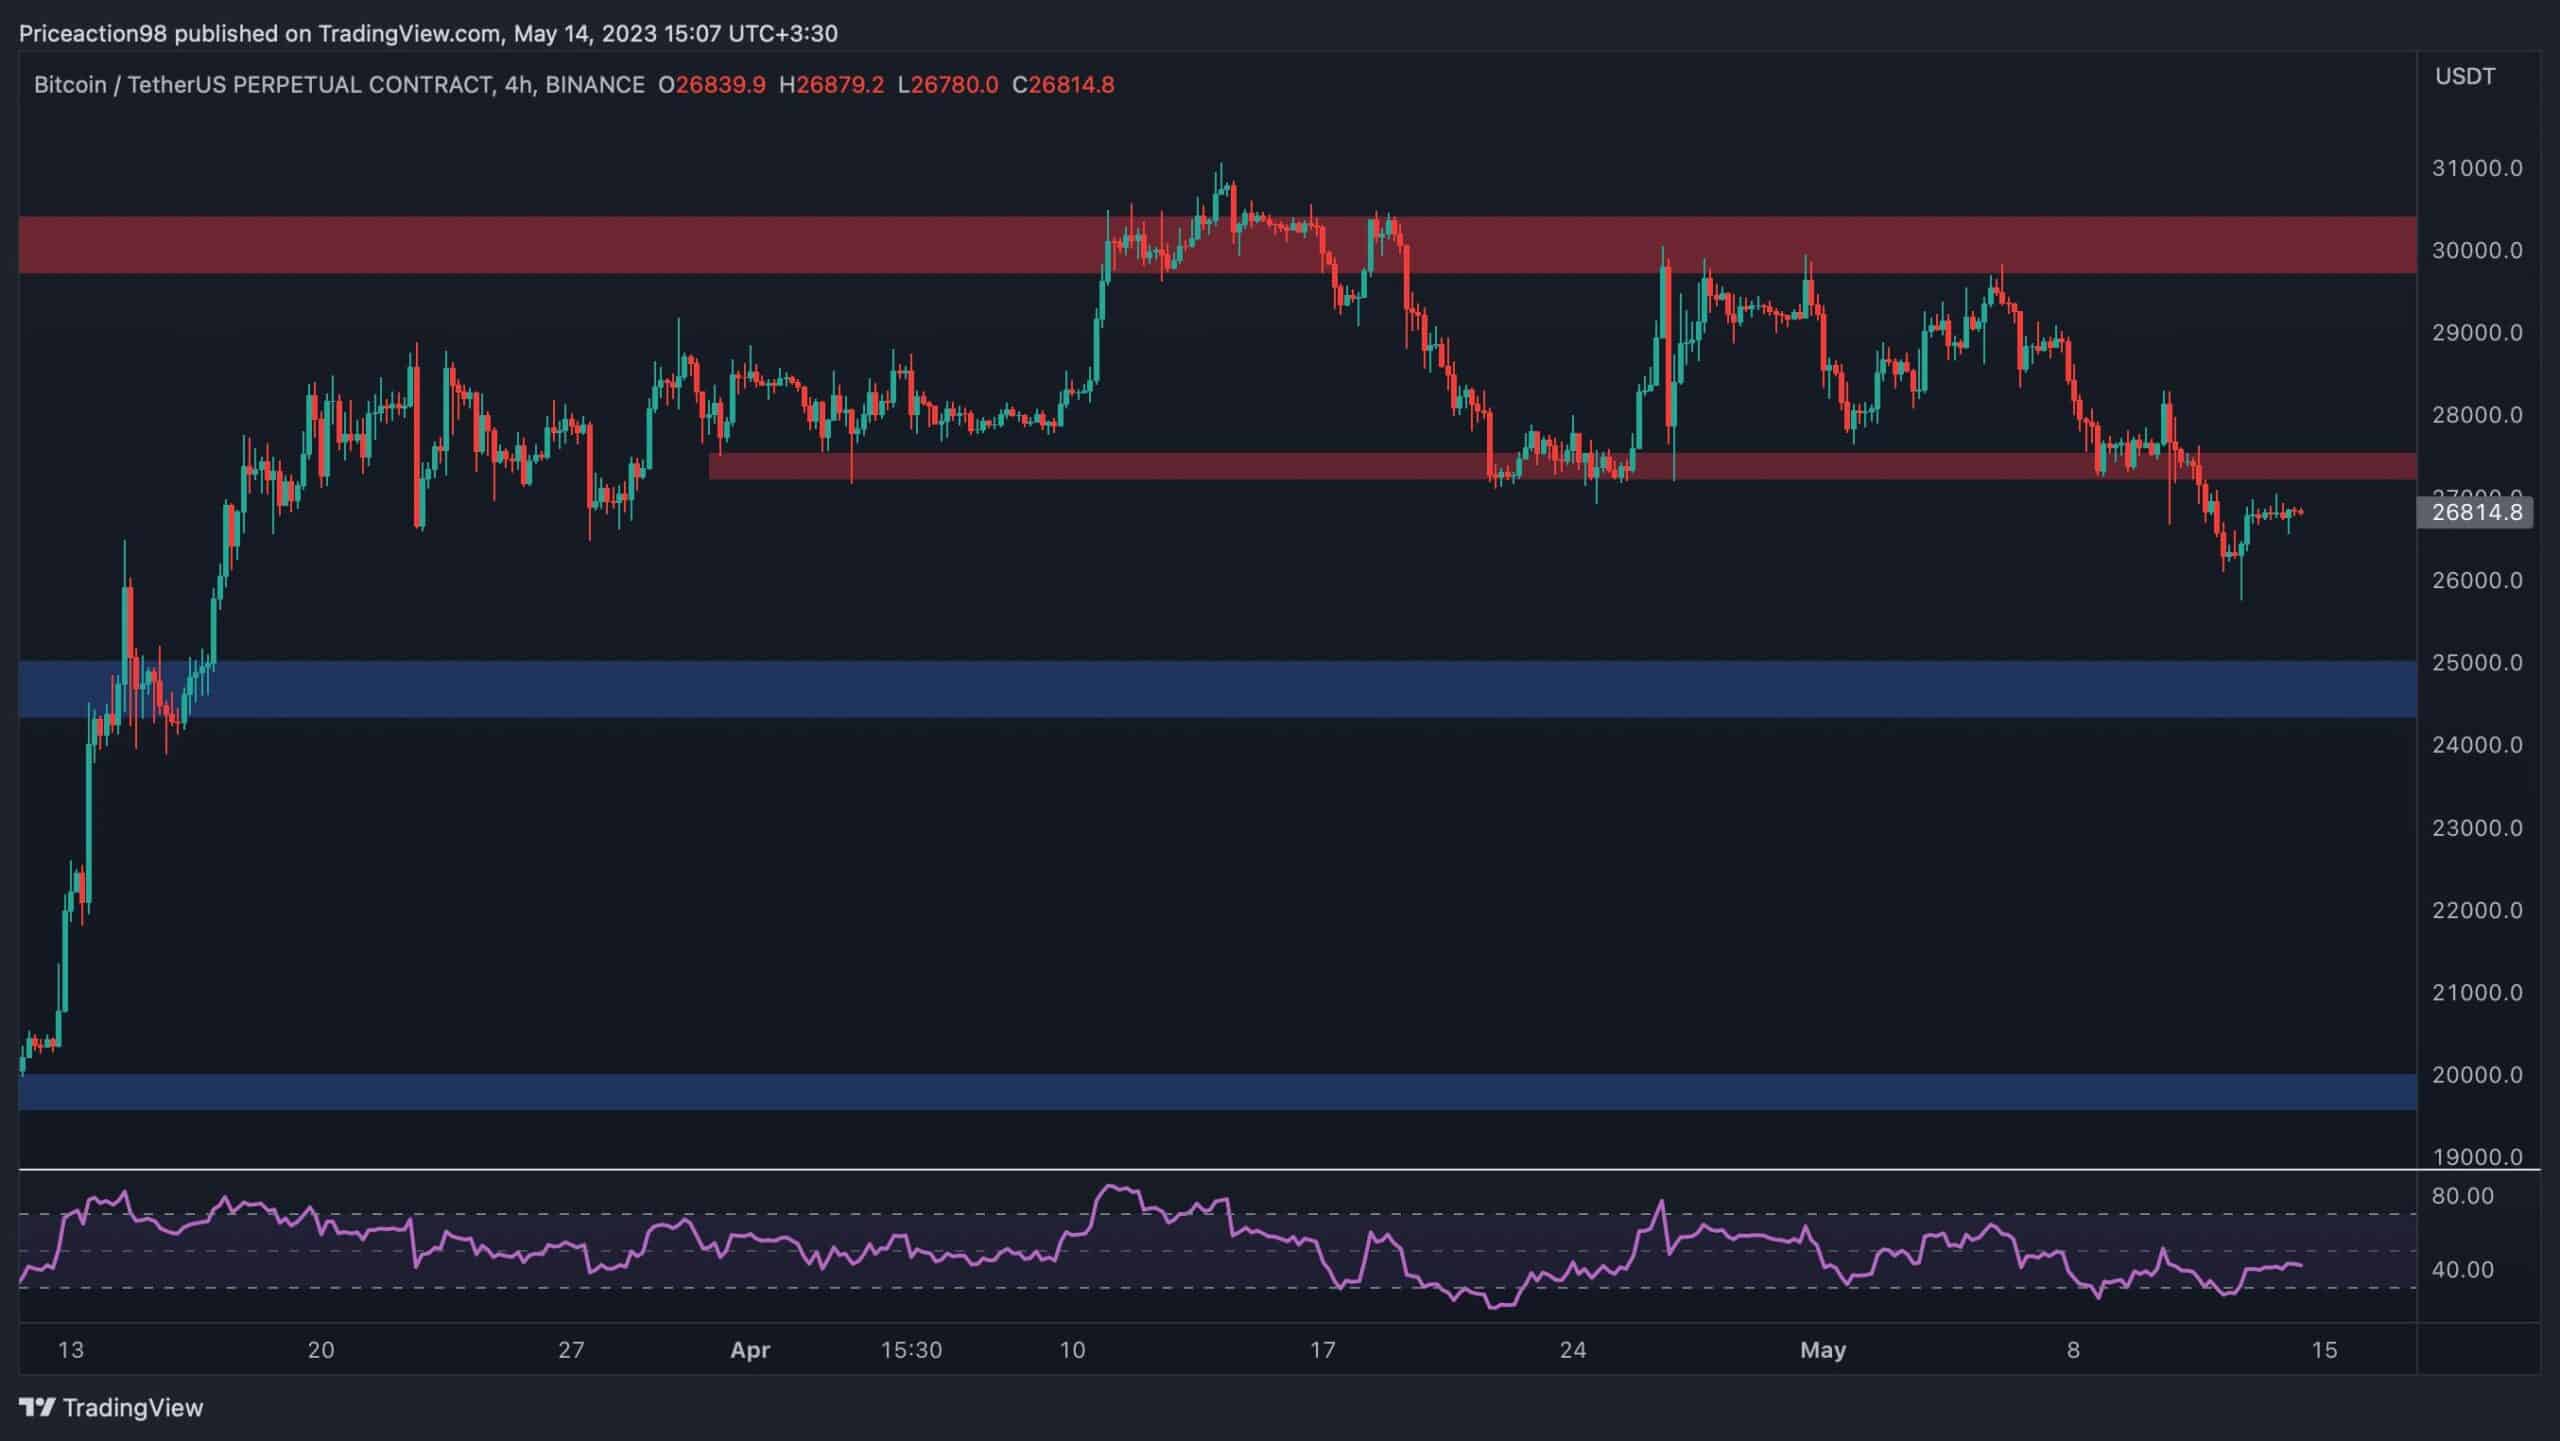
The 4-Hour Chart
The 4-hour chart shows that BTC has broken below the $27,500 minor support level and is likely to test the $25K zone in the coming days. However, with the RSI rising back above the oversold area and a clear bullish divergence being displayed between the two recent lows, a retest of the $27,500 level, which now acts as a resistance, could be expected in the short term.
Yet, all things considered, the market structure in this timeframe is clearly bearish until the price rallies above the $30K resistance level.
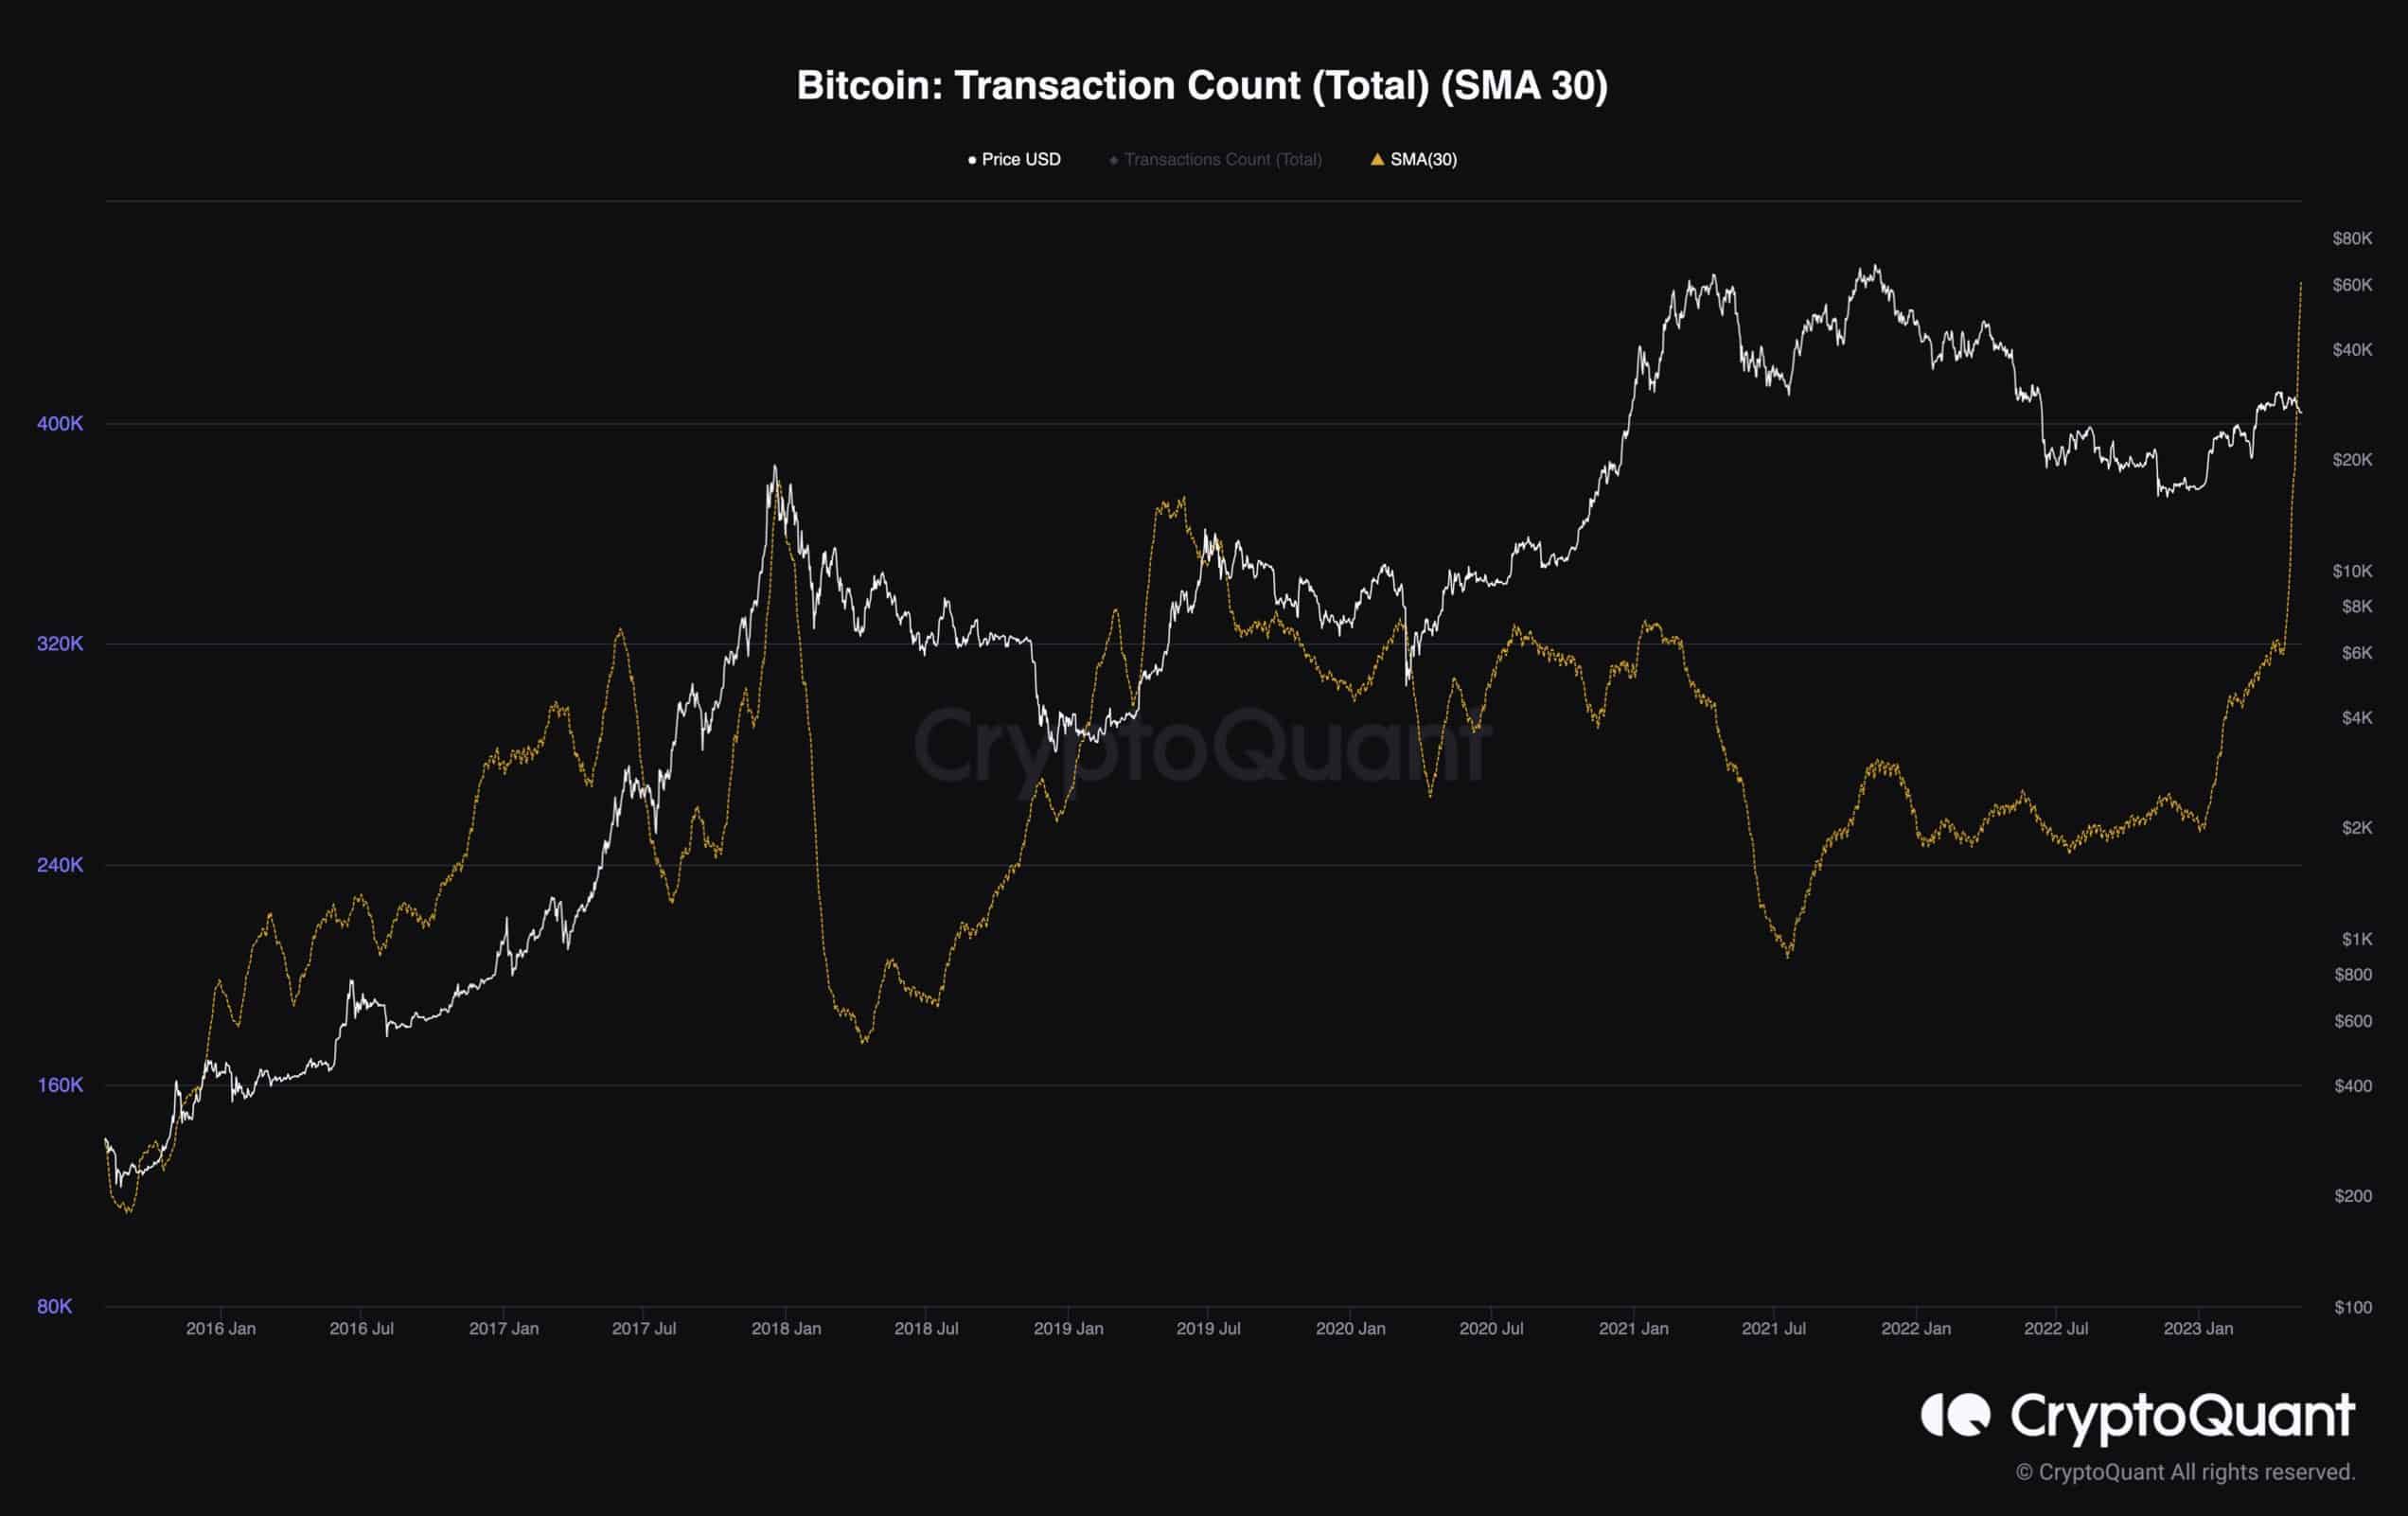
The Bitcoin network has reached an all-time high in activity, with a new record of 682,000 daily transactions. This marks a significant increase from the 250,000 daily transactions seen at the beginning of 2023. The primary reason for this surge is the rising popularity of ordinal inscriptions, mainly used to create digital assets.
Unfortunately, the surge in Bitcoin activity and the growing popularity of BRC-20 tokens have had a negative impact on the market. The Bitcoin network has become crowded, resulting in users having to pay higher transaction fees. This situation is affecting all Bitcoin participants, including everyday users and miners. As a result, trading in the BTC markets requires additional caution, as the market may experience high volatility.