Bitcoin’s recent uptrend has come to a standstill, with its value decreasing from a nine-month peak of ,180 to ,900 in the past week. Currently, the price is situated in a crucial zone, and to surpass this significant barrier posed by the K resistance level, greater demand and buying power must be generated. Technical Analysis By Shayan The Weekly Chart Bitcoin’s price has recently reached a critical price zone of ,000. The chart shows that this range is a significant resistance level, as it aligns with the major swing low that Bitcoin formed back in May 2021 after the massive crash caused by China FUD. The price action confirms this idea, as the impulsive bullish trend came to a halt as soon as Bitcoin reached this crucial resistance region. Nonetheless, the
Topics:
CryptoVizArt considers the following as important: Bitcoin (BTC) Price, BTC Analysis, BTCEUR, BTCGBP, btcusd, btcusdt
This could be interesting, too:
Chayanika Deka writes XRP, SOL, and ADA Inclusion in US Crypto Reserve Pushes Traders on Edge
Chayanika Deka writes Why Arthur Hayes Is Bullish on Bitcoin Under Trump’s Economic Strategy
Mandy Williams writes Why the Bitcoin Market Is Stuck—and the Key Metric That Could Change It: CryptoQuant CEO
Wayne Jones writes Metaplanet Acquires 156 BTC, Bringing Total Holdings to 2,391
Bitcoin’s recent uptrend has come to a standstill, with its value decreasing from a nine-month peak of $29,180 to $26,900 in the past week. Currently, the price is situated in a crucial zone, and to surpass this significant barrier posed by the $30K resistance level, greater demand and buying power must be generated.
Technical Analysis
By Shayan
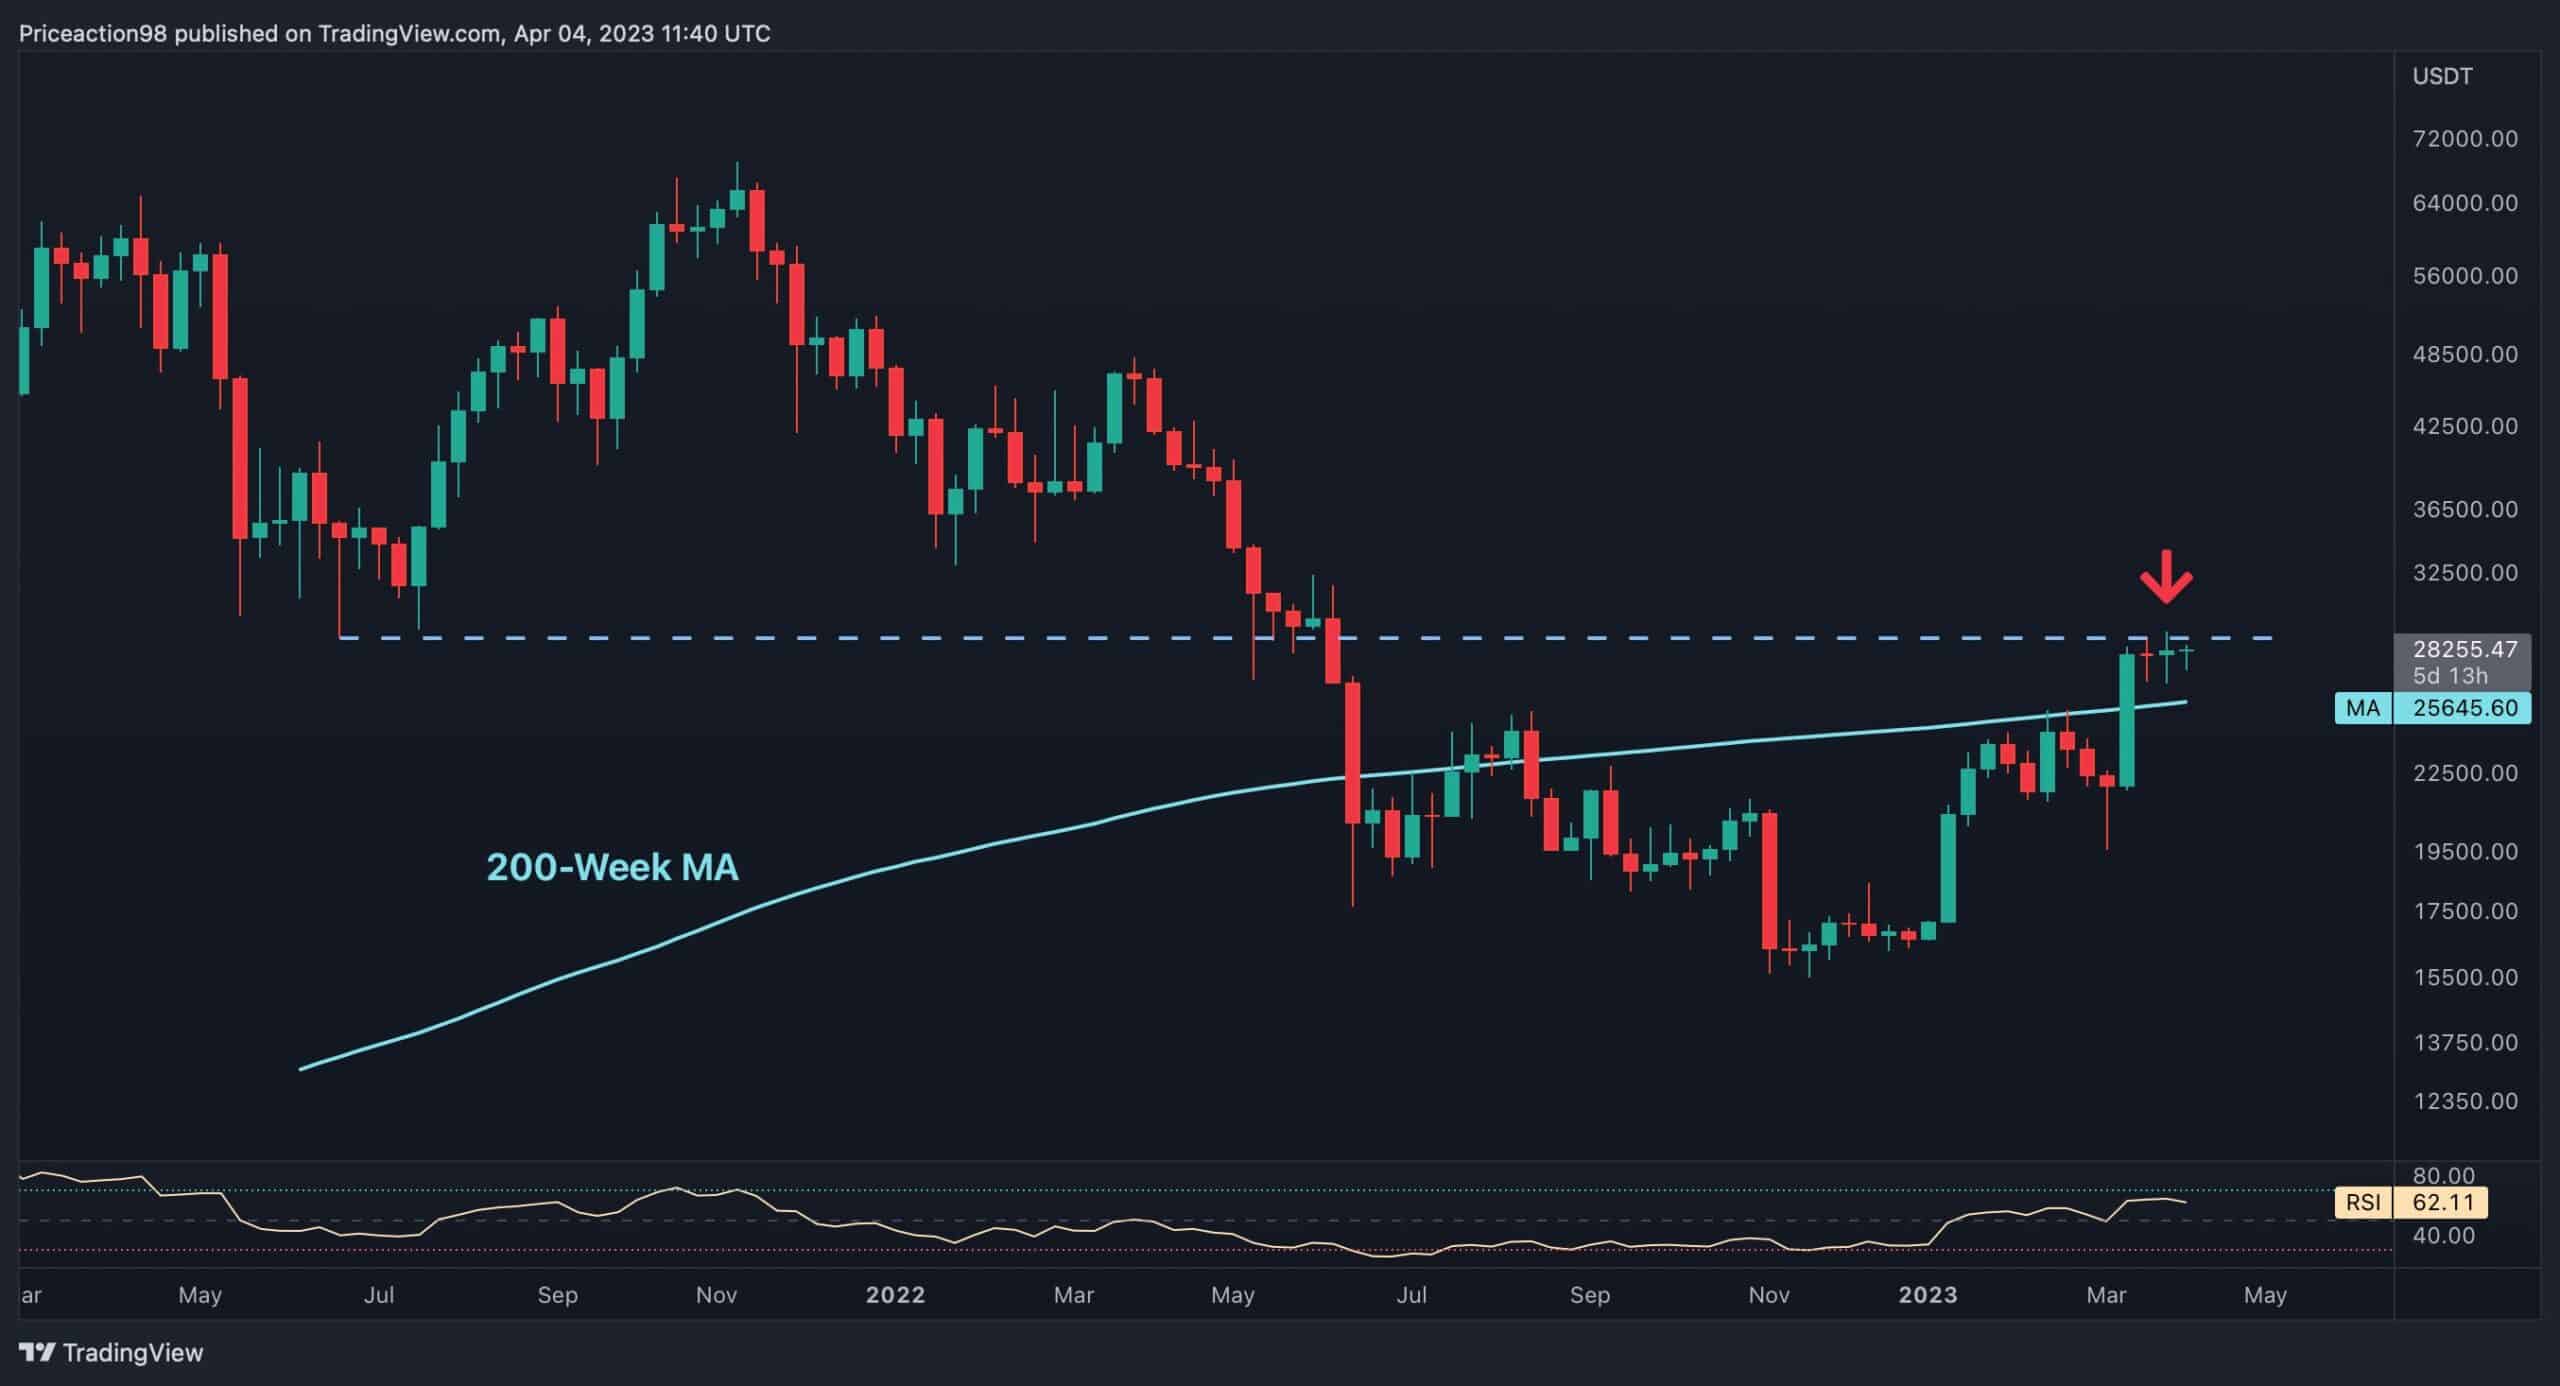
The Weekly Chart
Bitcoin’s price has recently reached a critical price zone of $30,000. The chart shows that this range is a significant resistance level, as it aligns with the major swing low that Bitcoin formed back in May 2021 after the massive crash caused by China FUD.
The price action confirms this idea, as the impulsive bullish trend came to a halt as soon as Bitcoin reached this crucial resistance region. Nonetheless, the cryptocurrency has recently surpassed the 200-week moving average, which is an important sentimental level, providing a generally bullish outlook.
If Bitcoin bulls manage to push the price above this decisive region, it will likely initiate a long-term positive trend toward new all-time highs. Therefore, it is crucial to monitor the price action in the upcoming weeks.
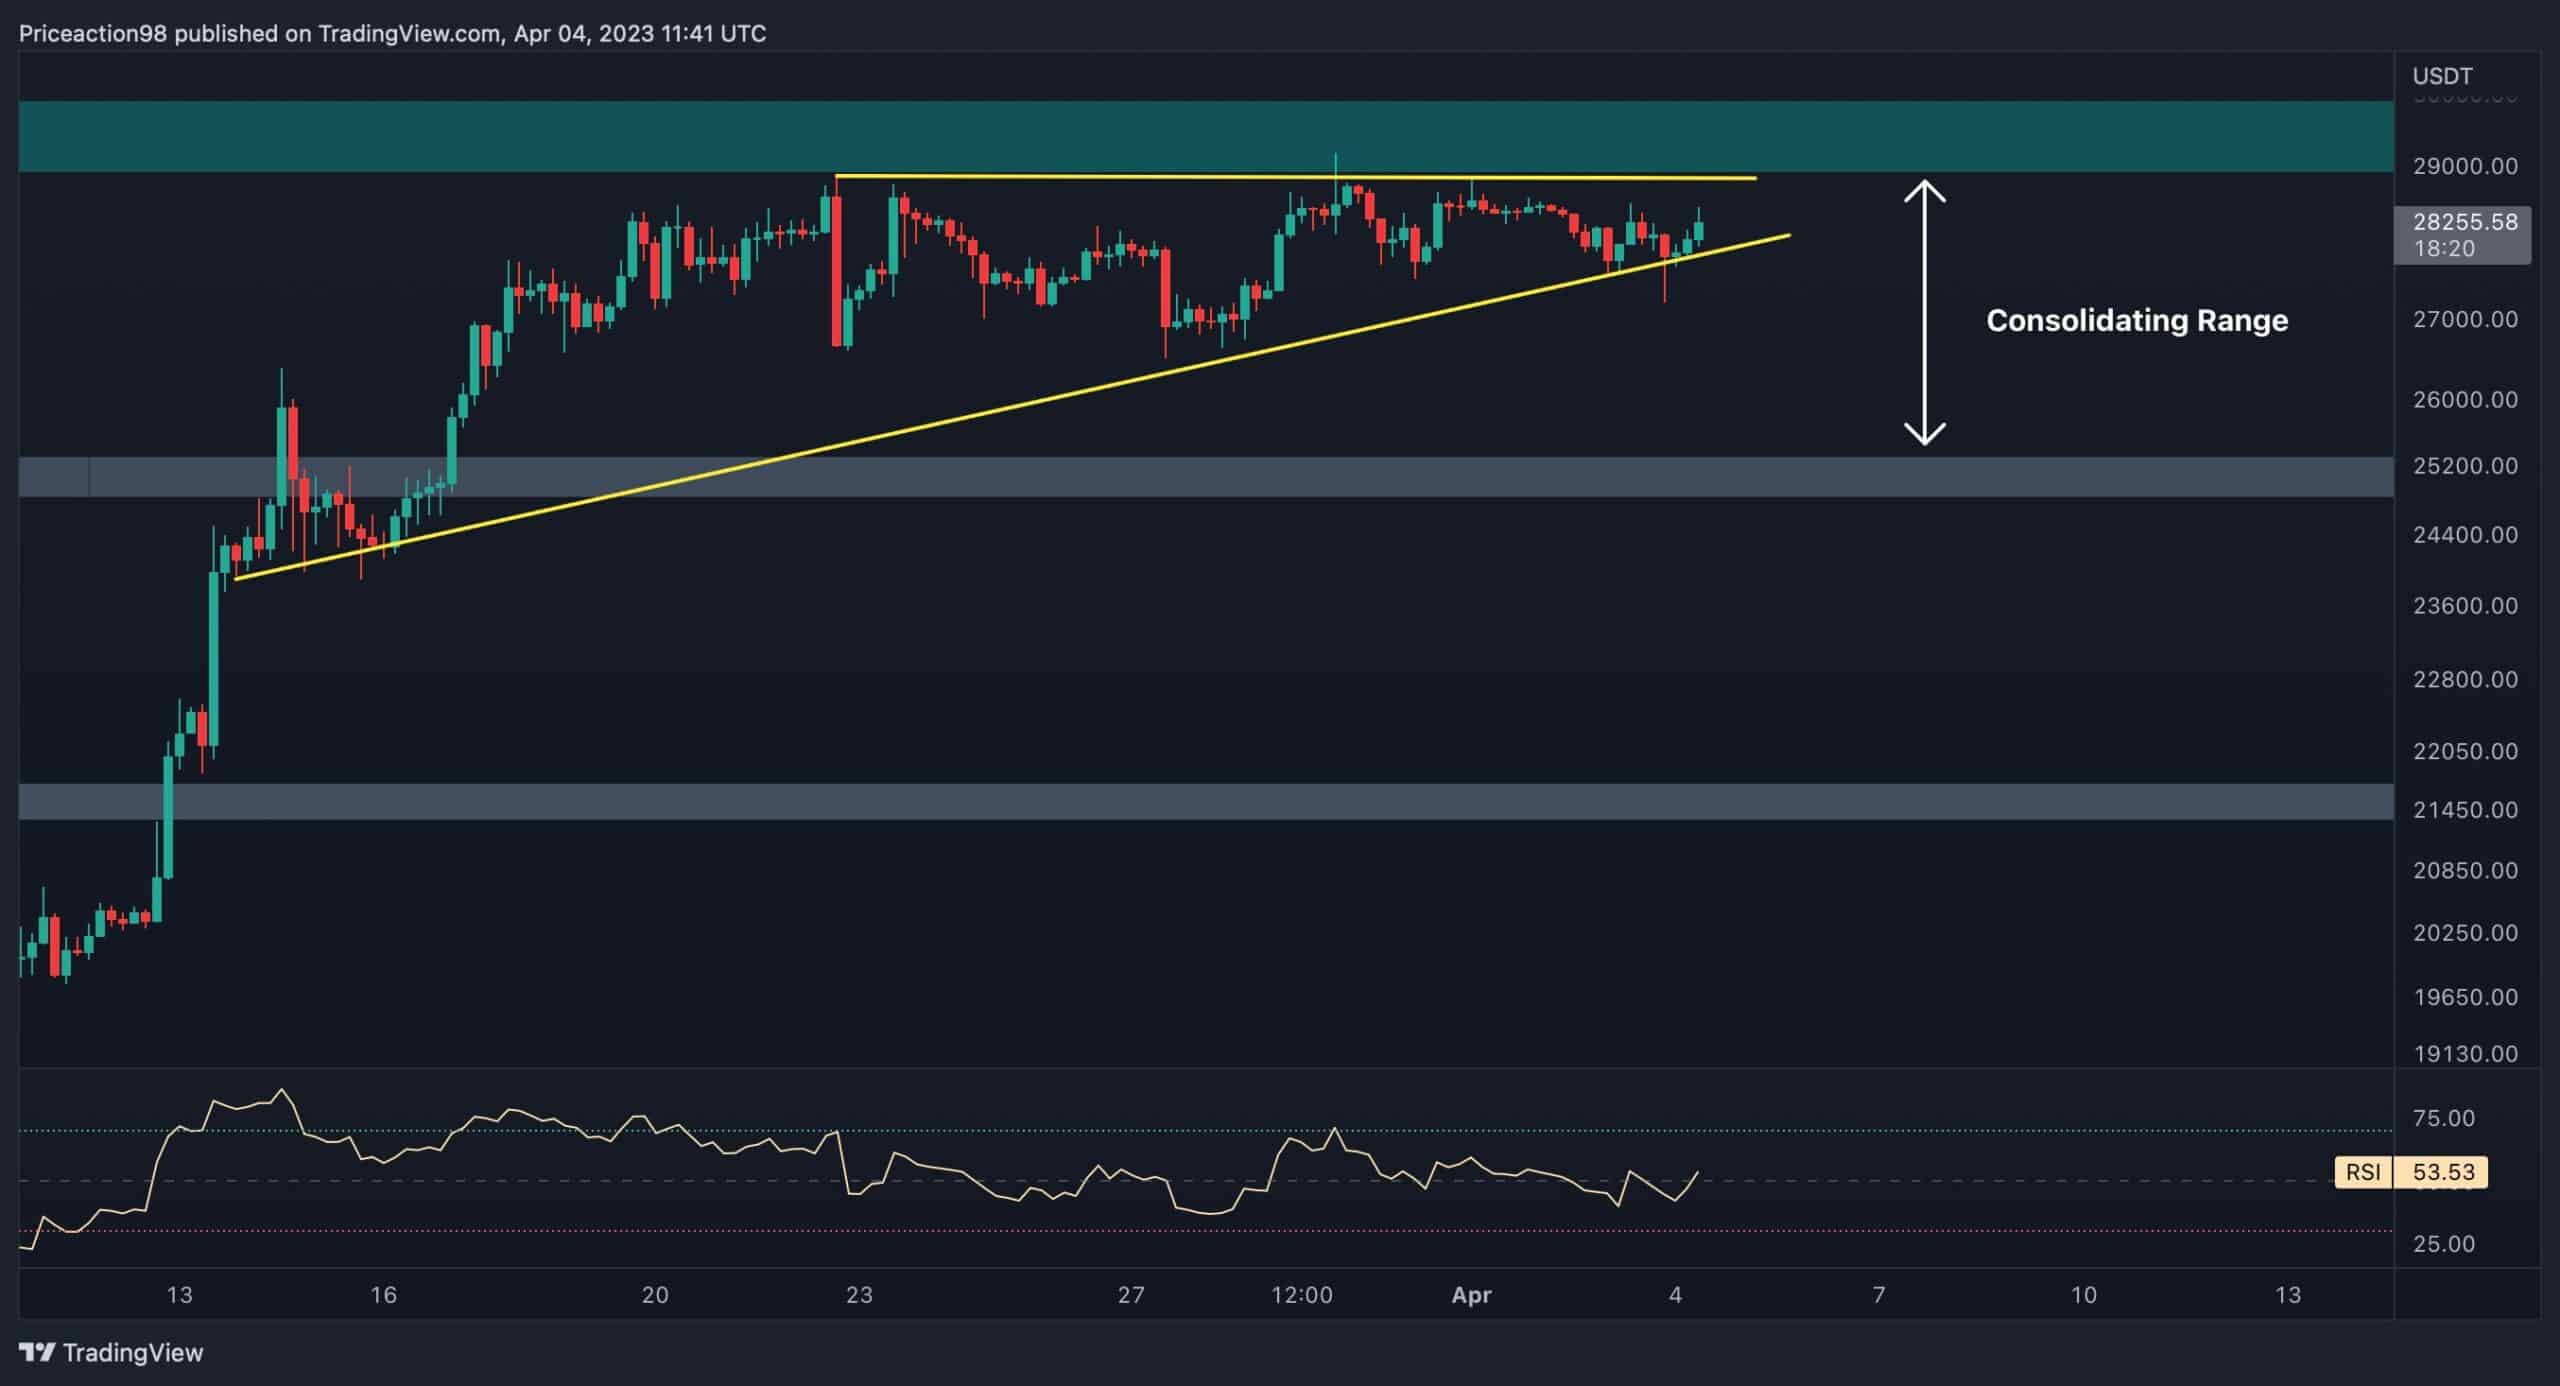
The 4-Hour Chart
In the 4-hour timeframe, Bitcoin’s price has formed an ascending triangle pattern and is approaching the narrow range. This indicates that BTC is likely to break out of the triangle in the next few days, and the direction of the price movement will provide a short-term bias for the cryptocurrency.
However, uncertainty will persist until the price exits the static consolidation range between the $25,000 support and $30,000 resistance levels.
In summary, based on recent price action, a short-term rejection followed by a consolidation correction stage is looking probable in the coming days. It is essential to monitor the situation closely during this time.
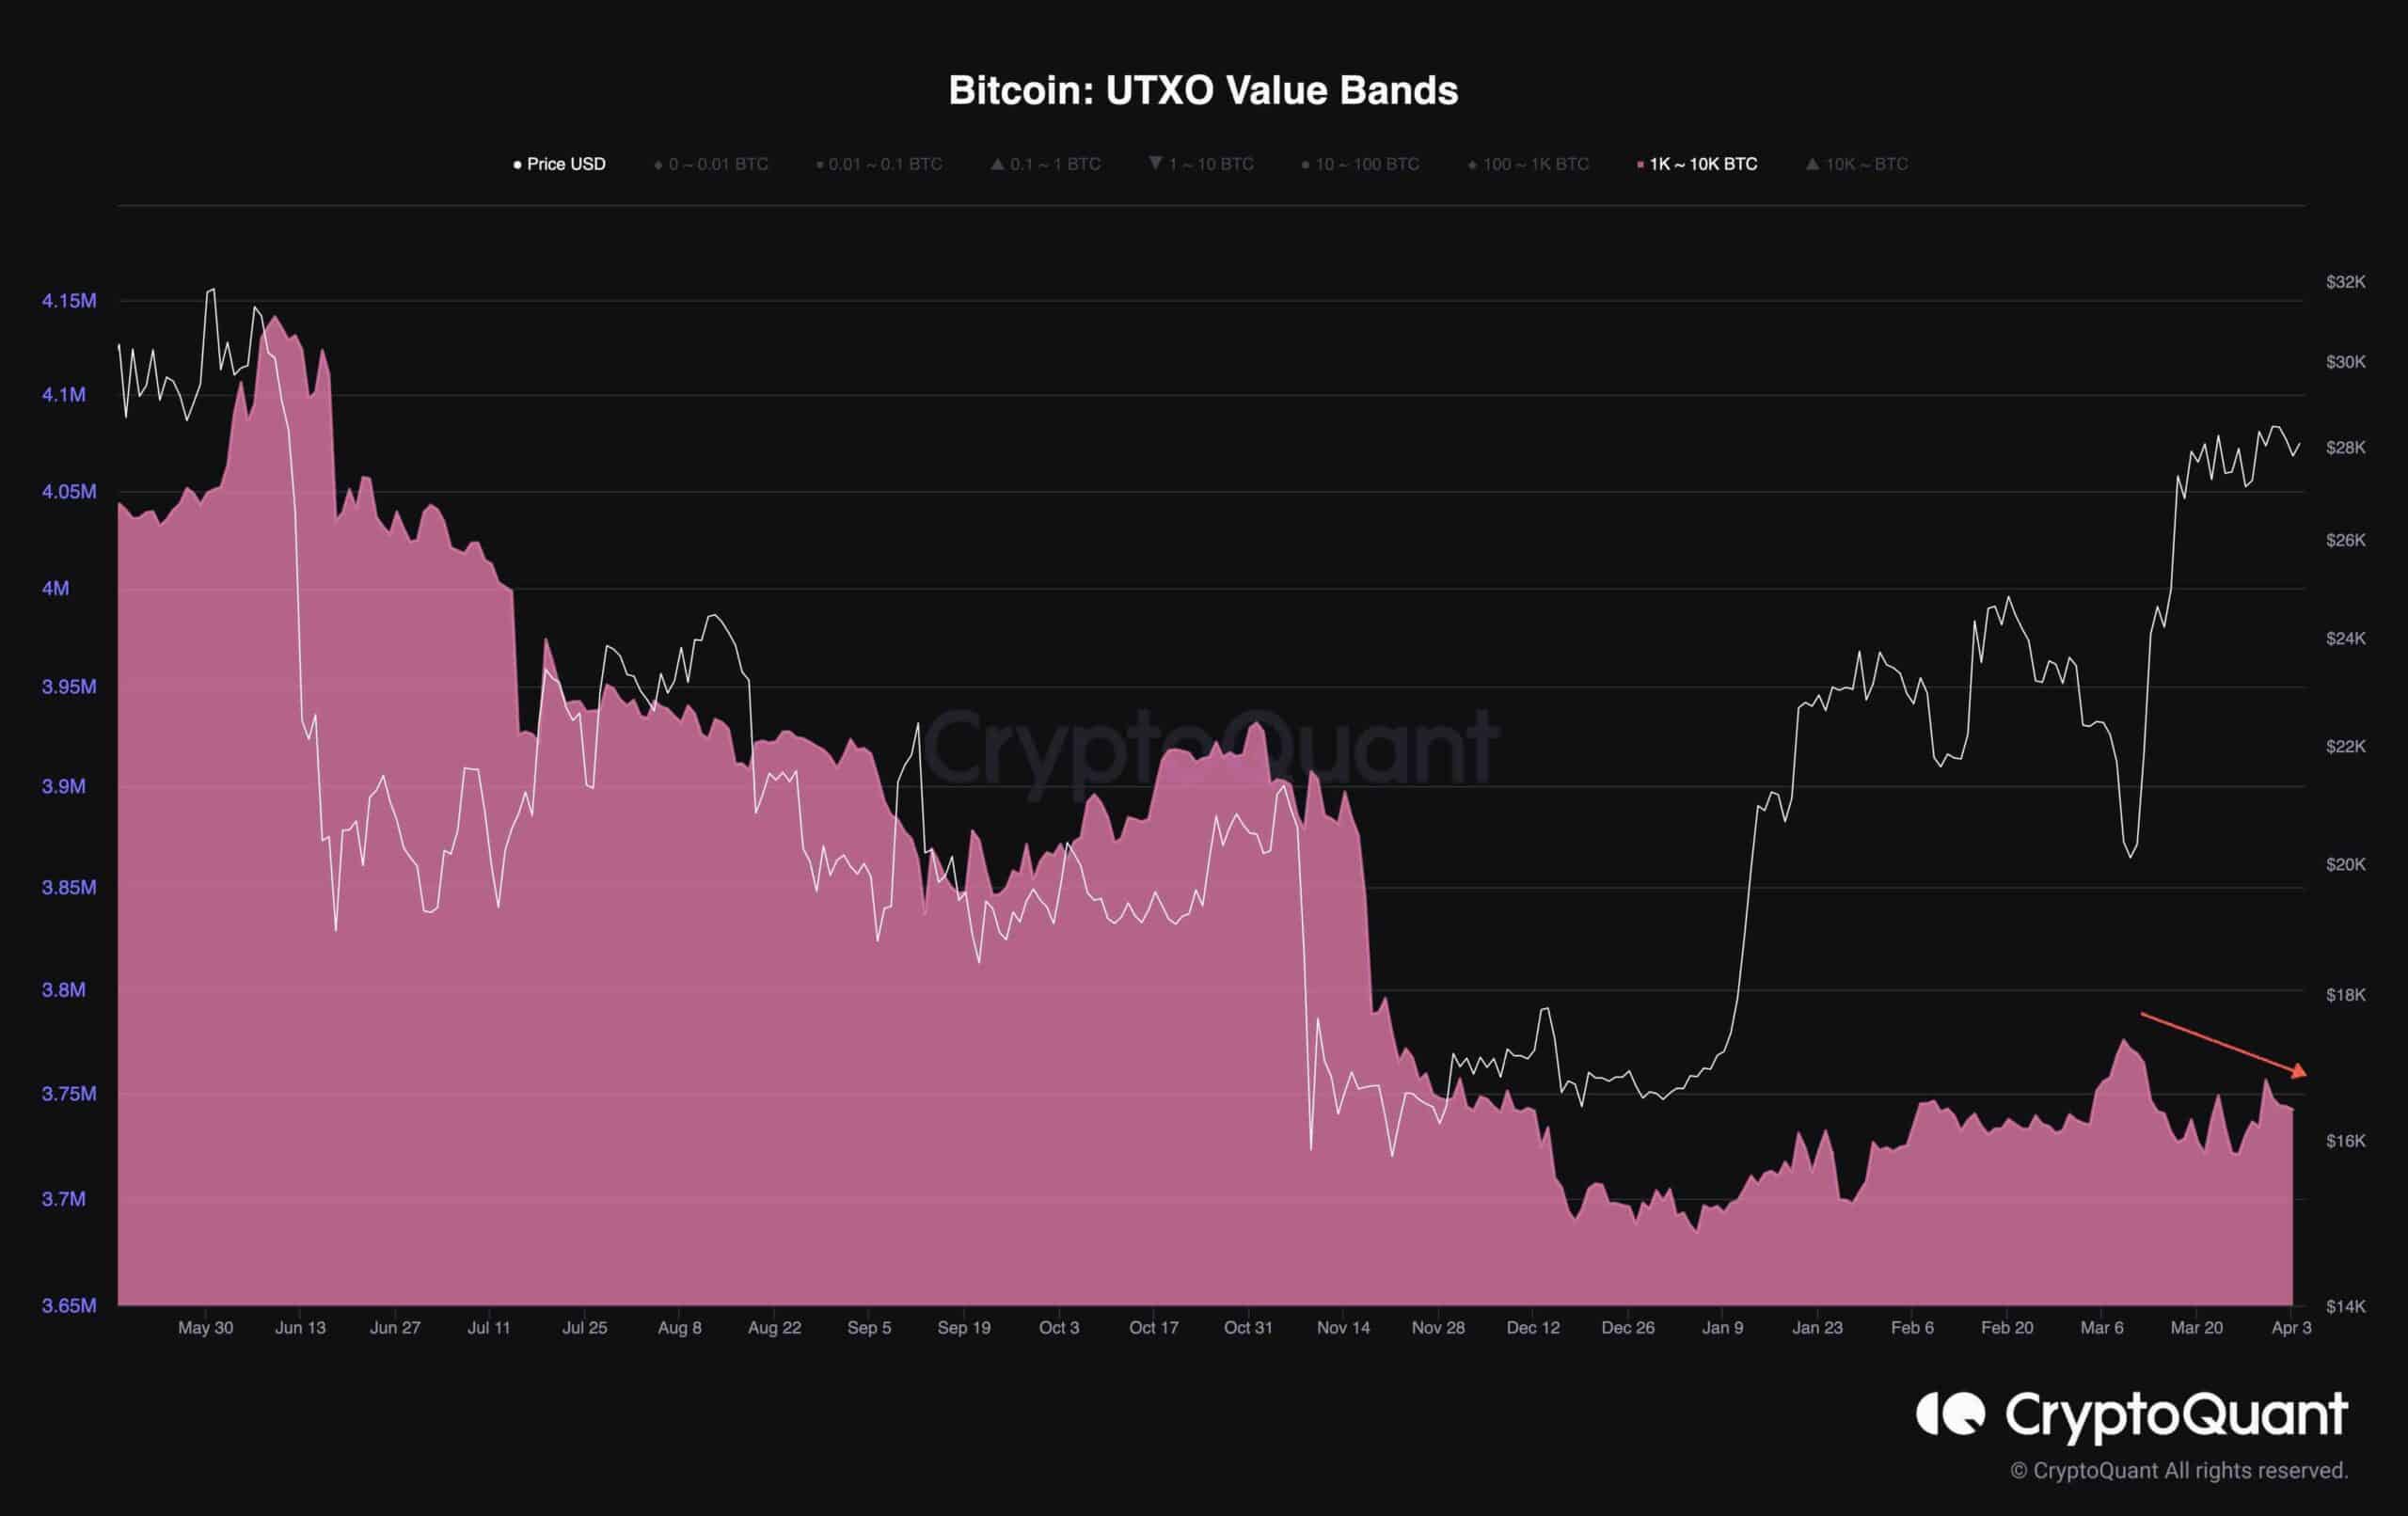
On-chain Analysis
By Shayan
Bitcoin’s impulsive upward trend has halted, as the price started consolidating with no apparent direction.
There are two main reasons for this. The first is that short-term holders, or investors who have recently purchased BTC, have chosen to sell their holdings to cash out their profits or exit the position based on their average cost basis.
The second reason is that “whales,” or investors who own a significant amount of Bitcoin ranging from 1,000 to 10,000 BTC, have been spending more than average, especially when the price was around $28,000.
This increased selling pressure has resulted in a divergence between Bitcoin’s increasing price and whales’ declining holdings, which have fallen to their lowest since early February.