Bitcoin’s price has experienced a significant surge in recent months, surpassing several resistance levels. However, the current trend seems to be losing momentum, with the cryptocurrency experiencing difficulty in claiming the crucial resistance zone of K. Technical Analysis By Shayan The Daily Chart The price has broken out of its narrow consolidation range near K and is now aggressively attempting to breach the crucial resistance level at K. This level holds both psychological and technical resistance and is likely to determine the crypto market’s short-term future. Should Bitcoin succeed in surpassing it, this may trigger a bullish trend toward the next significant resistance zone of around K. However, if it fails to break through, a drop toward the 50-day
Topics:
CryptoVizArt considers the following as important: Bitcoin (BTC) Price, BTC Analysis, BTCEUR, BTCGBP, btcusd, btcusdt
This could be interesting, too:
Mandy Williams writes Bitcoin ETFs Record Over .6B in Outflows in the Past 2 Weeks
Chayanika Deka writes Bitcoin Whales Offload 6,813 BTC as Selling Pressure Mounts
Wayne Jones writes Bitcoin Sentiment Hits 2022 Lows as Fear & Greed Index Falls to 10
Jordan Lyanchev writes Bitcoin Falls Below K for the First Time in 3 Months, How Much Lower Can It Go?
Bitcoin’s price has experienced a significant surge in recent months, surpassing several resistance levels. However, the current trend seems to be losing momentum, with the cryptocurrency experiencing difficulty in claiming the crucial resistance zone of $30K.
Technical Analysis
By Shayan
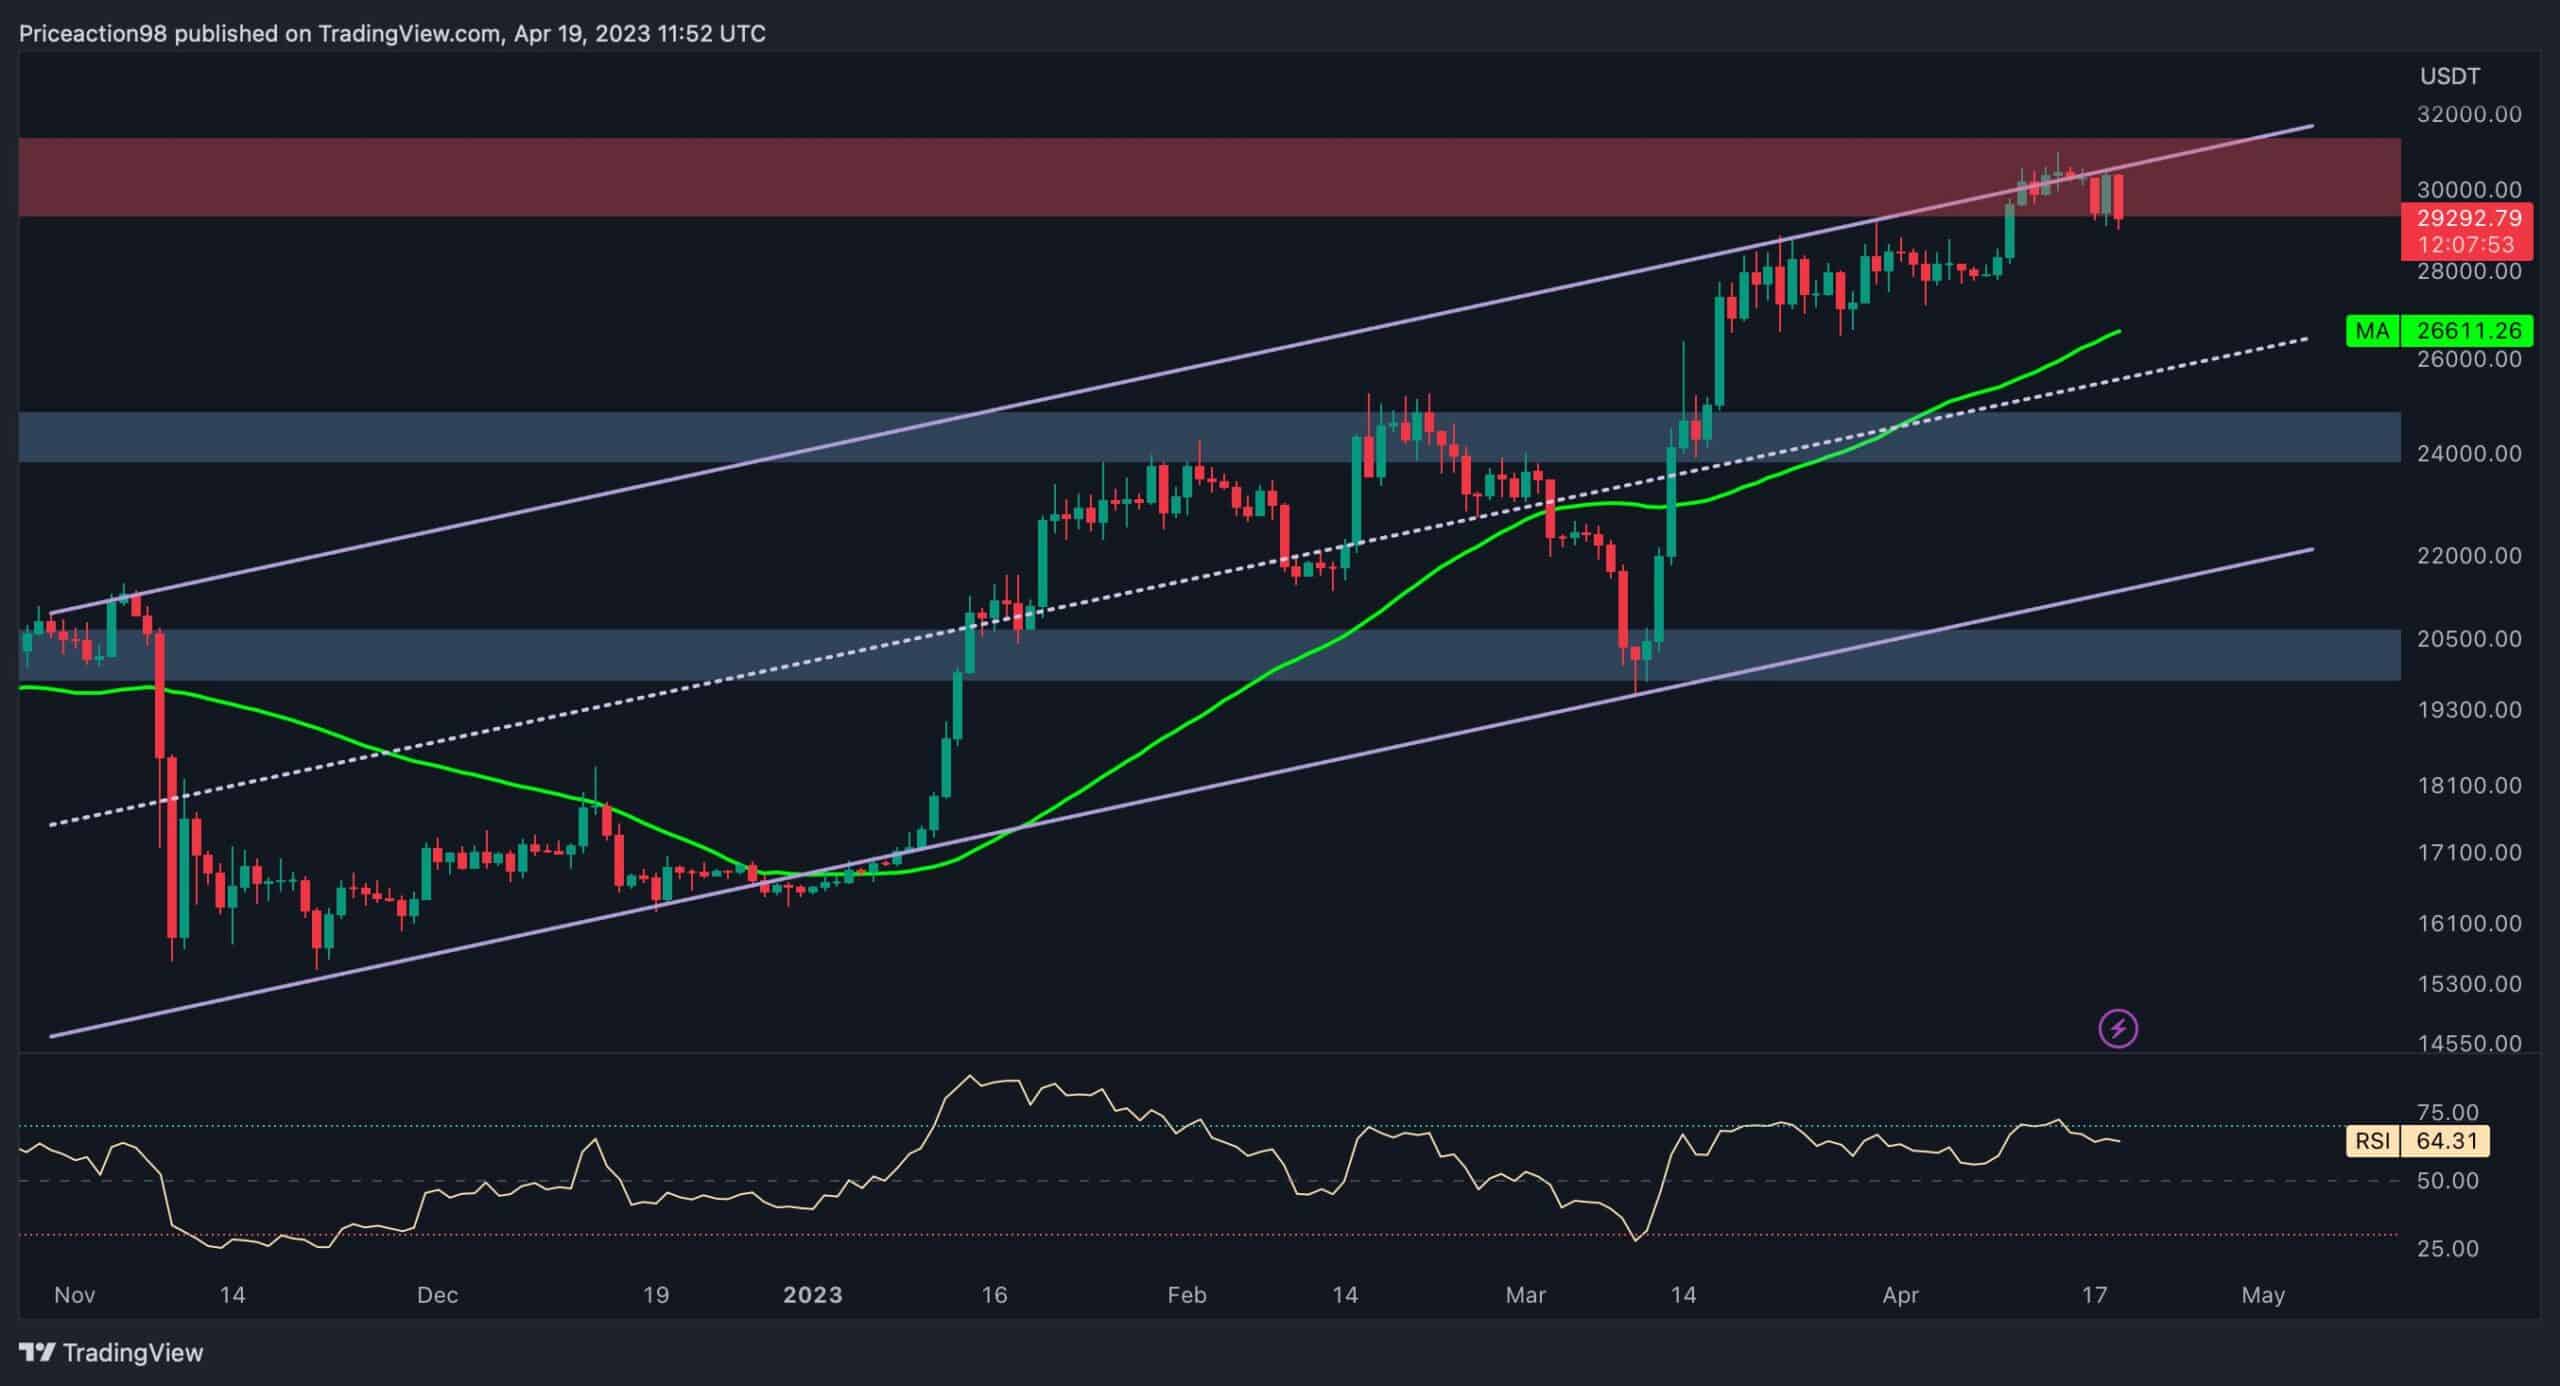
The Daily Chart
The price has broken out of its narrow consolidation range near $28K and is now aggressively attempting to breach the crucial resistance level at $30K. This level holds both psychological and technical resistance and is likely to determine the crypto market’s short-term future.
Should Bitcoin succeed in surpassing it, this may trigger a bullish trend toward the next significant resistance zone of around $38K. However, if it fails to break through, a drop toward the 50-day moving average at $26K or the mid-trendline of the channel at approximately $25K may occur.
Regardless of the outcome, the bulls can remain hopeful as long as the price stays above the 200-day moving average, a crucial indicator for identifying the market’s overall bias.
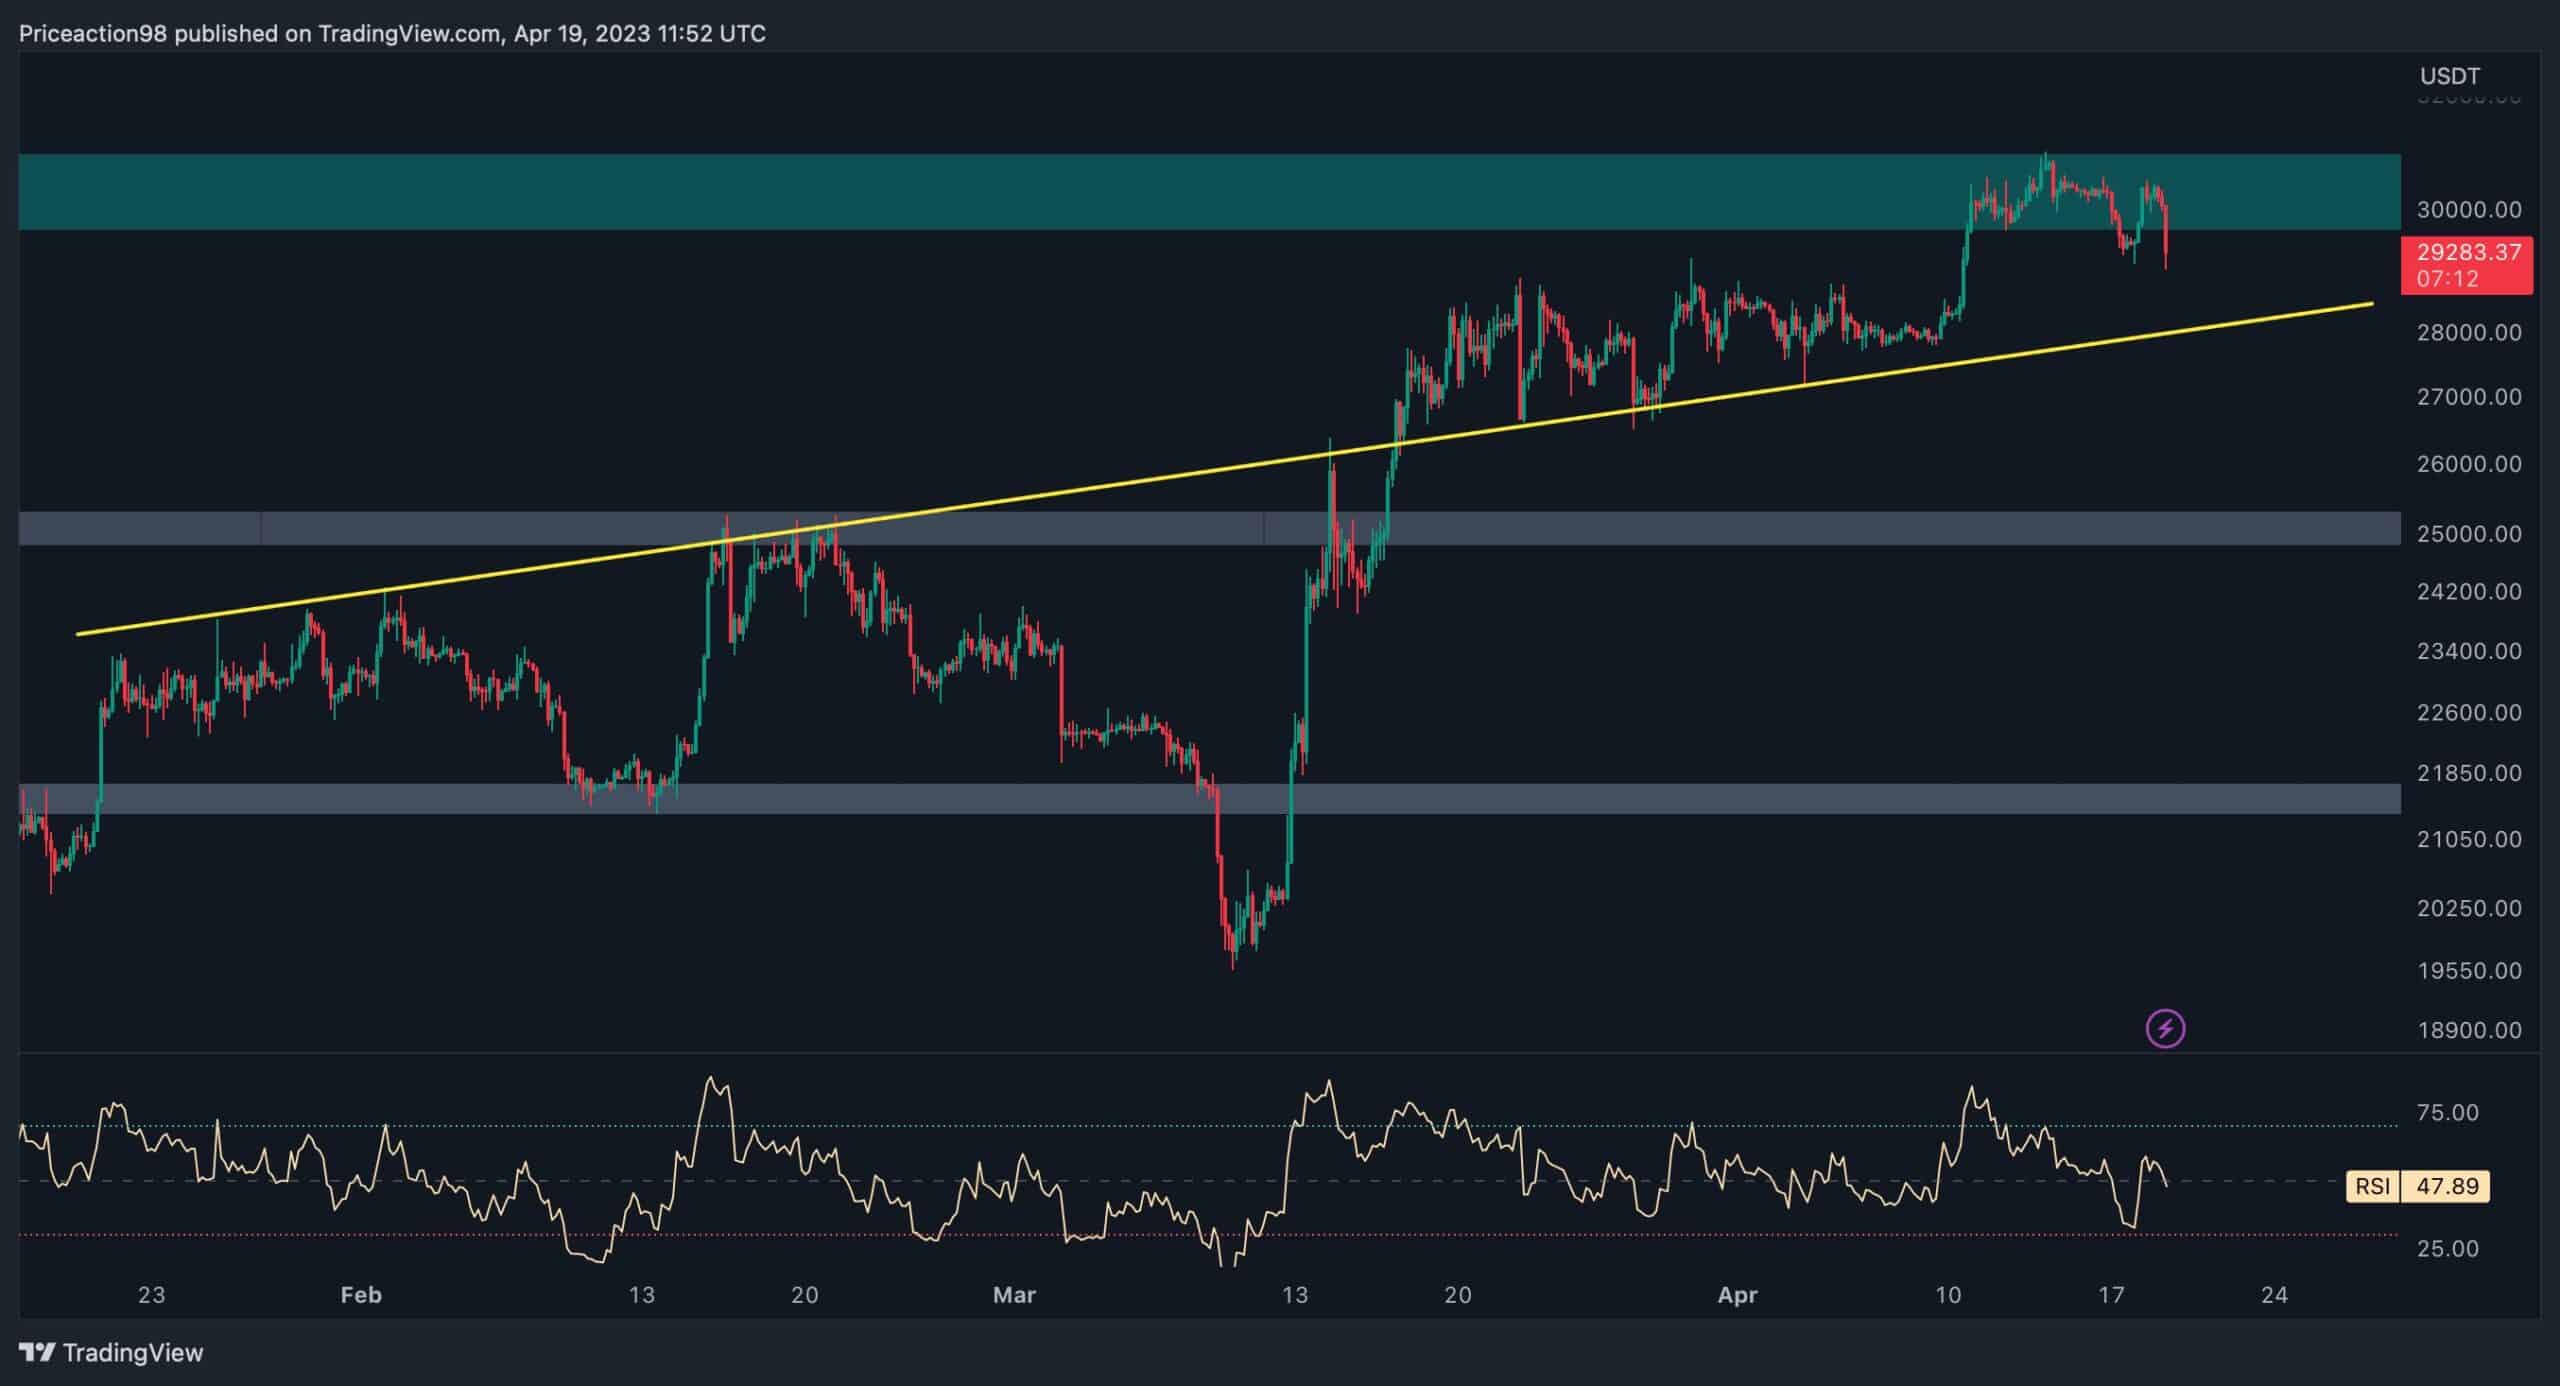
The 4-Hour Chart
When examining the 4-hour timeframe, it becomes evident that the price of Bitcoin has recently formed a head-and-shoulders pattern, indicating an increased probability of an upcoming short-term reversal. However, it’s important to note that if the pattern results in a rejection, the multi-month ascending trendline will assume a more critical role as a primary support region.
Despite the development of this pattern, Bitcoin’s price currently finds itself in a state of limbo, confined within the dynamic range that exists between the ascending trendline and the critical $30K resistance area.
Consequently, its direction in the mid-term remains uncertain and dependent on a breakout beyond this range.
On-chain Analysis
By Shayan
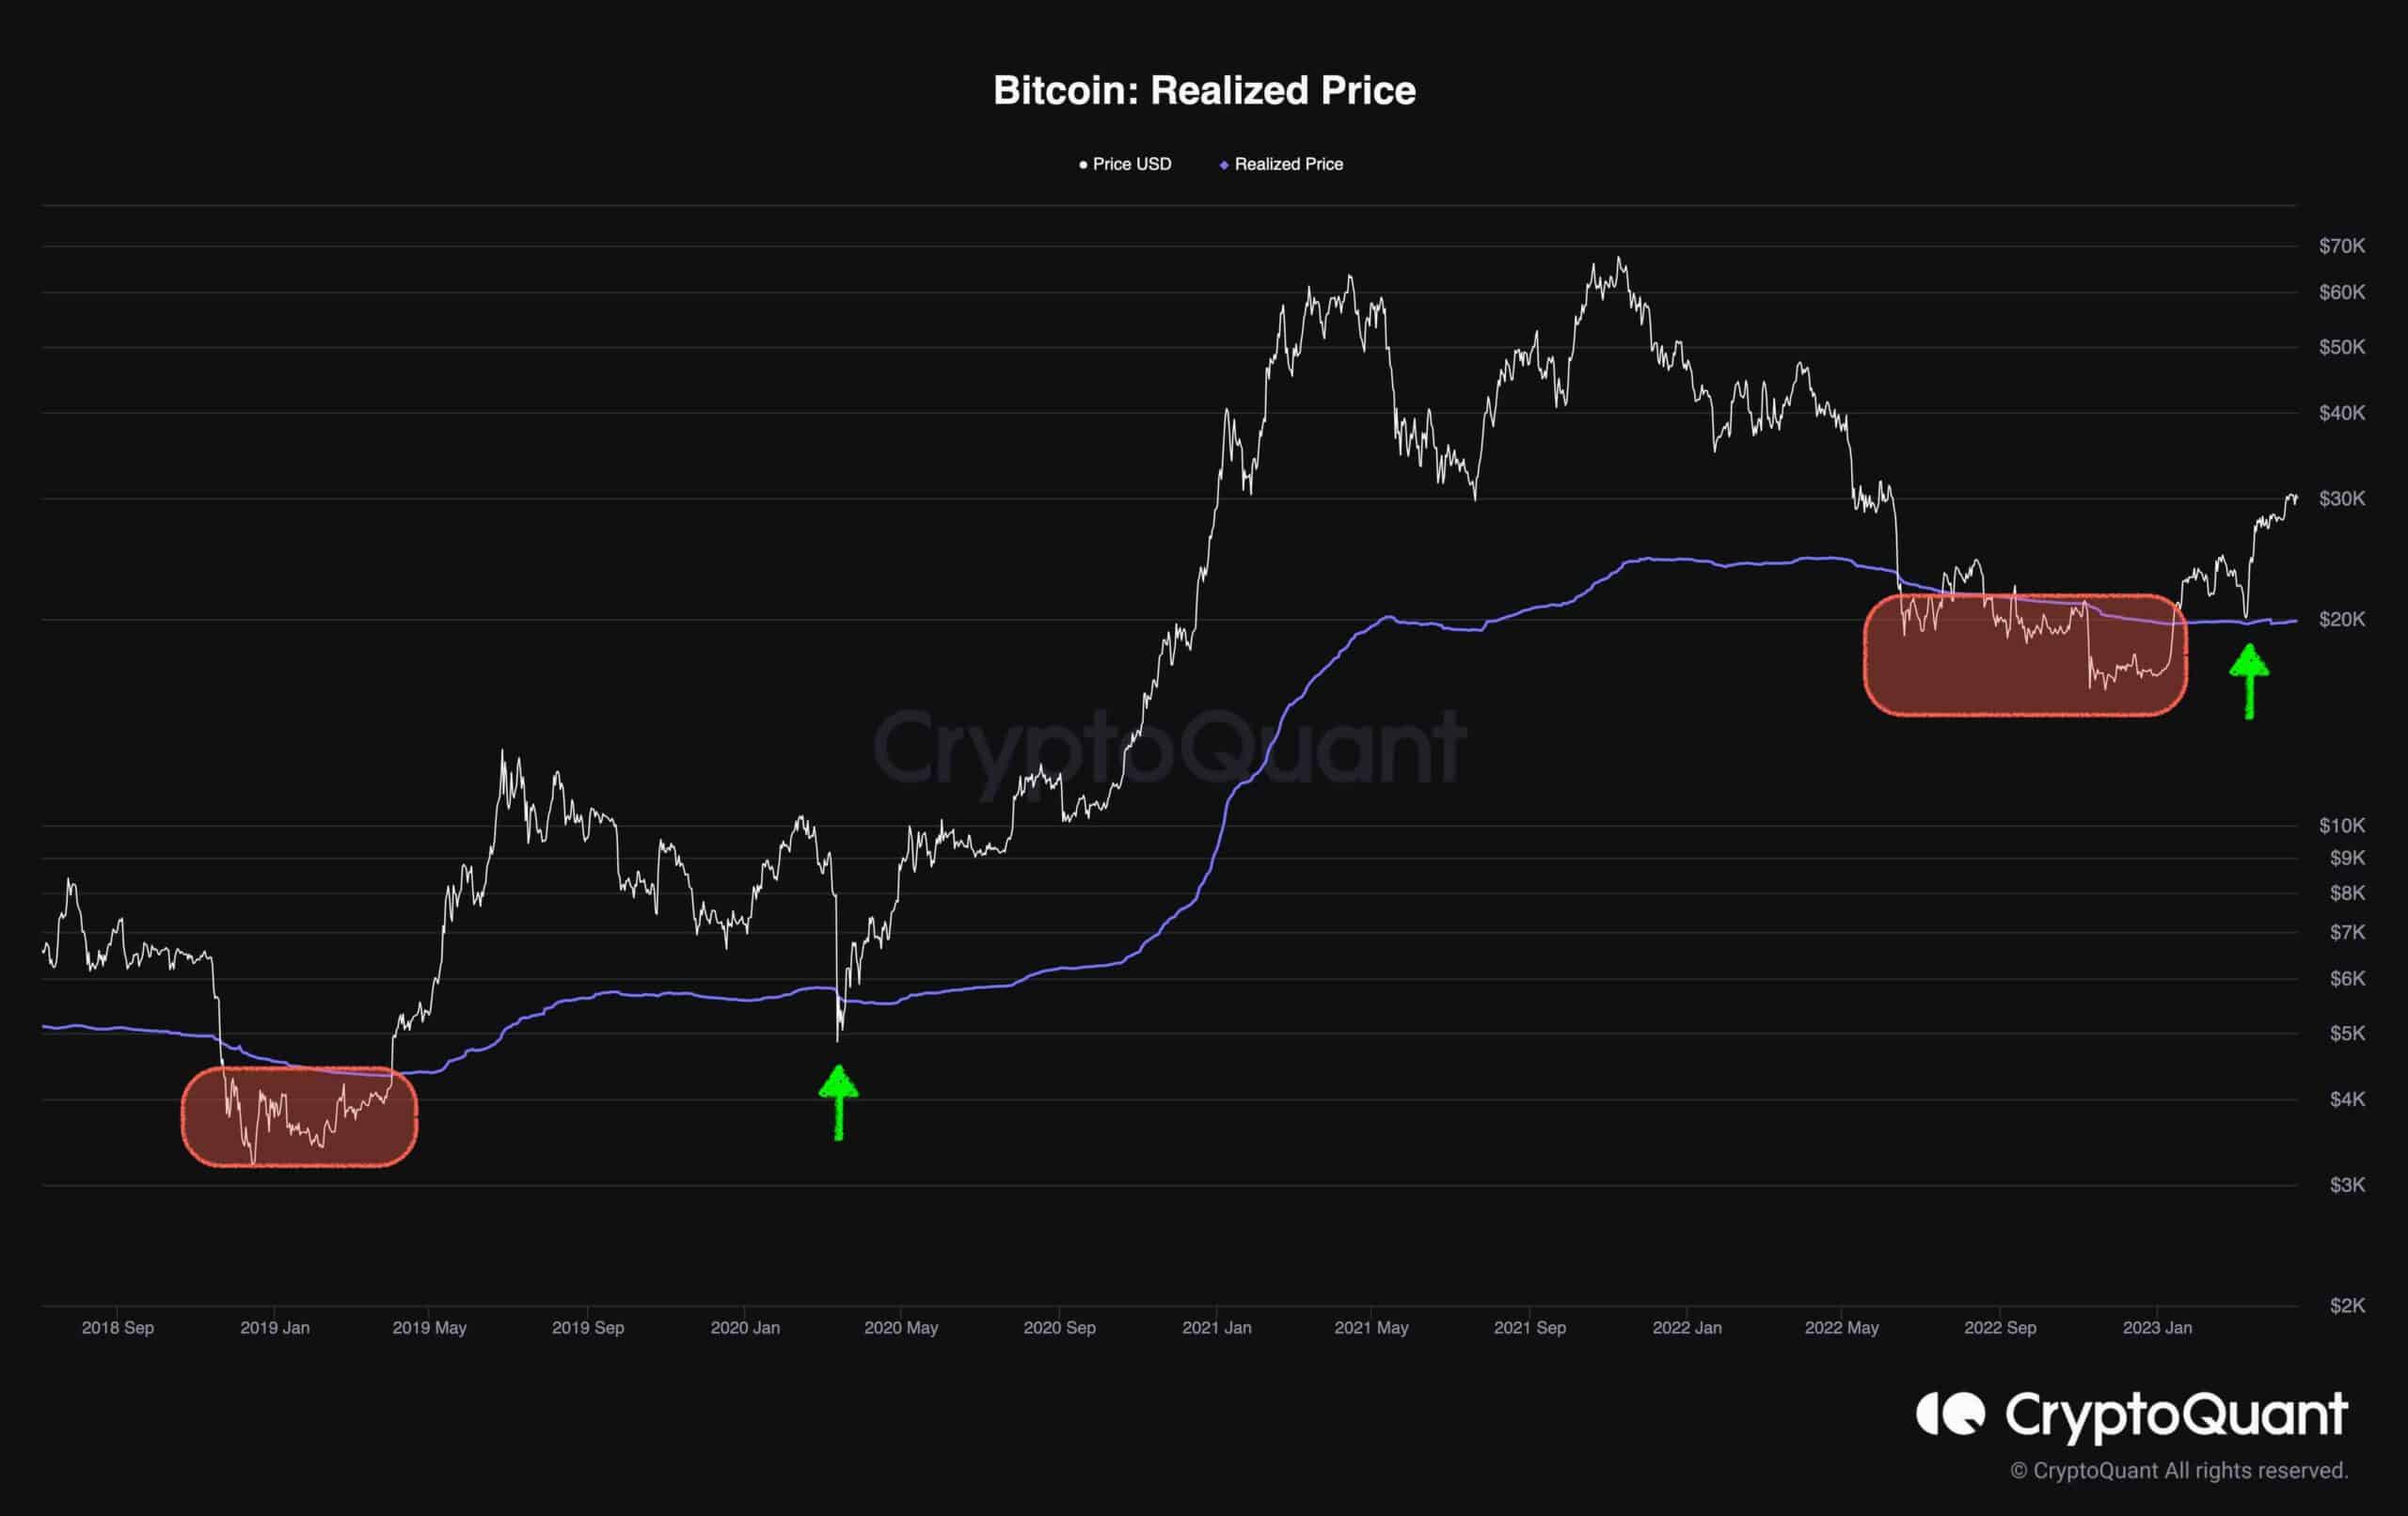
The Realized Price metric is a crucial tool in determining whether Bitcoin is over or undervalued. During bullish market cycles, it typically remains above the realized price, while during bear markets, it drops below, causing fear and uncertainty.
Bitcoin’s recent movements resemble the 2018 bear market. During the final capitulation phase, the price dropped significantly below the realized price, causing panic. However, the 2019 bull run saw it reclaim the realized price level at around $4K and form a pullback to retest it.
Recently, BTC dropped below the realized price but then started a strong uptrend, surpassing the realized price at $20K. After a brief surge, it corrected and retested the level, indicating a healthy bullish trend. However, Bitcoin’s bullish outlook remains unchanged unless it drops below the realized price level.