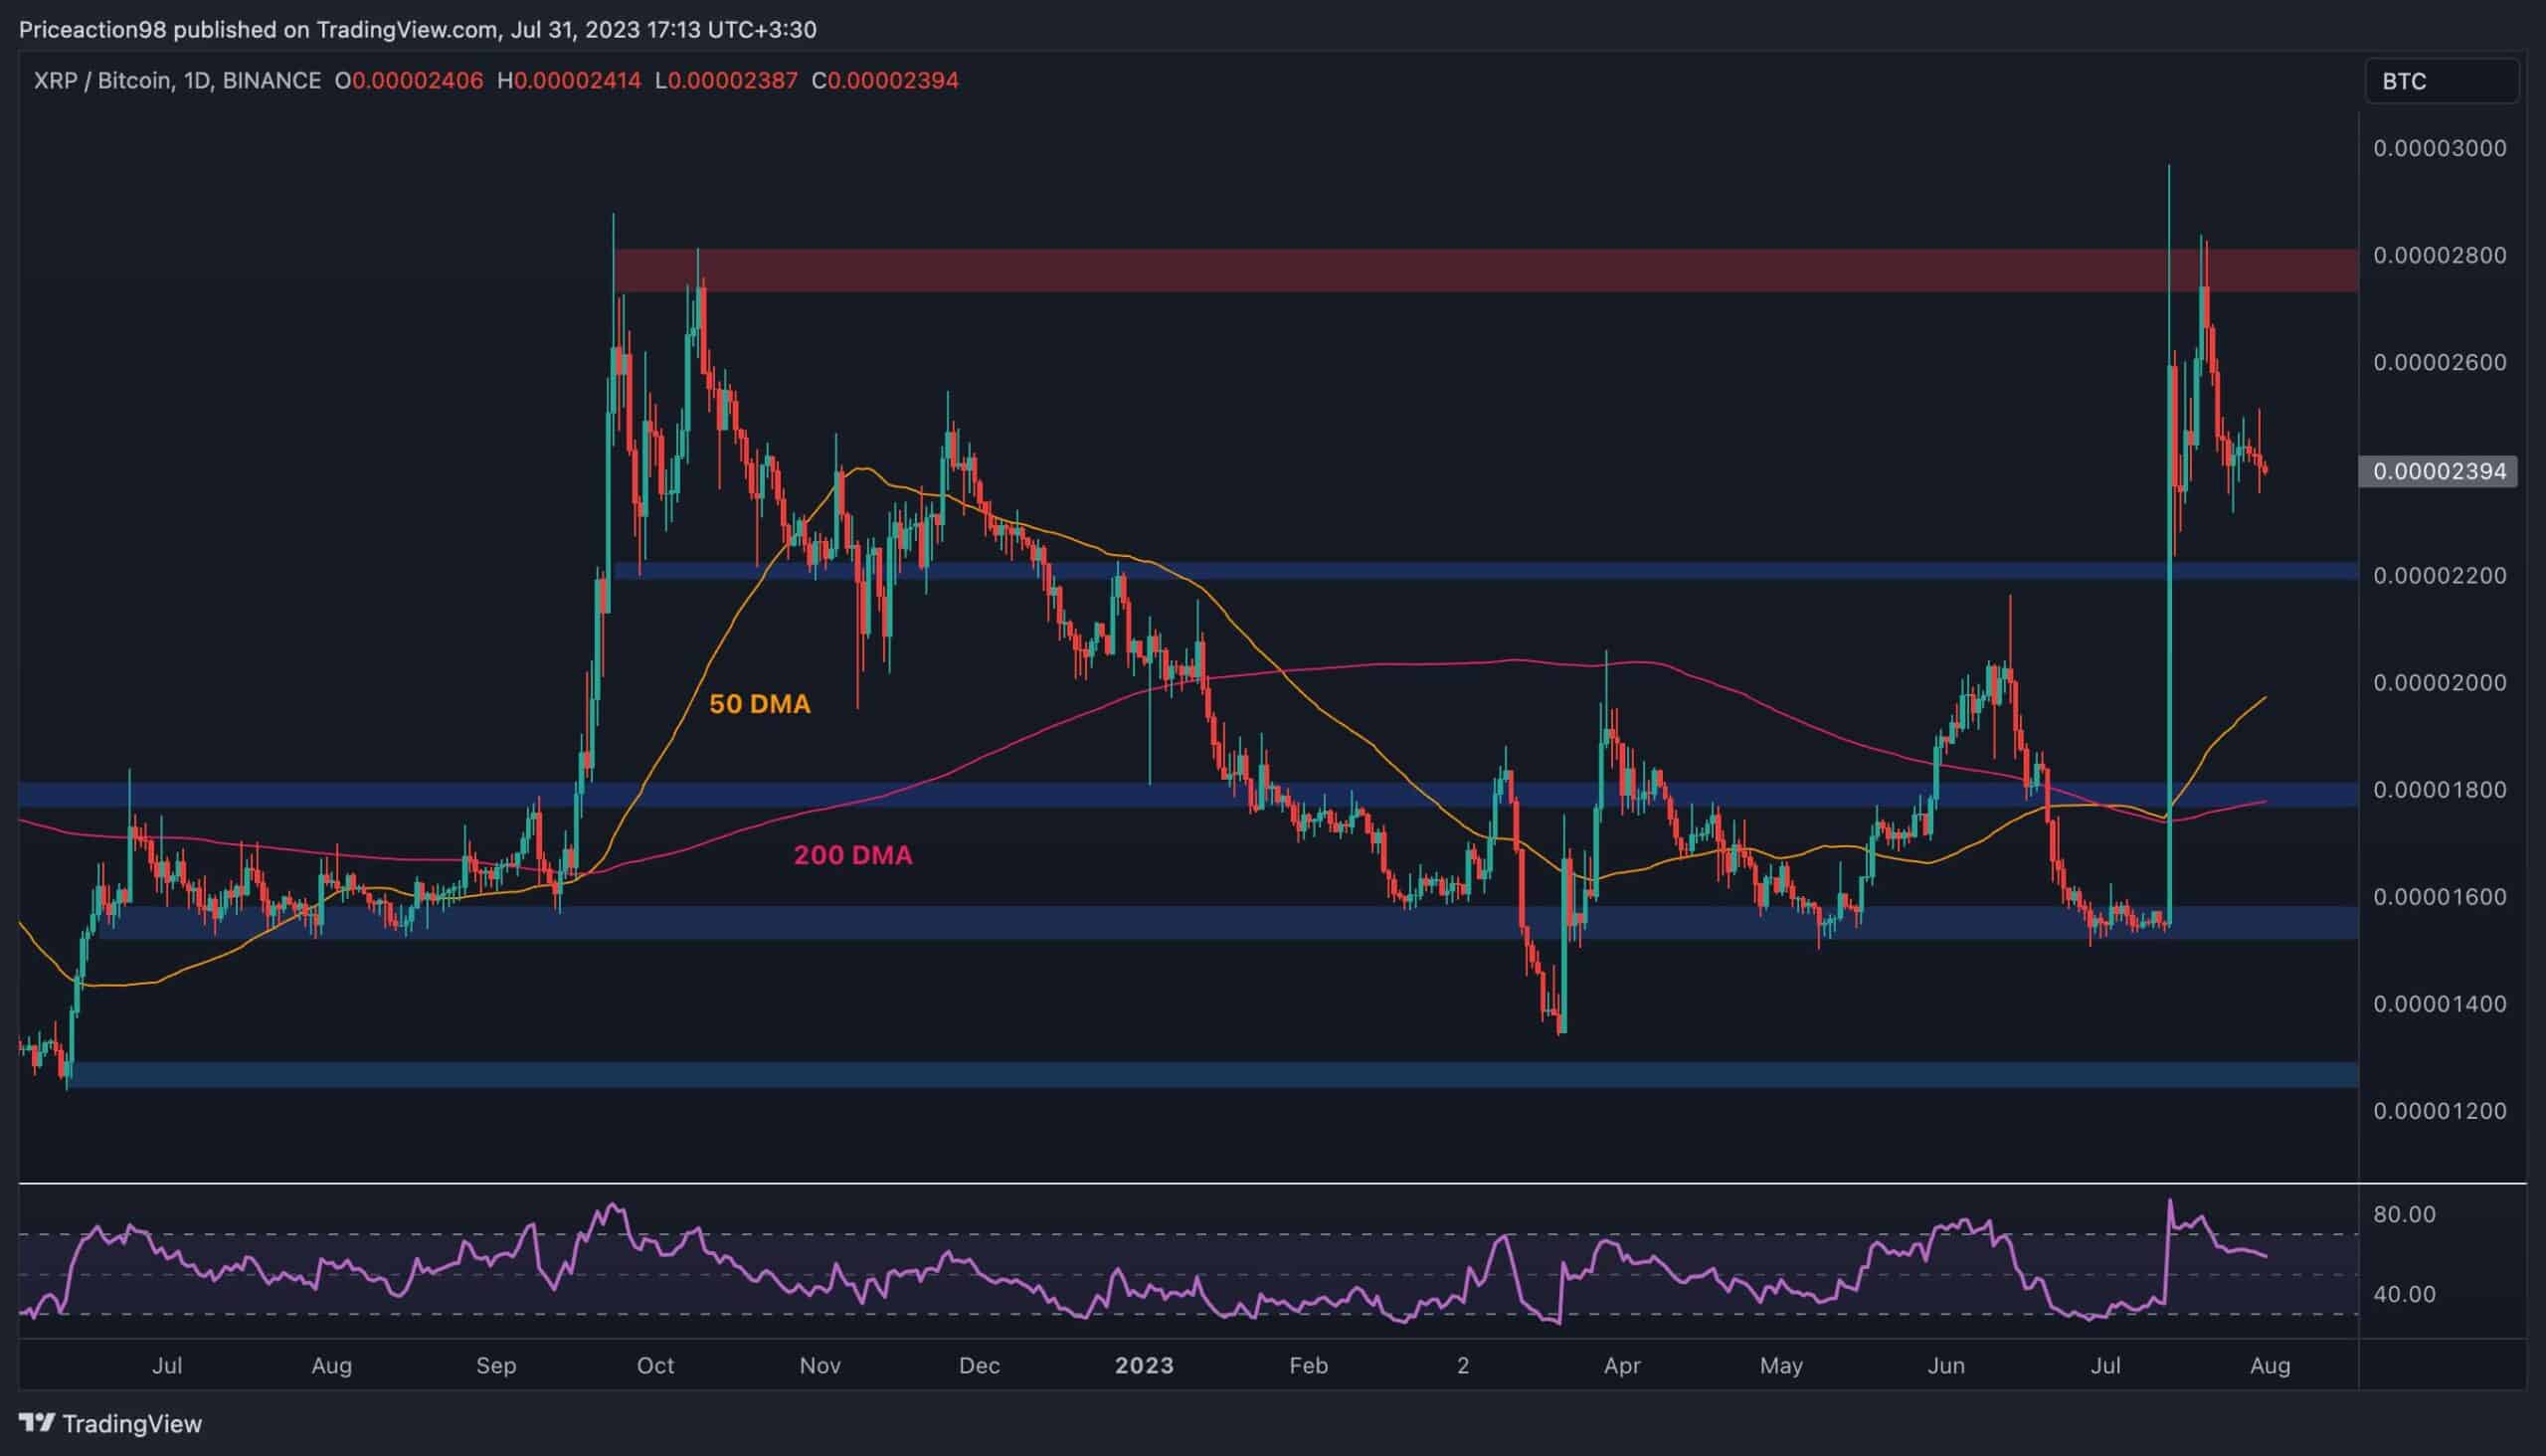
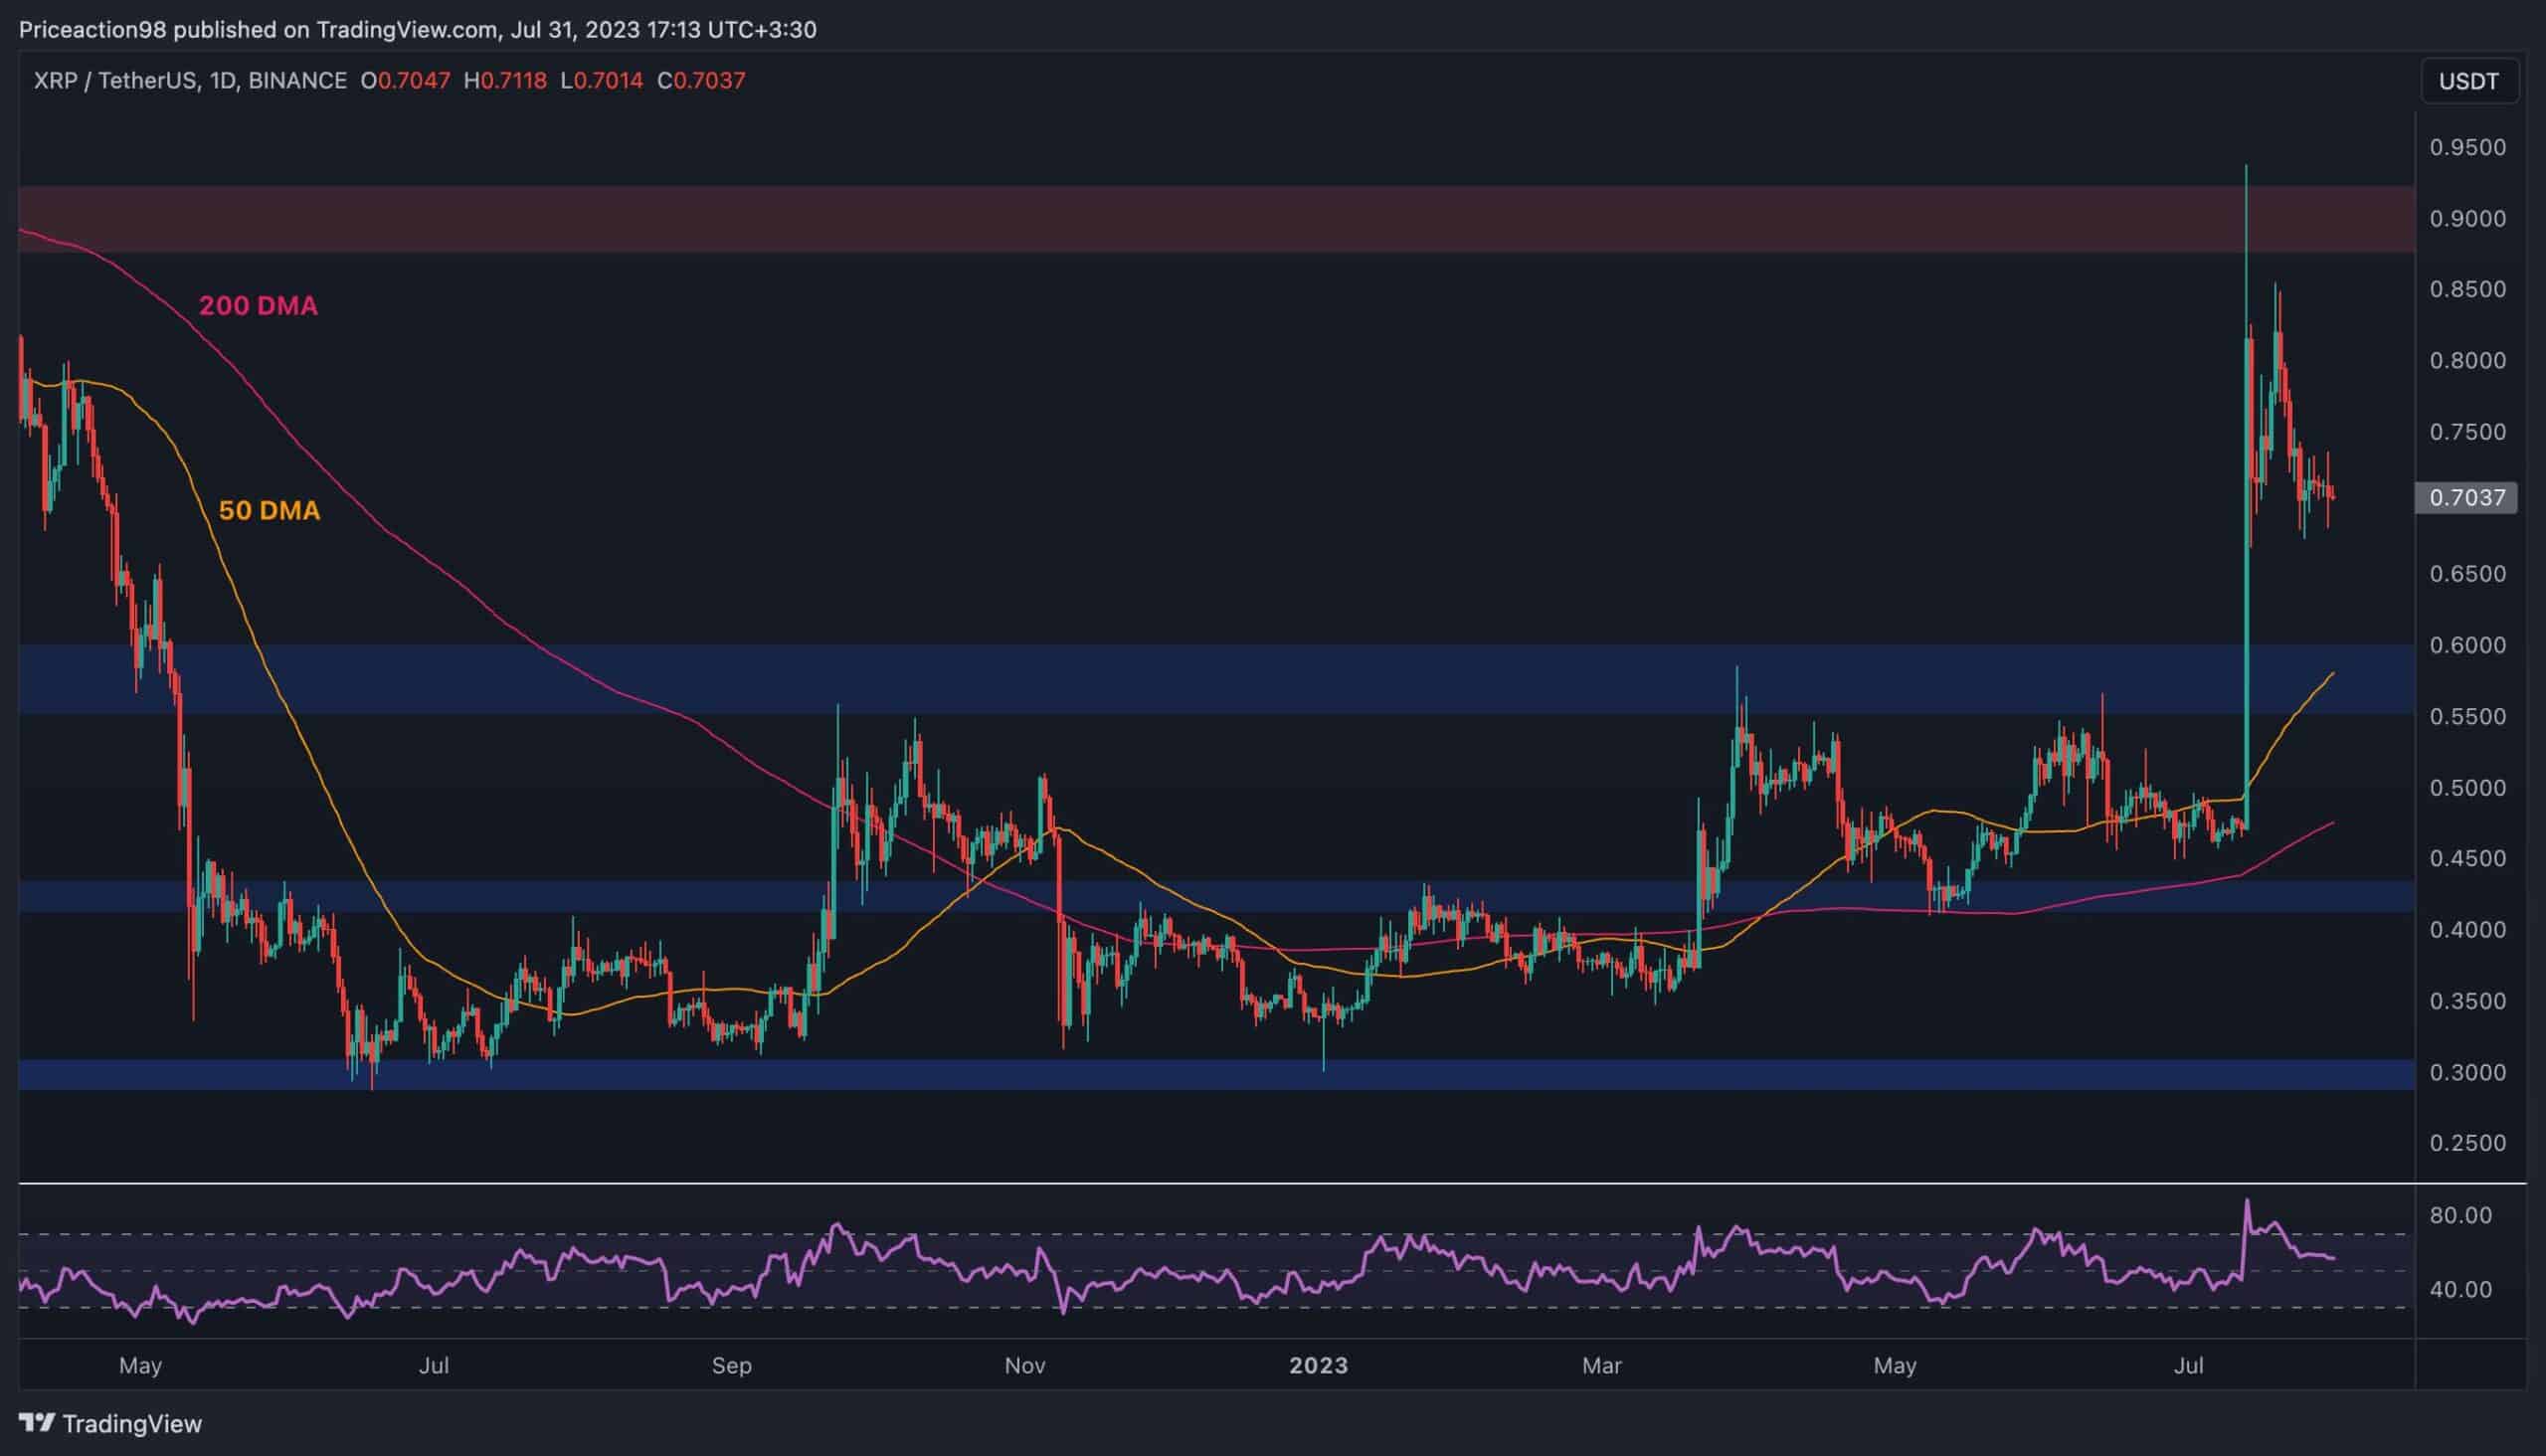
Ripple’s price is currently in a correction phase after a significant spike a few weeks ago. Nonetheless, there are several support levels against both USDT and BTC. Technical Analysis By: Edris XRP/USDT Daily Chart: On the daily timeframe of the USDT paired chart, the price has recently been rejected from the %excerpt%.9 level and is currently declining. The %excerpt%.6 support level and the 50-day moving average located around the same area are probable targets for a deep pullback. However, the price could rebound before reaching those levels. In that case, a breakout above the %excerpt%.9 resistance level could be expected. This could lead to a higher rally, and XRP could be trade in the coming months. Source: TradingViewXRP/BTC Daily Chart: Against Bitcoin, the situation is similar. The
Topics:
CryptoVizArt considers the following as important: Ripple (XRP) Price, XMRUSD, XRP Analysis, xrpbtc
This could be interesting, too:
Jordan Lyanchev writes Ripple’s (XRP) Surge to Triggers Over Million in Short Liquidations
Jordan Lyanchev writes Trump Confirms Work on Strategic Crypto Reserve: XRP, ADA, SOL Included
Dimitar Dzhondzhorov writes Is a Major Ripple v. SEC Lawsuit Development Expected This Week? Here’s Why
Mandy Williams writes Ripple Releases Institutional DeFi Roadmap for XRP Ledger in 2025
Ripple’s price is currently in a correction phase after a significant spike a few weeks ago. Nonetheless, there are several support levels against both USDT and BTC.
Technical Analysis
By: Edris
XRP/USDT Daily Chart:
On the daily timeframe of the USDT paired chart, the price has recently been rejected from the $0.9 level and is currently declining. The $0.6 support level and the 50-day moving average located around the same area are probable targets for a deep pullback.
However, the price could rebound before reaching those levels. In that case, a breakout above the $0.9 resistance level could be expected. This could lead to a higher rally, and XRP could be trade $1 in the coming months.
XRP/BTC Daily Chart:
Against Bitcoin, the situation is similar. The price has failed to break above the 2,800 SAT level twice over the past few weeks. The market is currently demonstrating bearish price action, with the 2,200 SAT area being the first significant support level.
The 50-day moving average trending around the 2,000 SAT mark would also be the next support element in line in case a deeper decline is on the horizon.
Nevertheless, the RSI indicator is displaying values above 50%, indicating that the buyers are still in control, and a breakout from the 2,800 SAT resistance zone might still materialize in the short term.