Despite positive developments such as the approval of Bitcoin spot ETFs by the U.S. Securities and Exchange Commission, Bitcoin’s price encountered significant rejection, resulting in a notable 17% decline. However, as the cryptocurrency approaches a crucial support region, there is potential for a renewed bullish movement. Technical Analysis By Shayan The Daily Chart Analyzing the daily chart, Bitcoin’s attempt to overcome the substantial resistance at K was met with rejection, leading to a 17% decline towards a critical support region. It includes the middle boundary of the ascending channel and the pivotal 200-day moving average at K, serving as robust support for Bitcoin buyers. If the retracement persists, the price is anticipated to find support around K,
Topics:
CryptoVizArt considers the following as important: Bitcoin (BTC) Price, BTC Analysis, BTCEUR, BTCGBP, btcusd, btcusdt
This could be interesting, too:
Mandy Williams writes Bitcoin ETFs Record Over .6B in Outflows in the Past 2 Weeks
Chayanika Deka writes Bitcoin Whales Offload 6,813 BTC as Selling Pressure Mounts
Wayne Jones writes Bitcoin Sentiment Hits 2022 Lows as Fear & Greed Index Falls to 10
Jordan Lyanchev writes Bitcoin Falls Below K for the First Time in 3 Months, How Much Lower Can It Go?
Despite positive developments such as the approval of Bitcoin spot ETFs by the U.S. Securities and Exchange Commission, Bitcoin’s price encountered significant rejection, resulting in a notable 17% decline.
However, as the cryptocurrency approaches a crucial support region, there is potential for a renewed bullish movement.
Technical Analysis
By Shayan
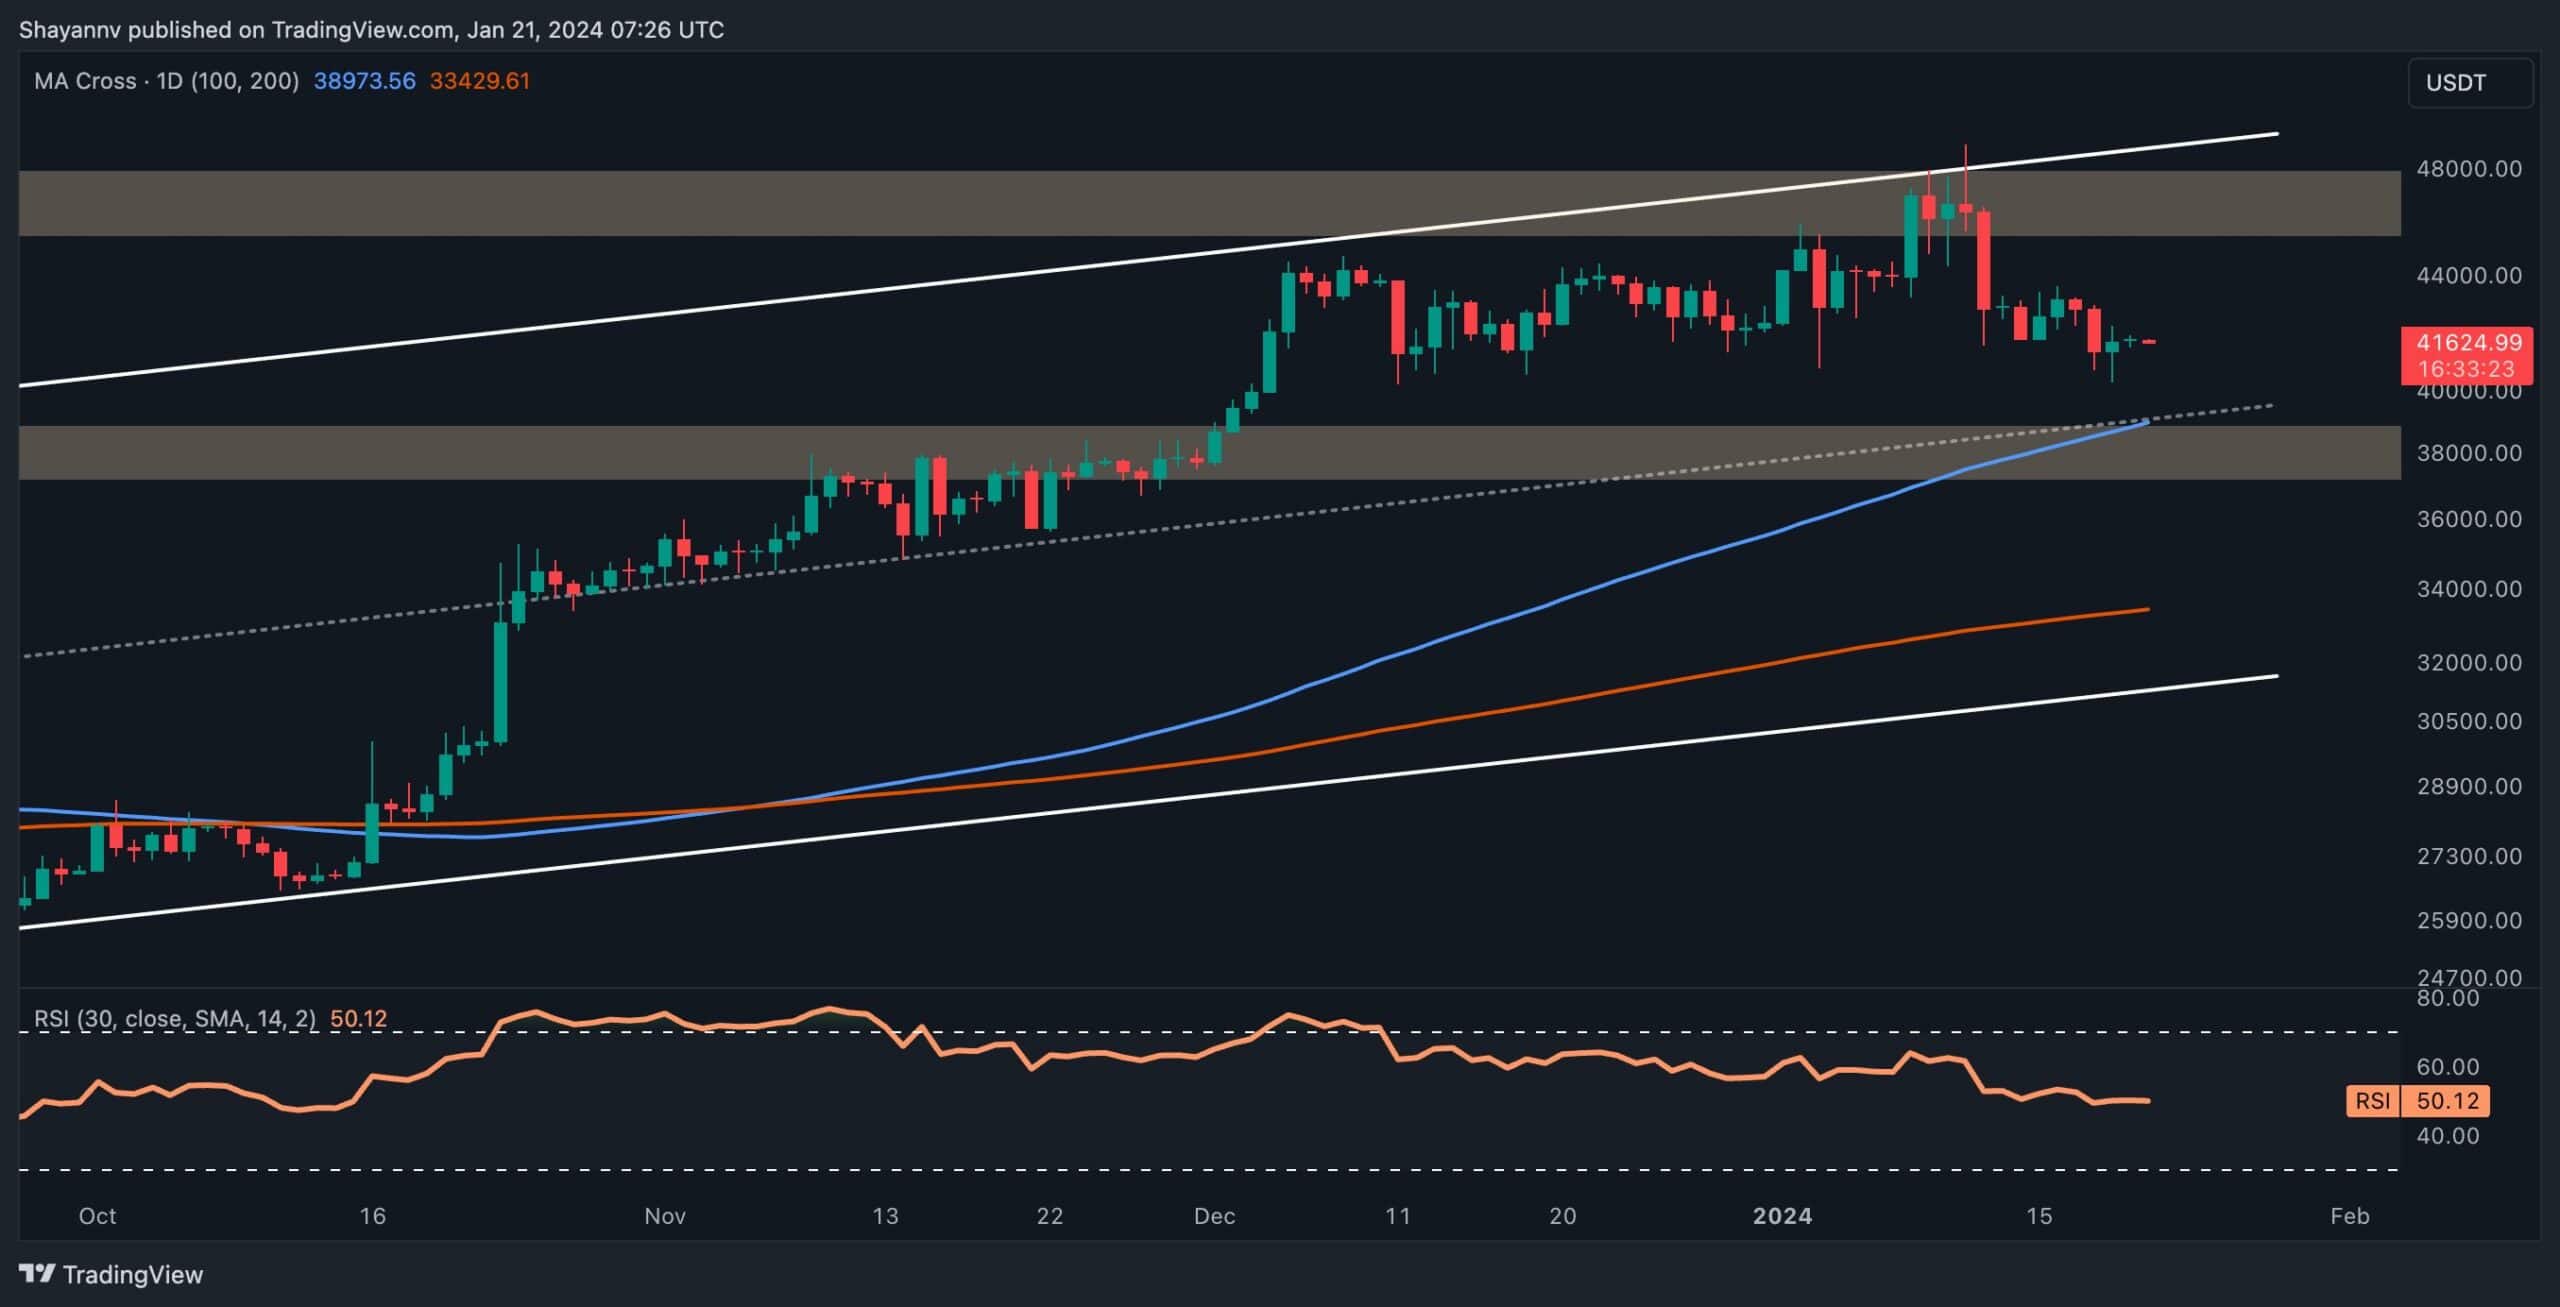
The Daily Chart
Analyzing the daily chart, Bitcoin’s attempt to overcome the substantial resistance at $48K was met with rejection, leading to a 17% decline towards a critical support region. It includes the middle boundary of the ascending channel and the pivotal 200-day moving average at $39K, serving as robust support for Bitcoin buyers.
If the retracement persists, the price is anticipated to find support around $39K, possibly triggering a renewed bullish surge. However, an unexpected break below the 200-day moving average could lead to a cascade, flushing out a notable amount of sell-stop orders, resulting in a long-squeeze event.
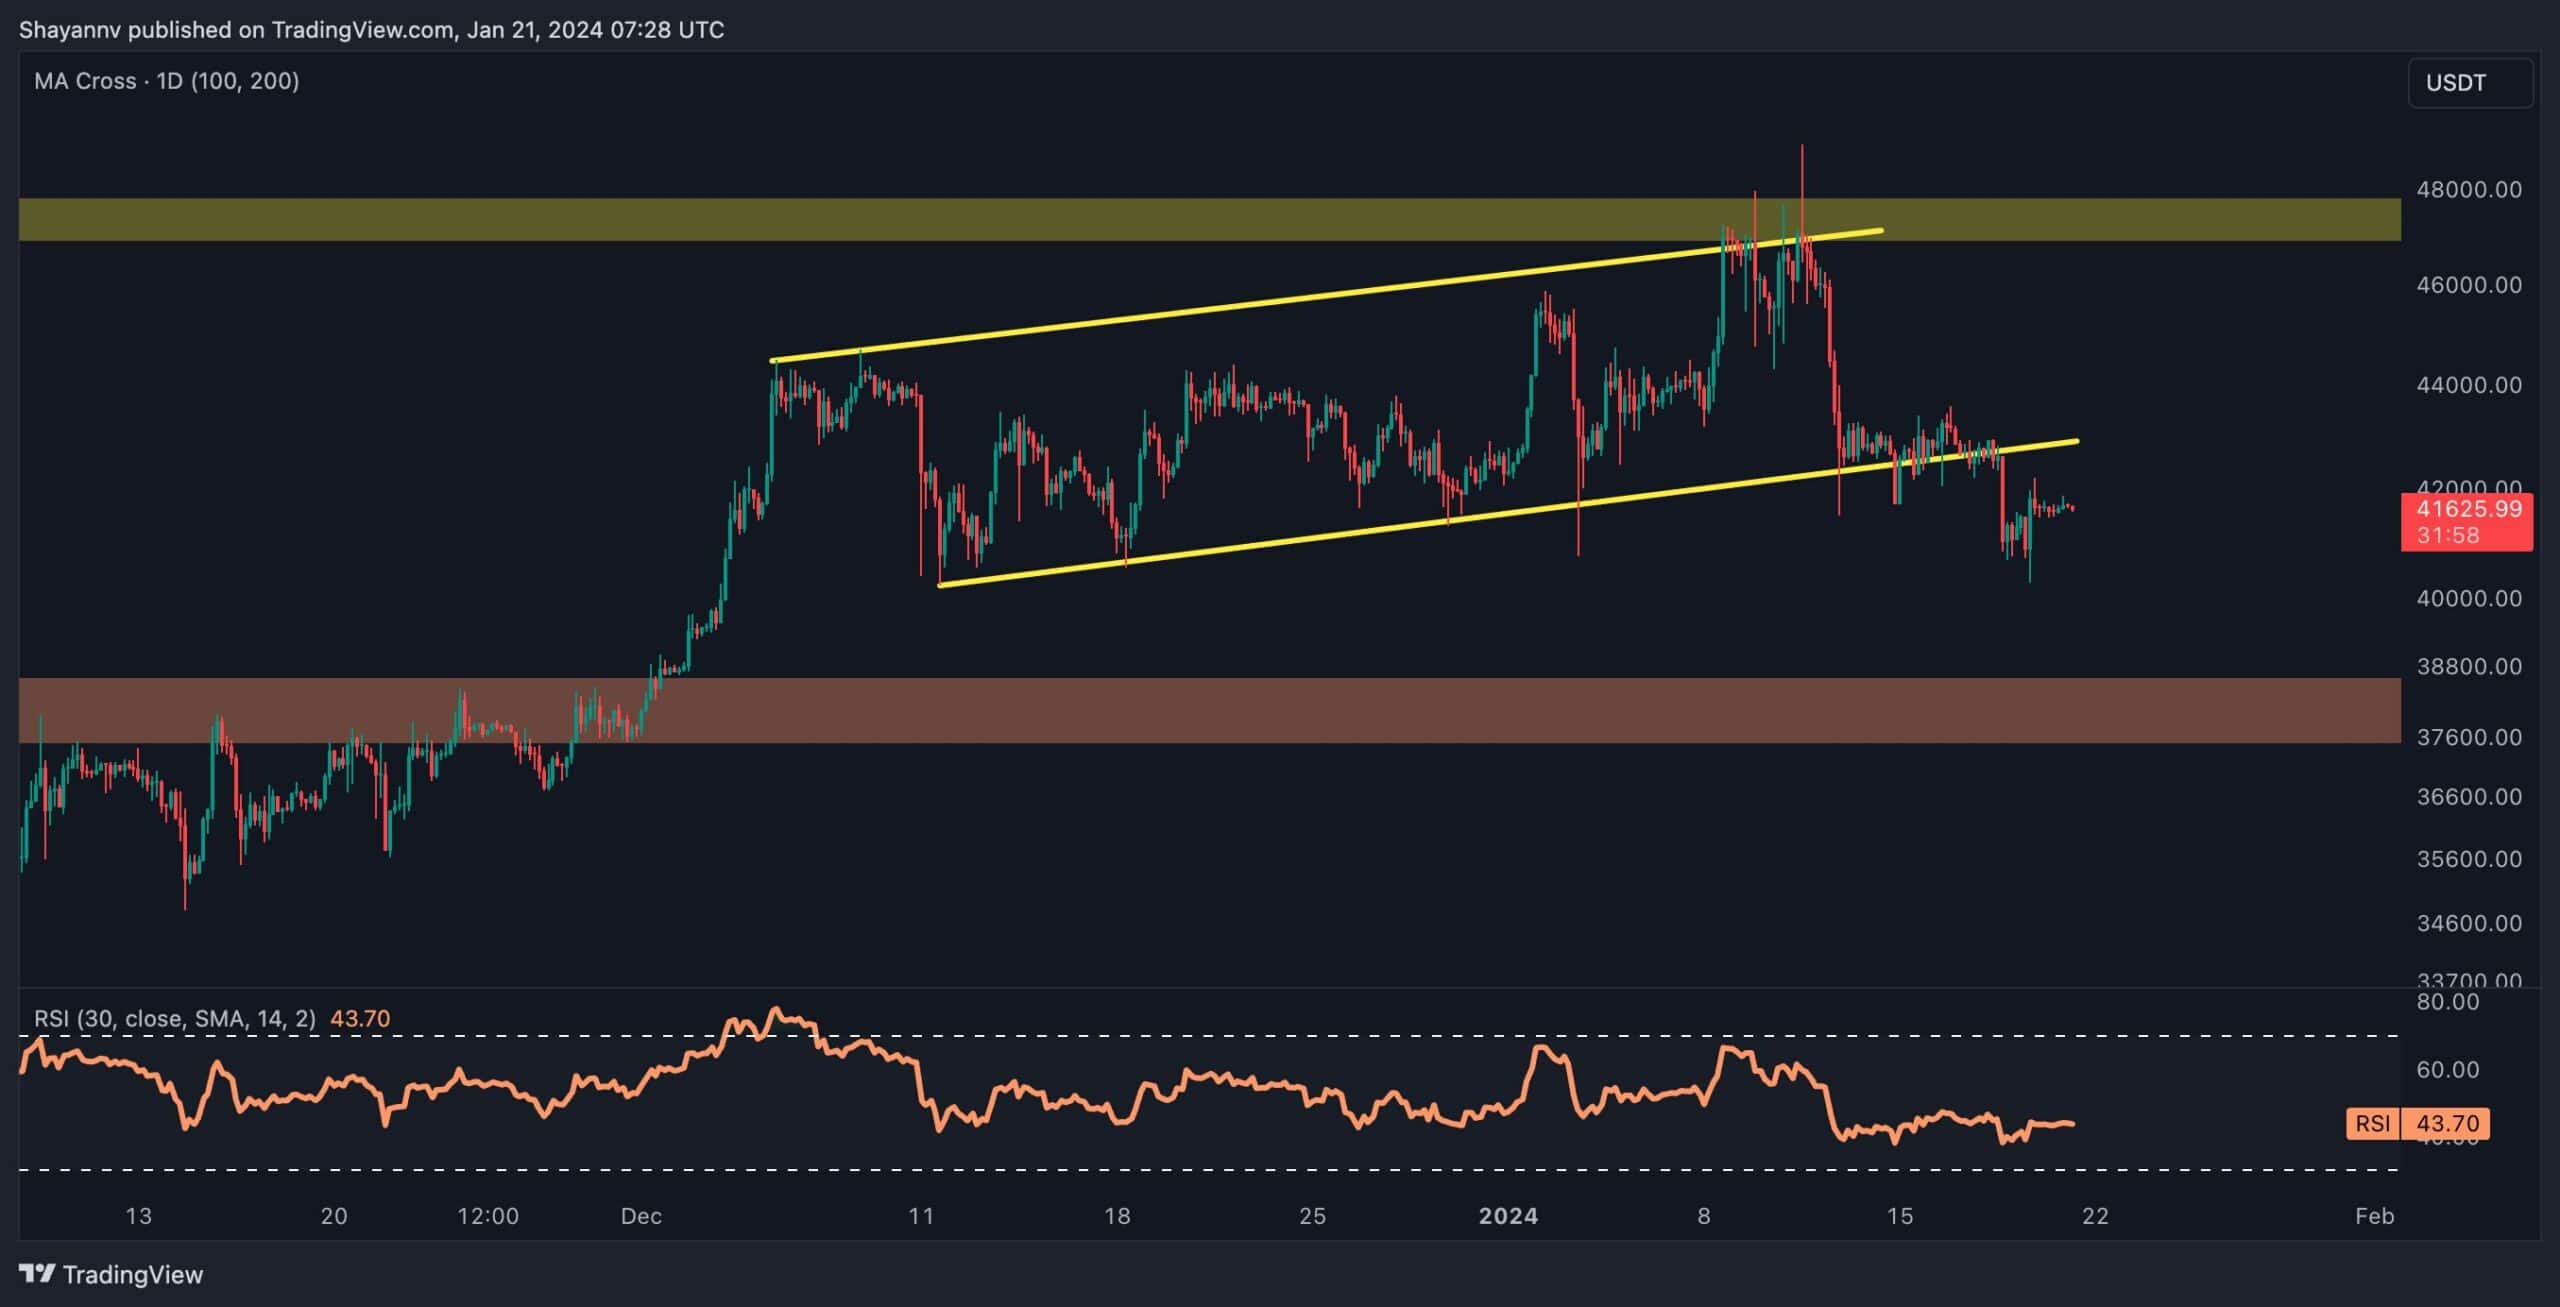
The 4-Hour Chart
On the 4-hour chart, the rejection from the $48K resistance zone extended, with the price breaking below the lower boundary of the ascending flag, indicating the presence of sellers. However, after a strong breakout, a retracement towards the flag’s lower boundary is underway, potentially completing a pullback. If it happens, the retrace could pave the way for the continuation of Bitcoin’s downward movement in the short term, targeting the static support range of $39K.
Nevertheless, Bitcoin’s mid-term prospects suggest consolidation within the critical price range bounded by the substantial resistance zone at $48K and the decisive support at $39K. Nonetheless, a successful breakout from this zone will shed light on the cryptocurrency’s next impulsive trend.
On-chain Analysis
By Shayan
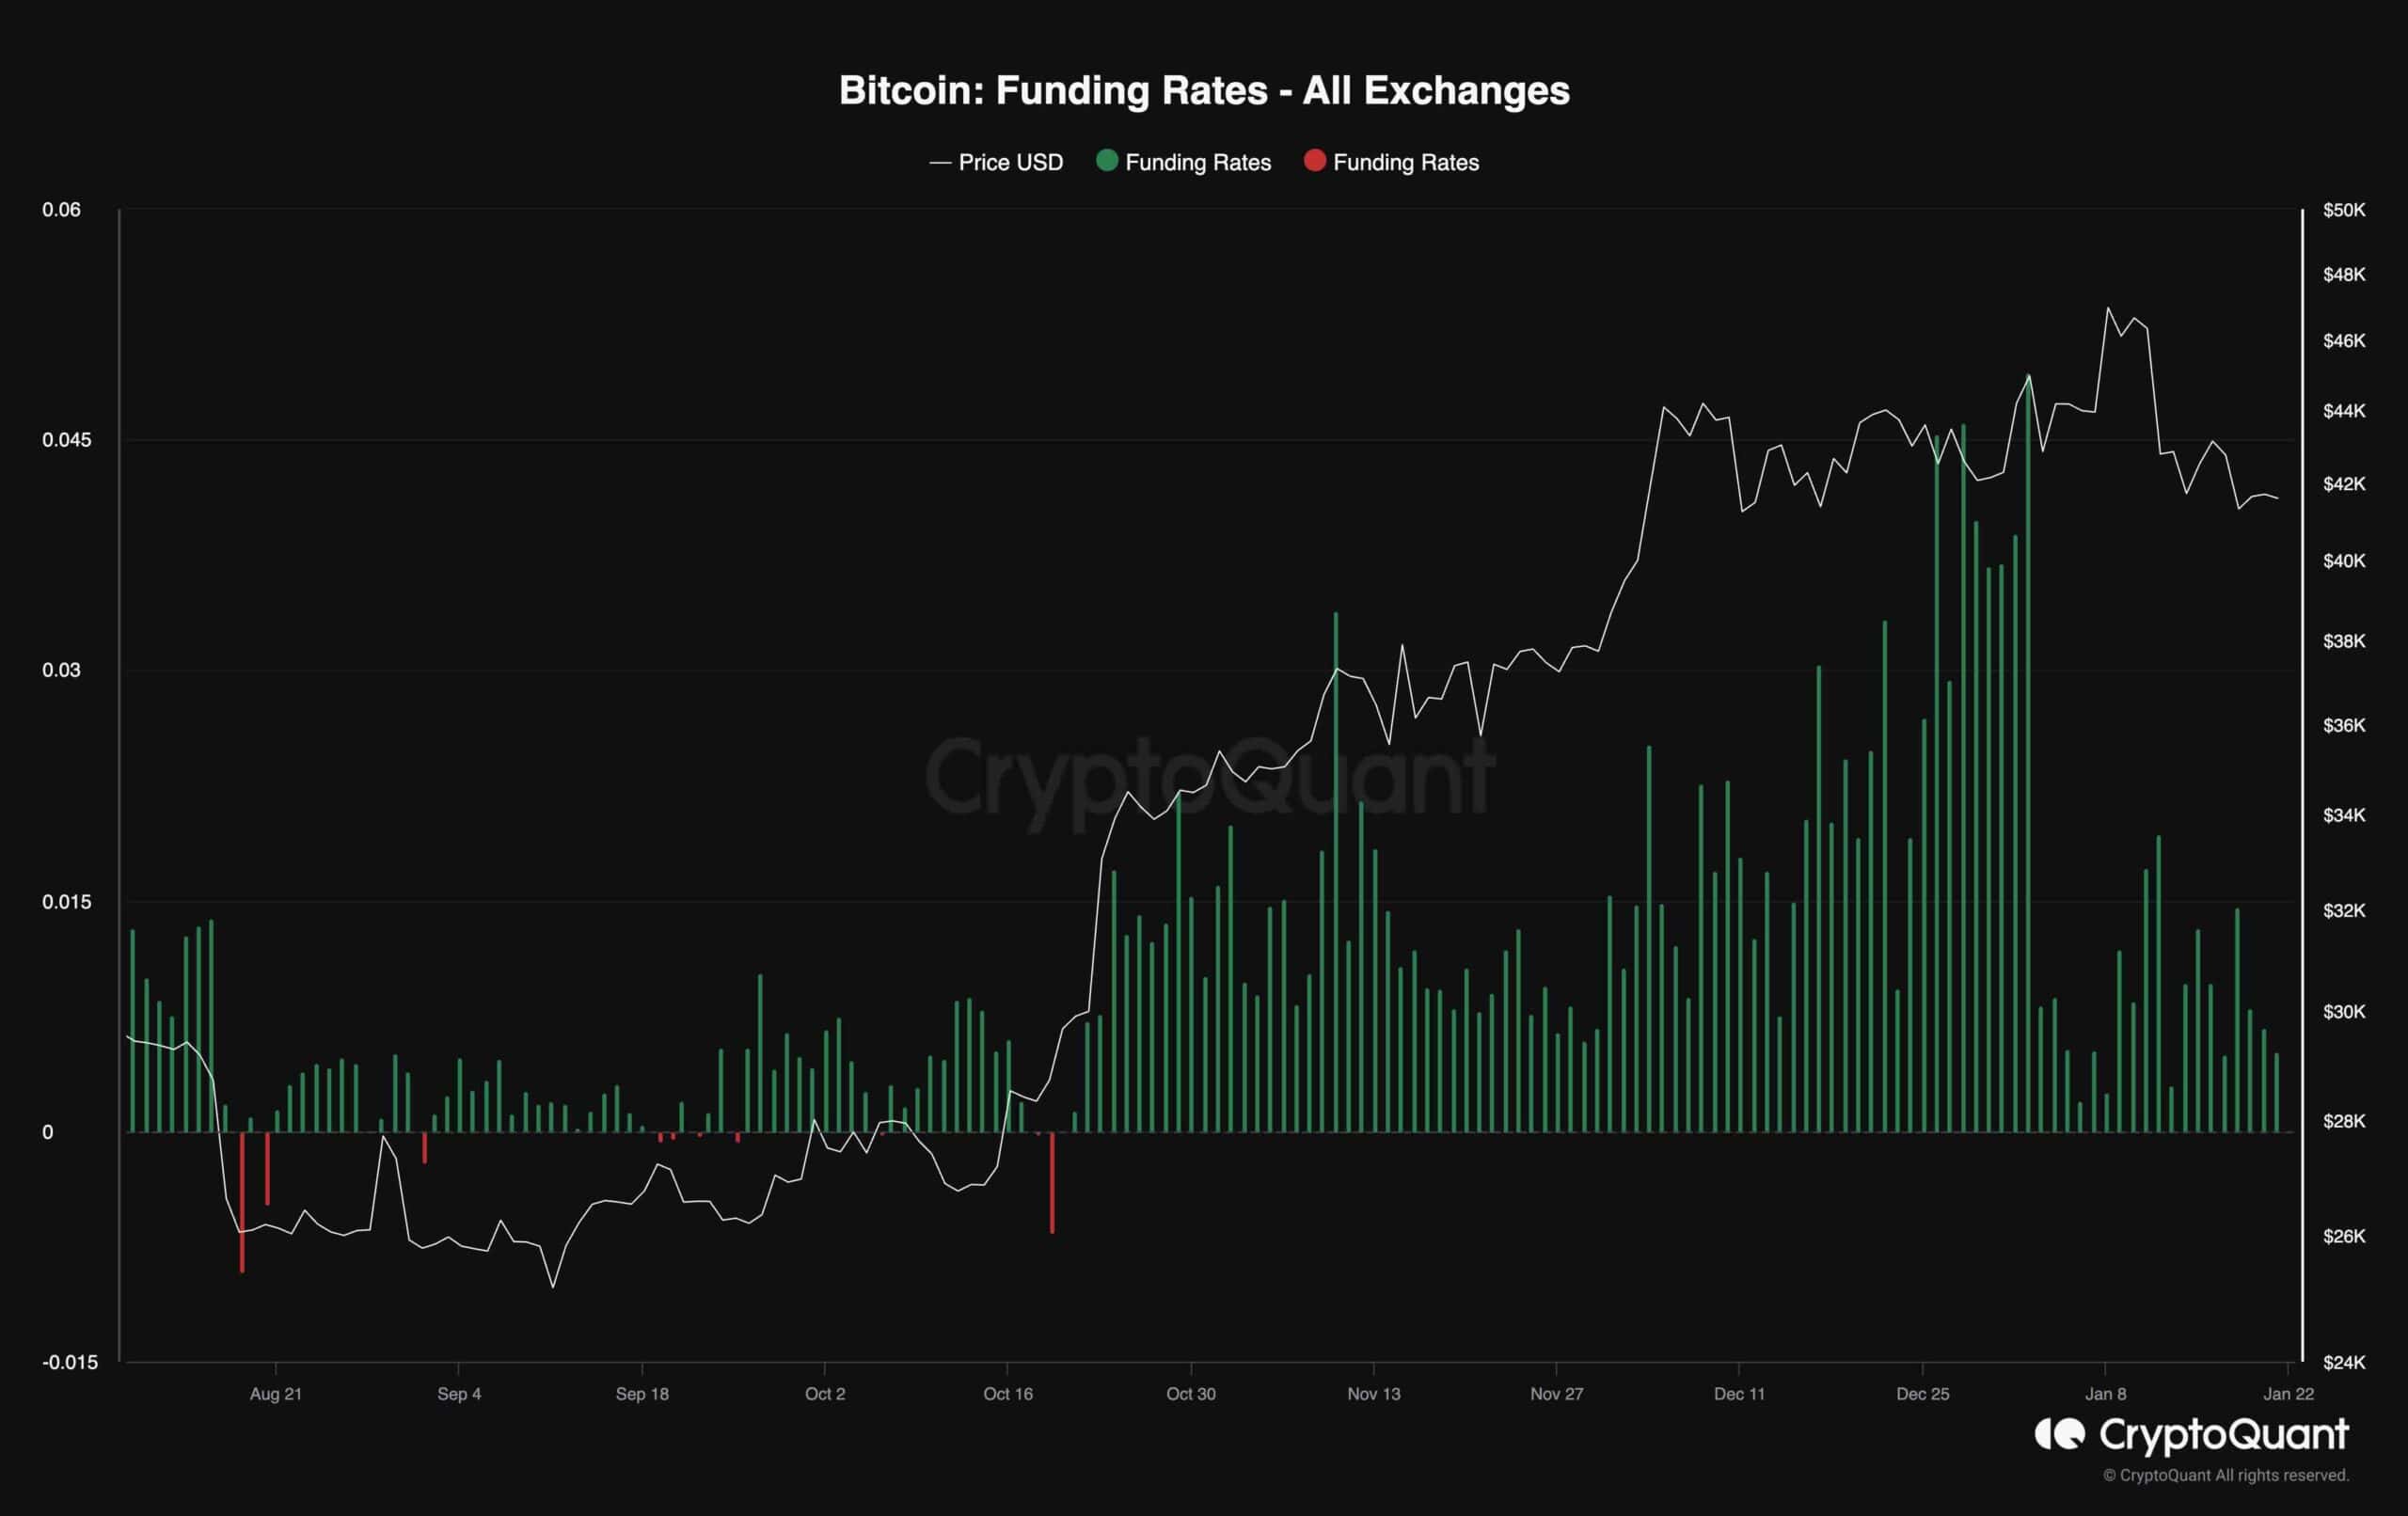
As Bitcoin faces a notable price rejection, there is a growing concern among market participants about the sustainability of the current uptrend. Valuable insight can be gained by analyzing the sentiment in the futures market.
The following chart illustrates the Bitcoin funding rates – a key indicator in futures market sentiment analysis. It helps gauge whether buyers or sellers are executing their orders more aggressively.
Despite the recent short-term correction, the funding rates have experienced a significant decline. However, it’s noteworthy that the metric still shows positive values. This can be interpreted as a positive sign, suggesting that the sentiment remains bullish while the futures market has cooled off from being overheated.
As a result, there is a possibility that the price might continue its upward trajectory after completing the current correction stage.