Bitcoin’s price has failed to keep up its upward momentum and has yet to set a new record high above the K level. Given the current price action, even a deeper correction is probable. Technical Analysis By TradingRage The Daily Chart On the daily chart, the price dropped below the K support level a few days ago. It has dropped back inside the large descending channel, making its recent breakout fake. The K support level seems like a valid target for the upcoming weeks, and the 200-day moving average trending around the K mark can be the next target for the worst-case scenario. Source: TradingViewThe 4-Hour Chart Looking at the 4-hour timeframe, things seem more apparent. The price has been forming an ascending channel pattern around the K resistance zone.
Topics:
CryptoVizArt considers the following as important: Bitcoin (BTC) Price, BTC Analysis, BTCEUR, BTCGBP, btcusd, btcusdt
This could be interesting, too:
Chayanika Deka writes XRP, SOL, and ADA Inclusion in US Crypto Reserve Pushes Traders on Edge
Chayanika Deka writes Why Arthur Hayes Is Bullish on Bitcoin Under Trump’s Economic Strategy
Mandy Williams writes Why the Bitcoin Market Is Stuck—and the Key Metric That Could Change It: CryptoQuant CEO
Wayne Jones writes Metaplanet Acquires 156 BTC, Bringing Total Holdings to 2,391
Bitcoin’s price has failed to keep up its upward momentum and has yet to set a new record high above the $75K level. Given the current price action, even a deeper correction is probable.
Technical Analysis
By TradingRage
The Daily Chart
On the daily chart, the price dropped below the $68K support level a few days ago. It has dropped back inside the large descending channel, making its recent breakout fake.
The $60K support level seems like a valid target for the upcoming weeks, and the 200-day moving average trending around the $56K mark can be the next target for the worst-case scenario.
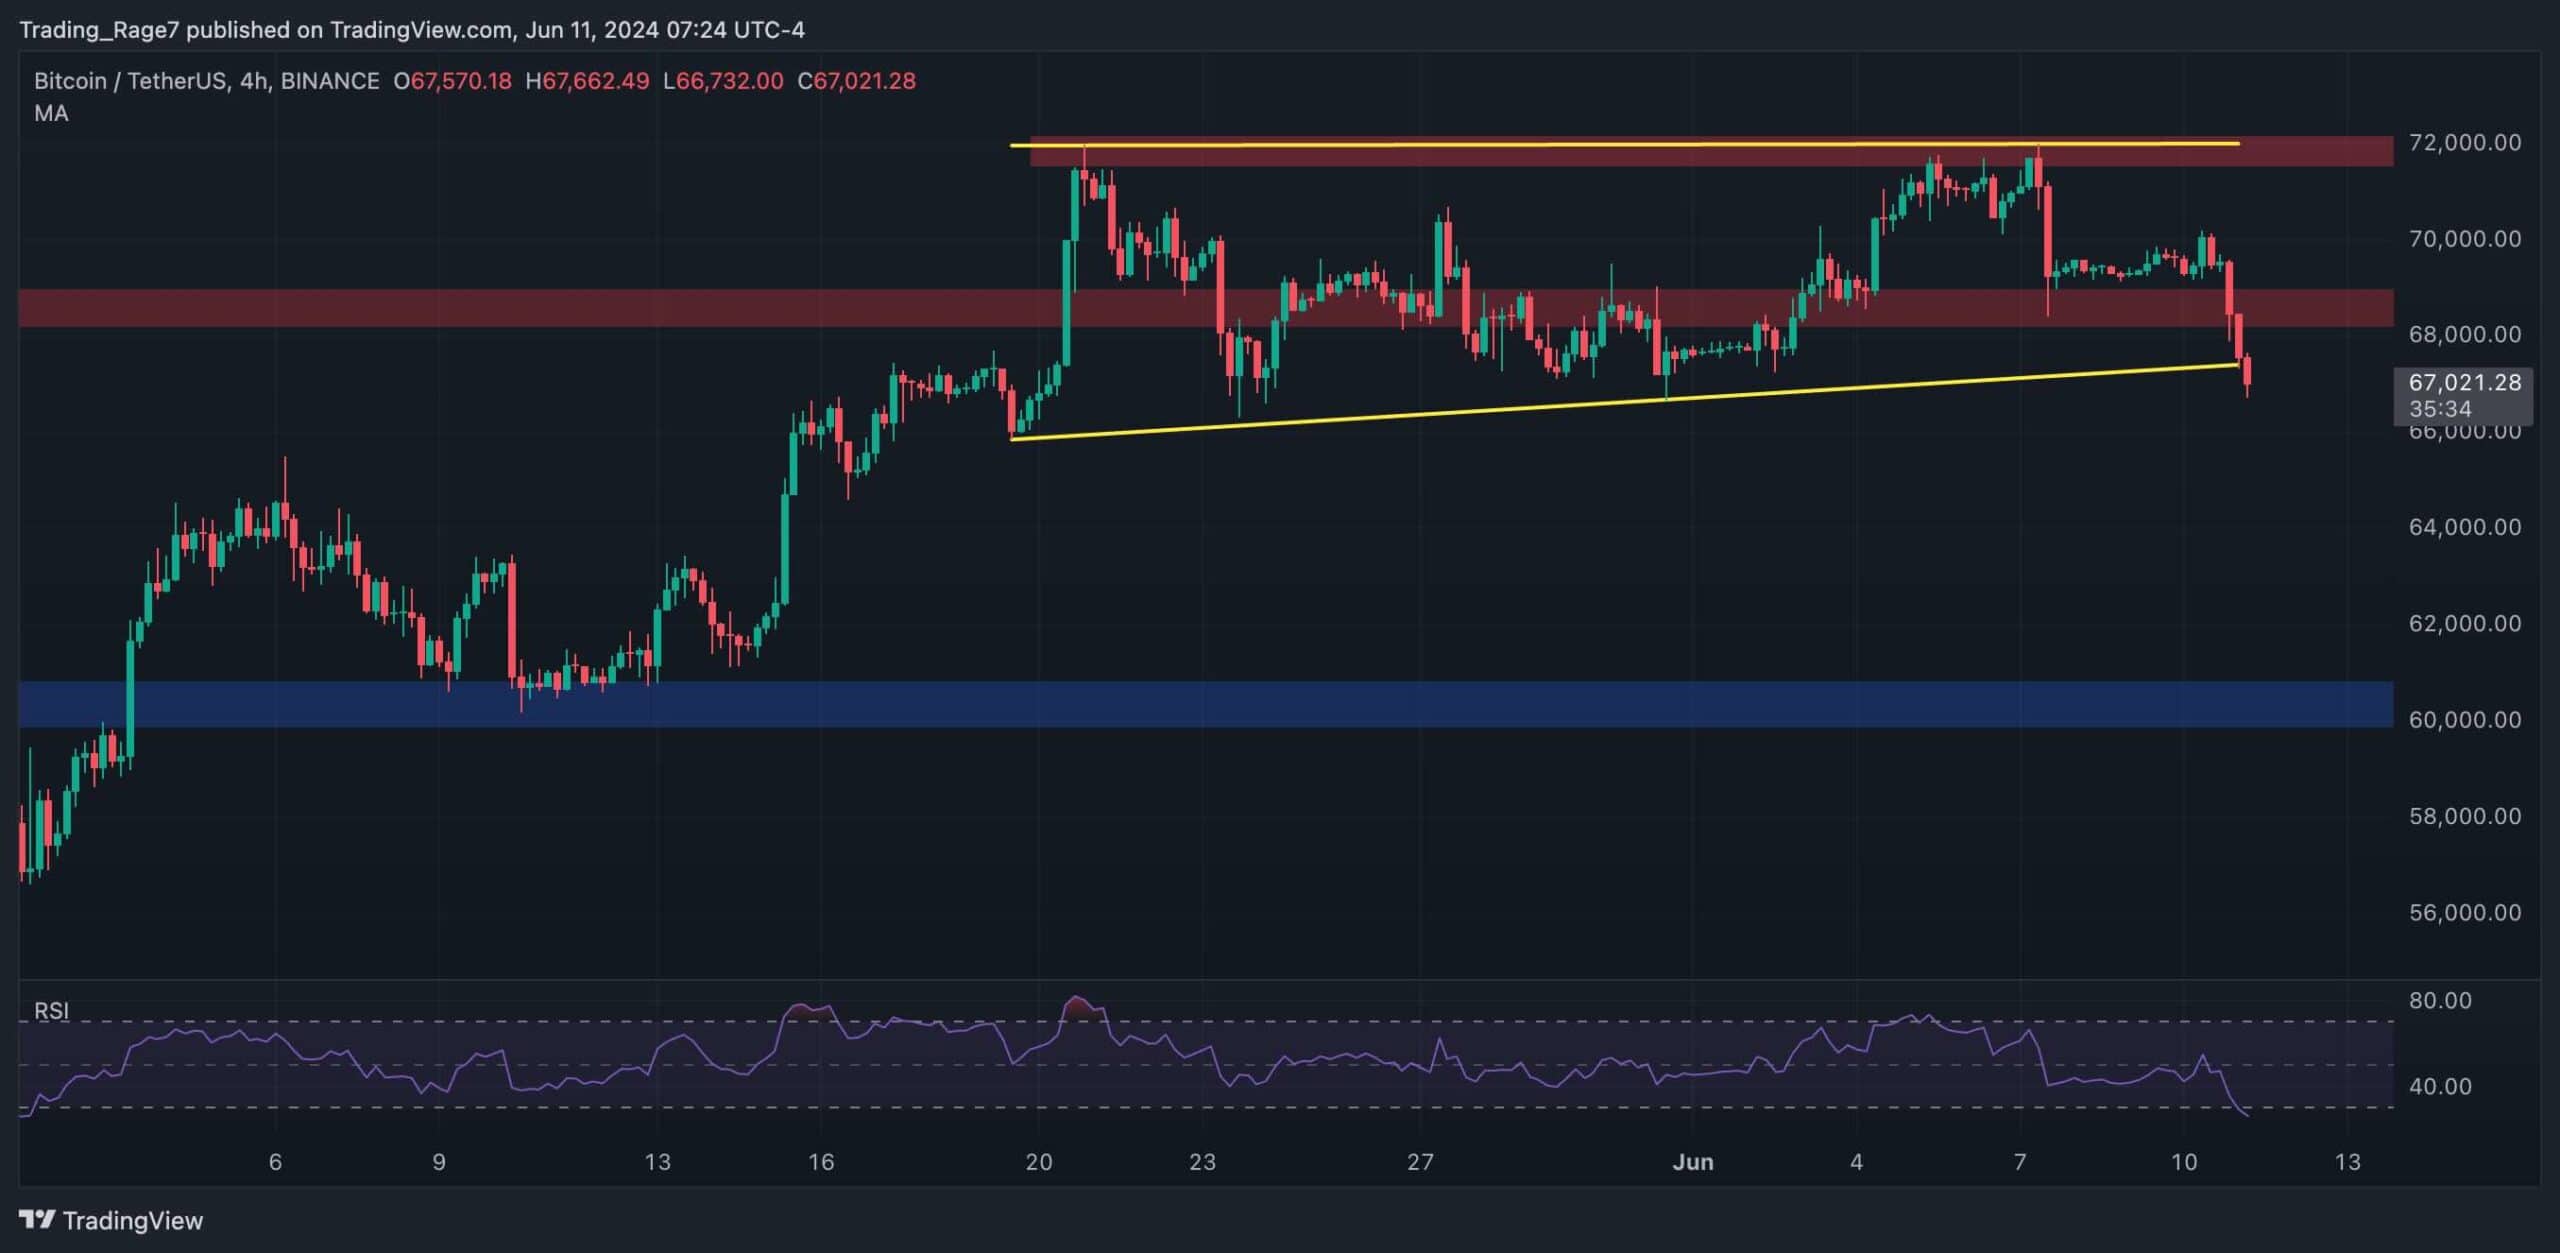
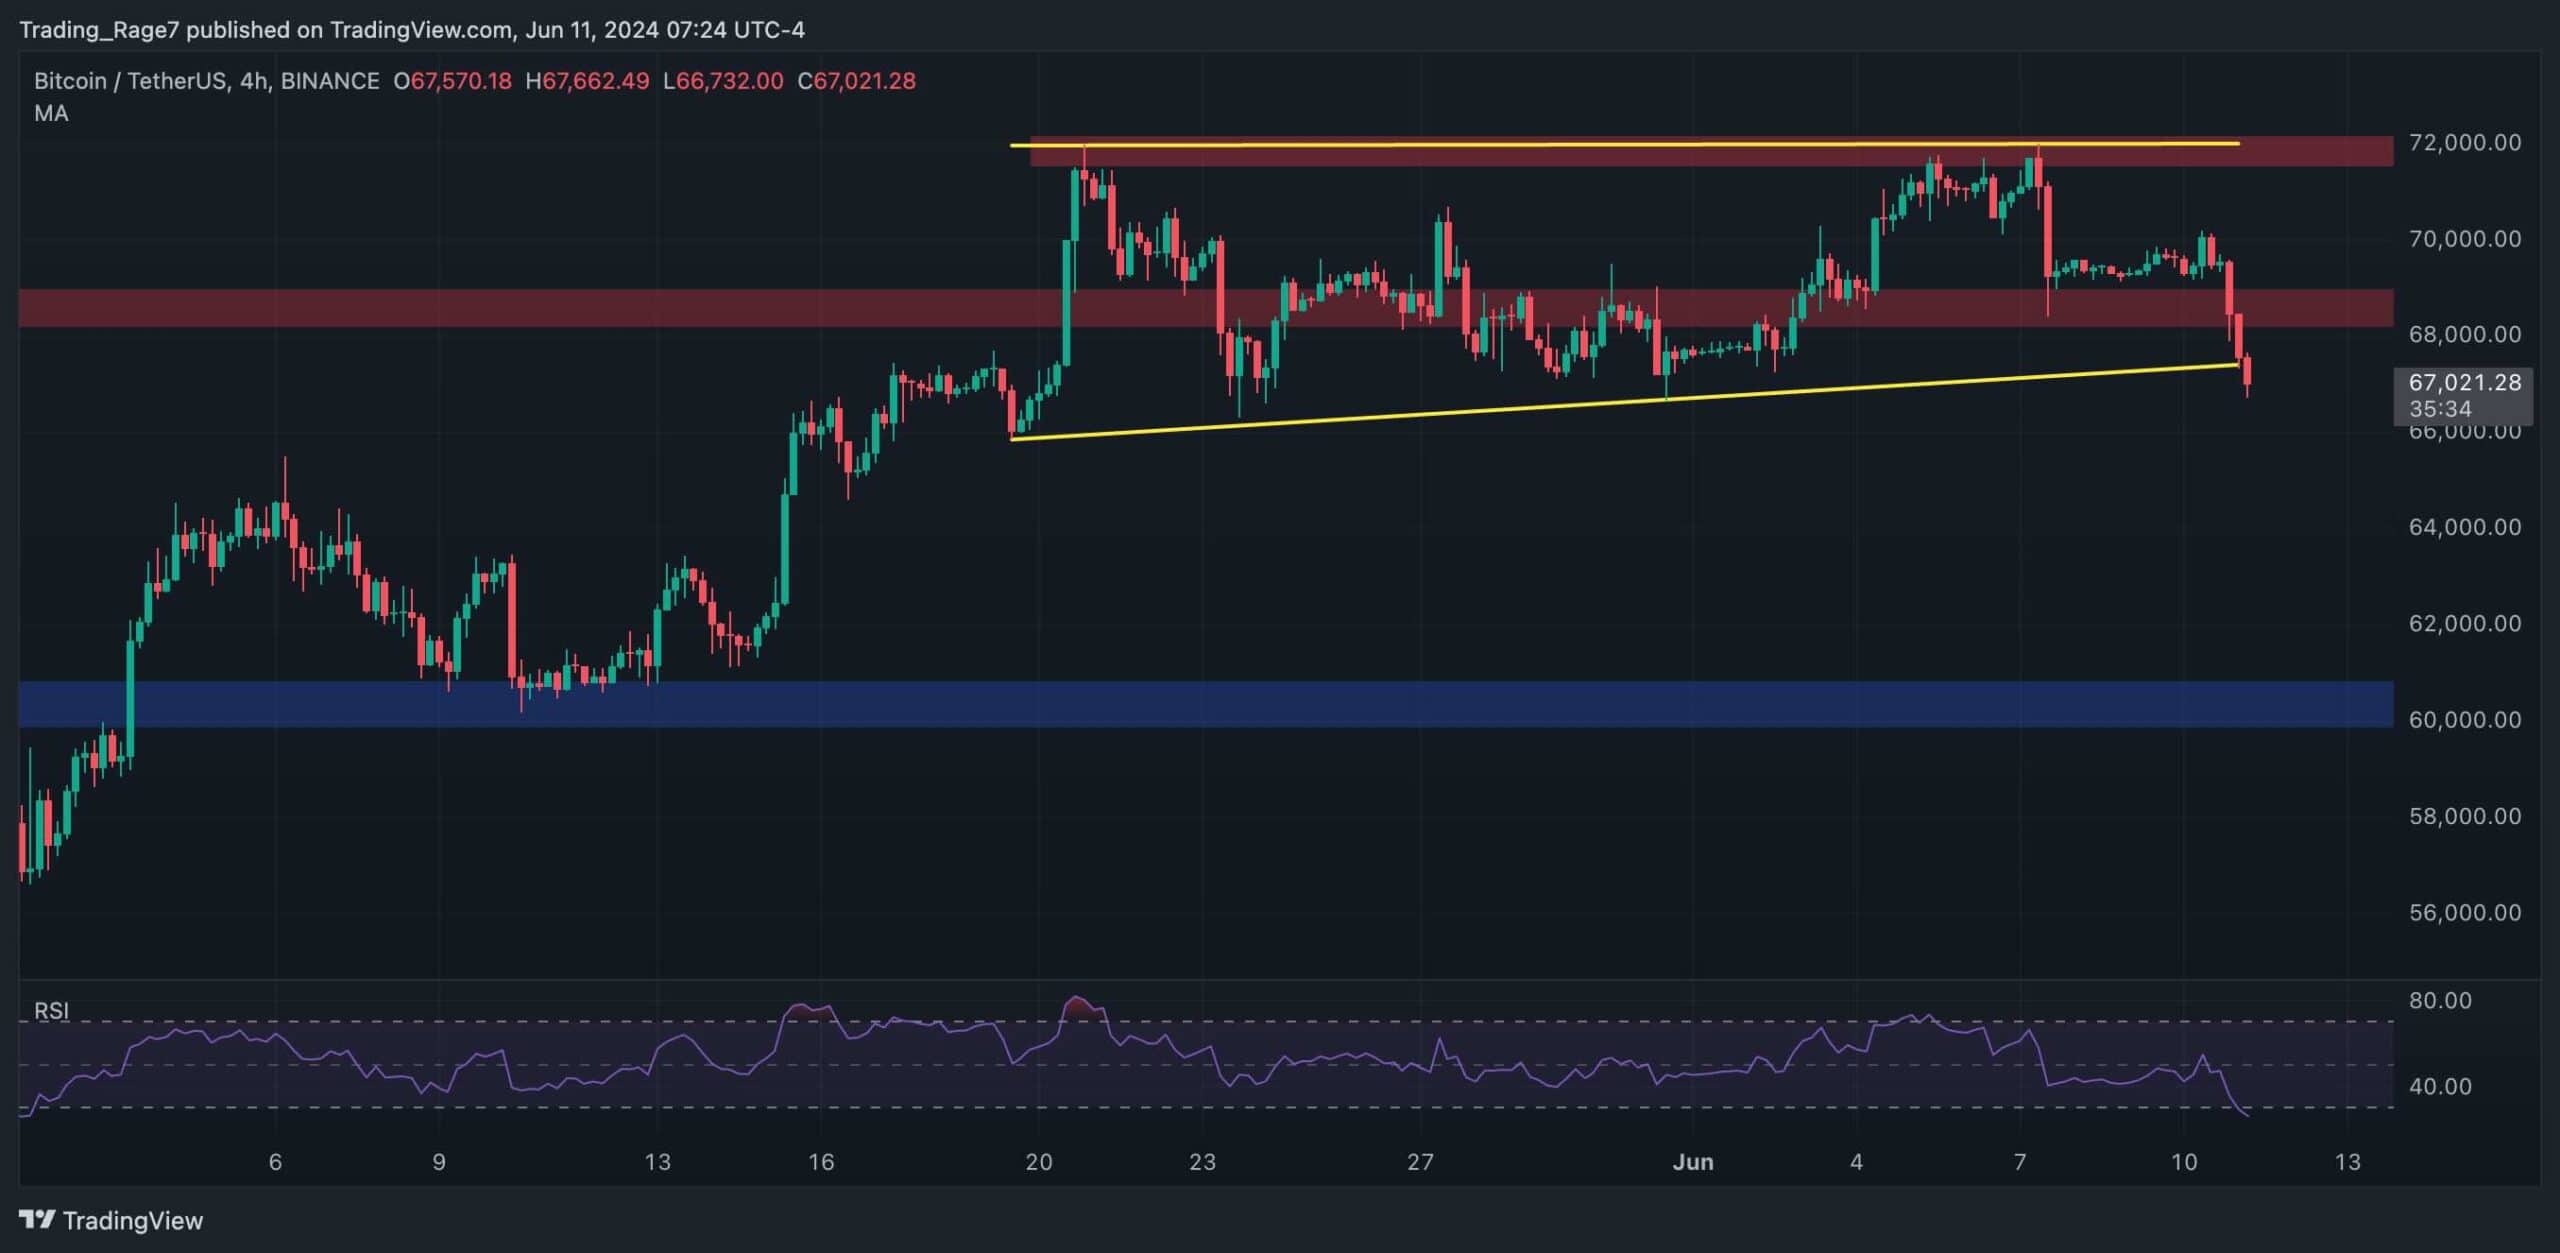
The 4-Hour Chart
Looking at the 4-hour timeframe, things seem more apparent. The price has been forming an ascending channel pattern around the $70K resistance zone. Yet, the channel is getting broken to the downside, which is a classical bearish reversal indication.
Meanwhile, the RSI has entered the oversold region, pointing to a potential bear trap. Therefore, if the market quickly climbs back inside the channel, the bearish scenario would fail, and a bullish reversal could be expected.
On-Chain Analysis
By TradingRage
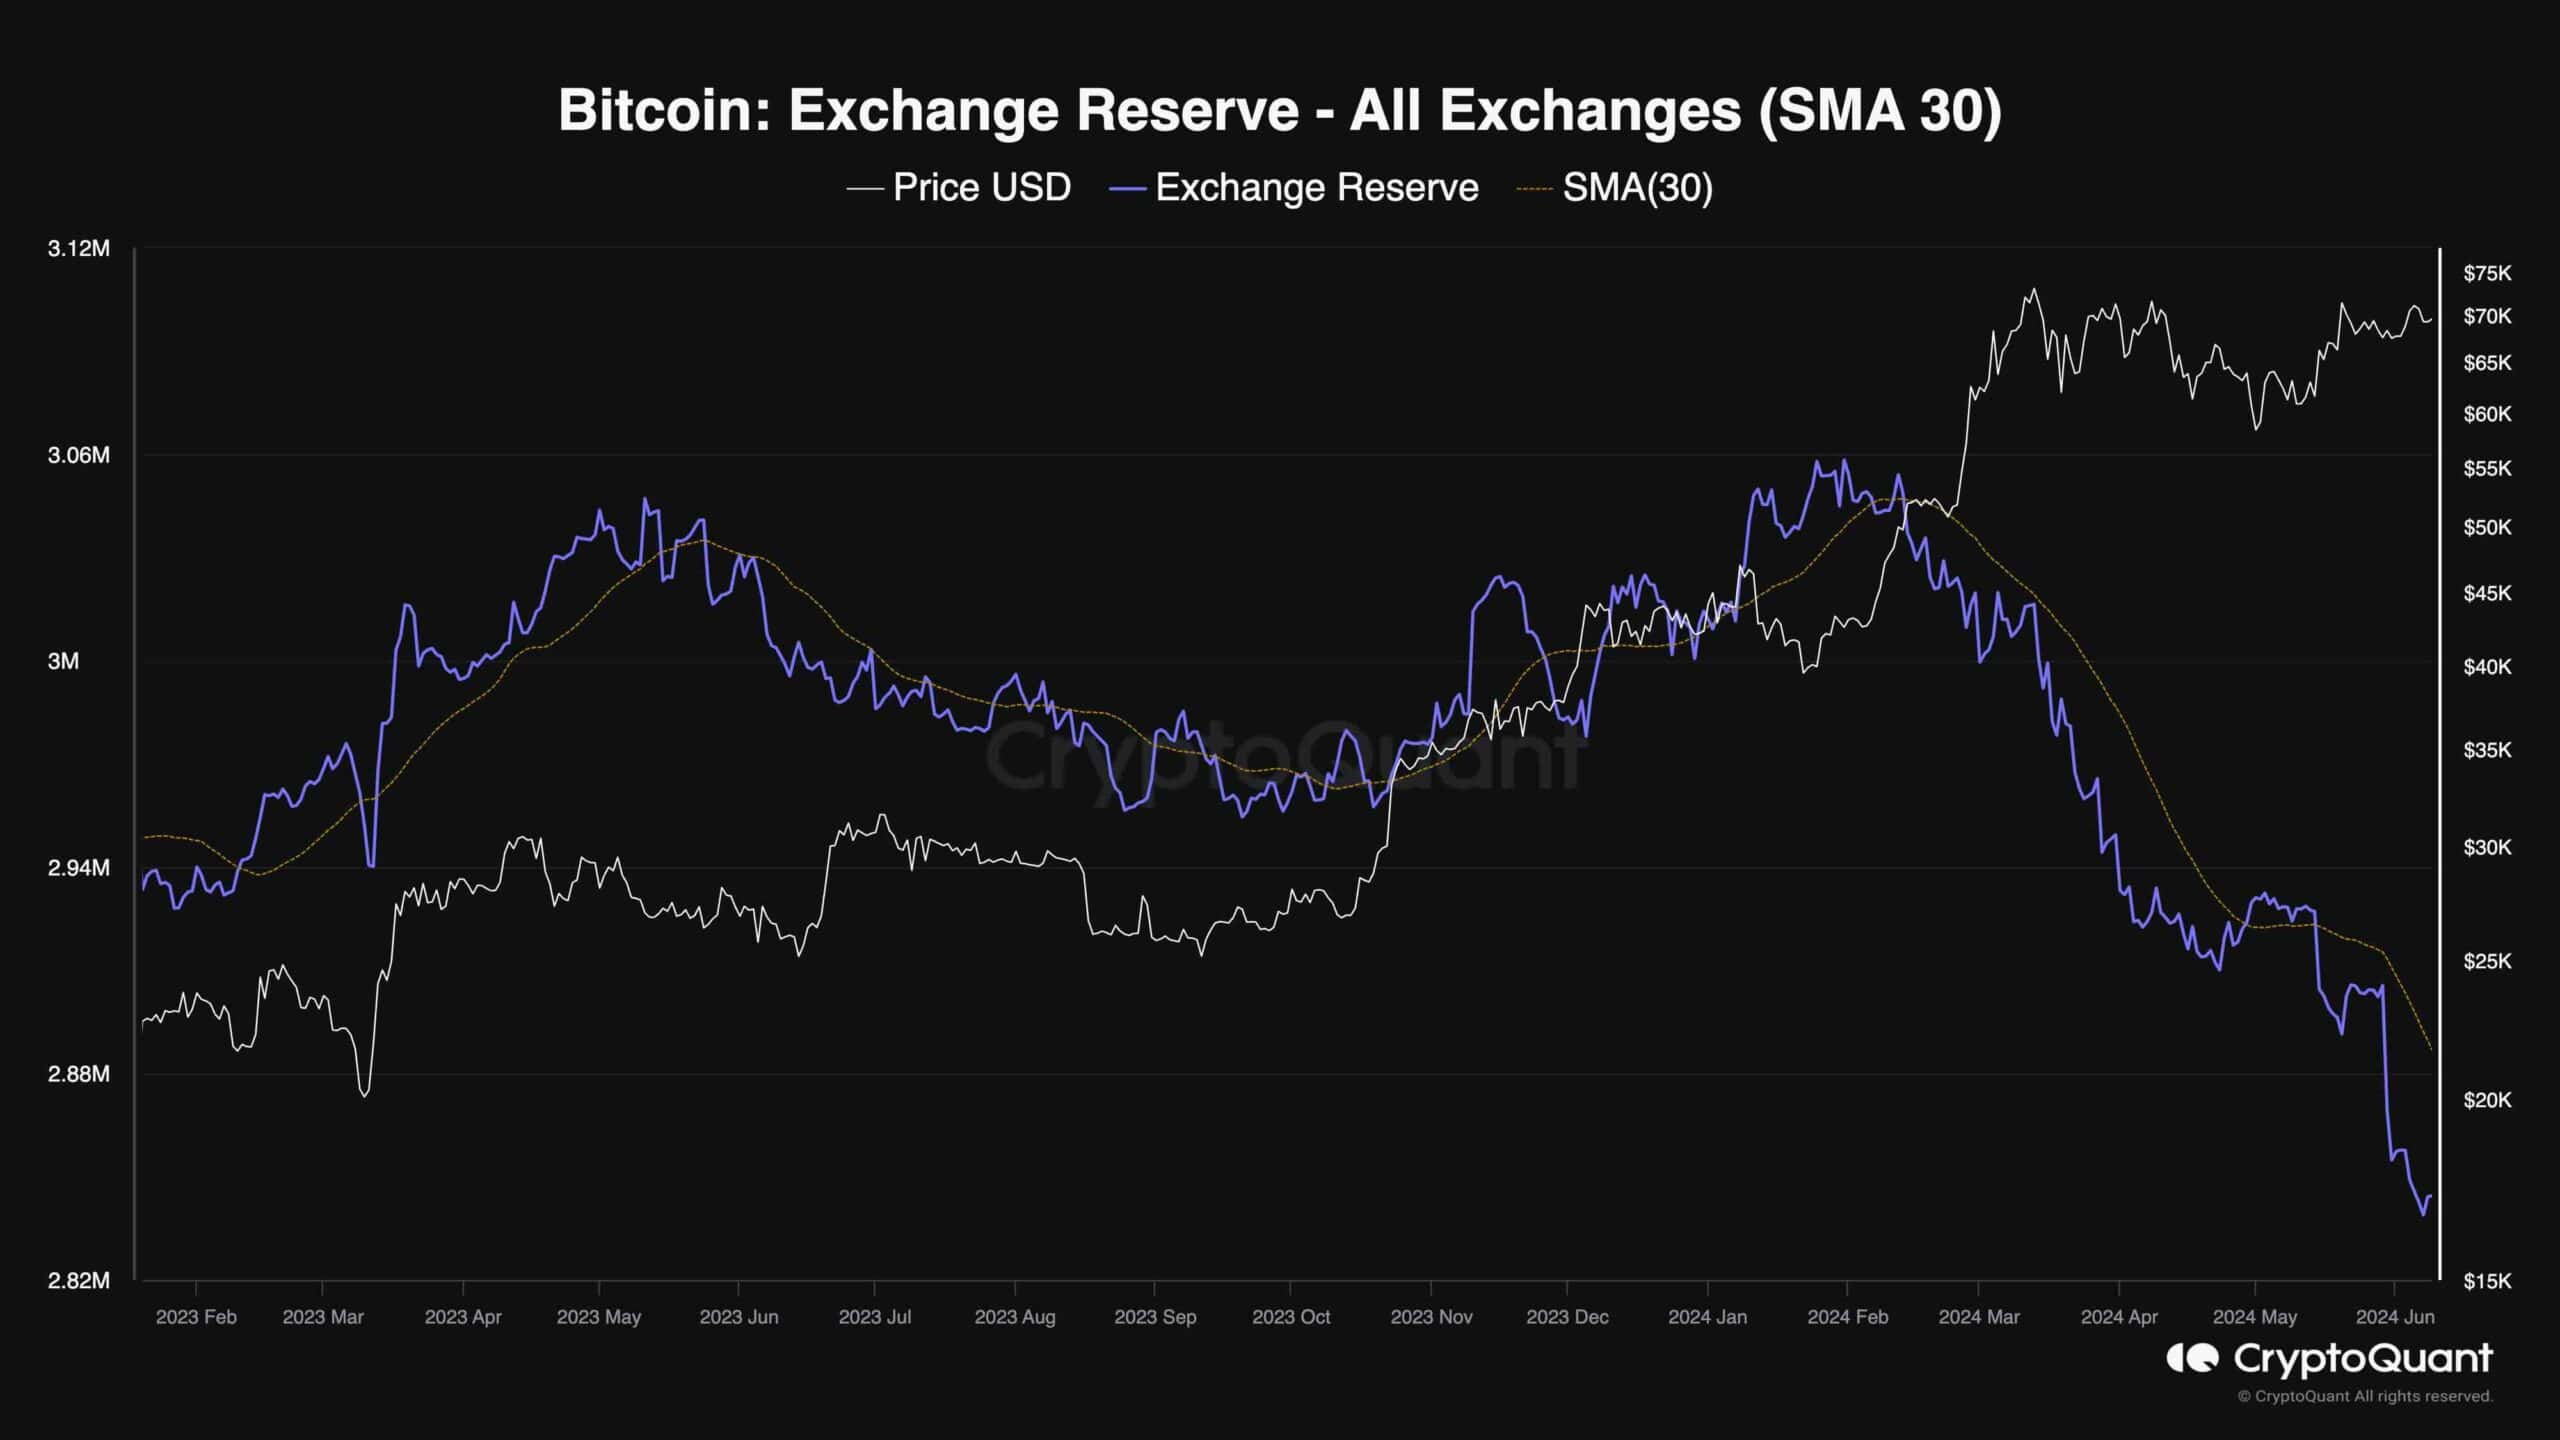
Exchange Reserve
While Bitcoin’s bullish momentum is seemingly fading, things are going strong in the background. This chart demonstrates the BTC exchange reserve metric, which measures the amount of Bitcoin held in exchange wallets.
A decline in exchange reserve typically shows dominating demand, while increases are associated with excessive supply.
The exchange reserve has been on a steep decline recently, significantly since the price recovered from the $60K level earlier in May. While the technicals do not favor a rally, the fundamentals of Bitcoin supply and demand seem strong and could lead to a price surge in the coming months.