Summary:
Binance Coin saw a slight increase of around 4% over the past 24 hours and it currently trades at .24. BNB managed to surge by a total of 20% this past week which caused it to break above the resistance at .Binance Coin remains the seventh-largest cryptocurrency with a market cap of .15 billion.Since our previous BNB analysis, the cryptocurrency continued to climb above the resistance at .85 and managed to break above the level. BNB continued to rise until meeting resistance at the 100-days EMA at around .10. This area of resistance is the August 2019 low.From above: The nearest level of resistance lies directly at .10 (100-days EMA). Above this, resistance is at .00 (200-days EMA), .67, , .16, .18, and .64.From below: The nearest level of support is
Topics:
Yaz Sheikh considers the following as important: Price Analysis
This could be interesting, too:
CryptoVizArt writes ETH’s Path to K Involves Maintaining This Critical Support (Ethereum Price Analysis)
Duo Nine writes Crypto Price Analysis June-29: ETH, XRP, ADA, DOGE, and DOT
Duo Nine writes Crypto Price Analysis June-15: ETH, XRP, ADA, DOGE, and DOT
Duo Nine writes Why is the Shiba Inu (SHIB) Price Down Today?
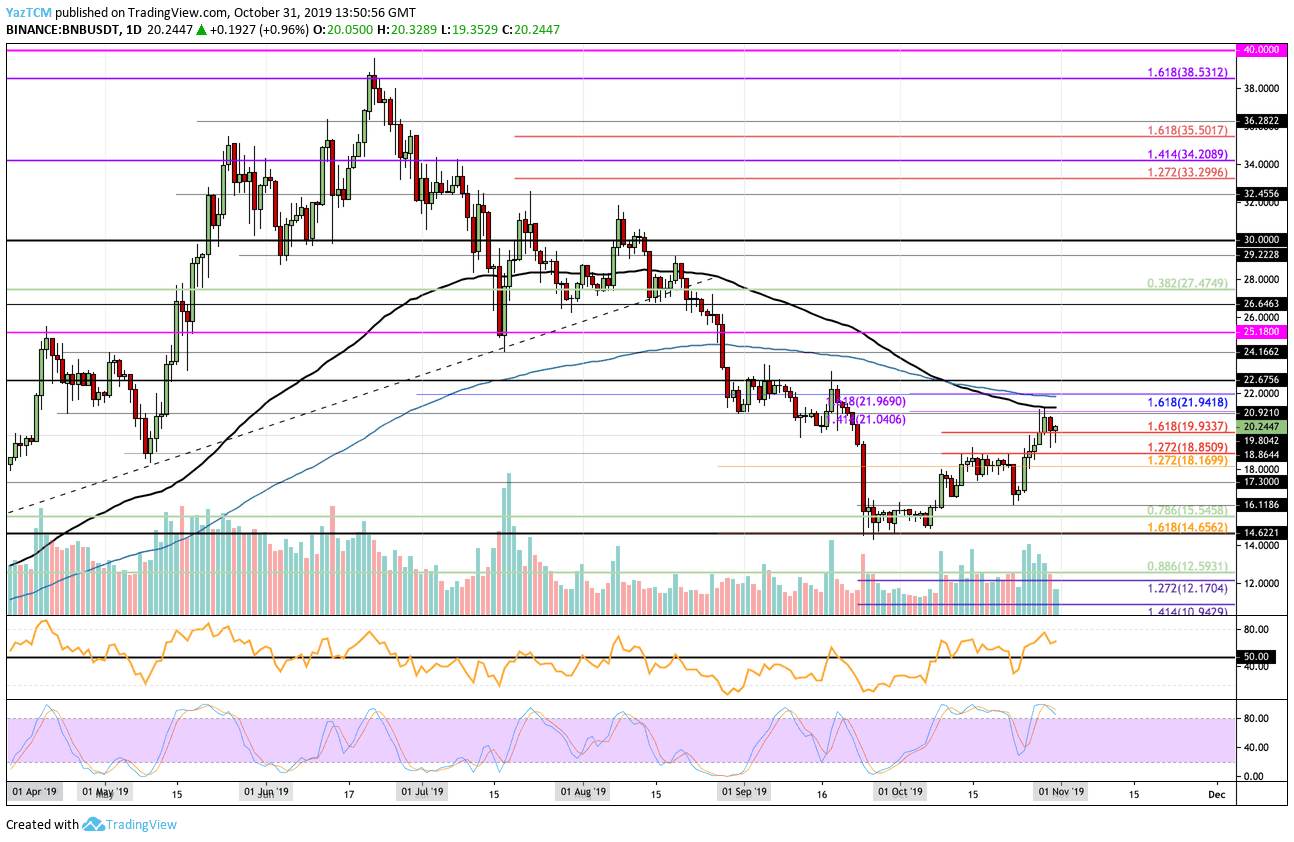
Binance Coin saw a slight increase of around 4% over the past 24 hours and it currently trades at $20.24. BNB managed to surge by a total of 20% this past week which caused it to break above the resistance at $20.
Binance Coin remains the seventh-largest cryptocurrency with a market cap of $3.15 billion.
- Since our previous BNB analysis, the cryptocurrency continued to climb above the resistance at $18.85 and managed to break above the $20 level. BNB continued to rise until meeting resistance at the 100-days EMA at around $21.10. This area of resistance is the August 2019 low.
- From above: The nearest level of resistance lies directly at $21.10 (100-days EMA). Above this, resistance is at $22.00 (200-days EMA), $22.67, $23, $14.16, $25.18, and $26.64.
- From below: The nearest level of support is found at $19.93. Beneath this, support lies at $18.85, $18.16, $17.30, $16.11, $15.54, and $14.65.
- The trading volume has been very high during October 2019 and remains high.
- The RSI is well above the 50 level as the bulls dominate the momentum, however, the Stochastic RSI has produced a bearish crossover signal that should send the market downward.
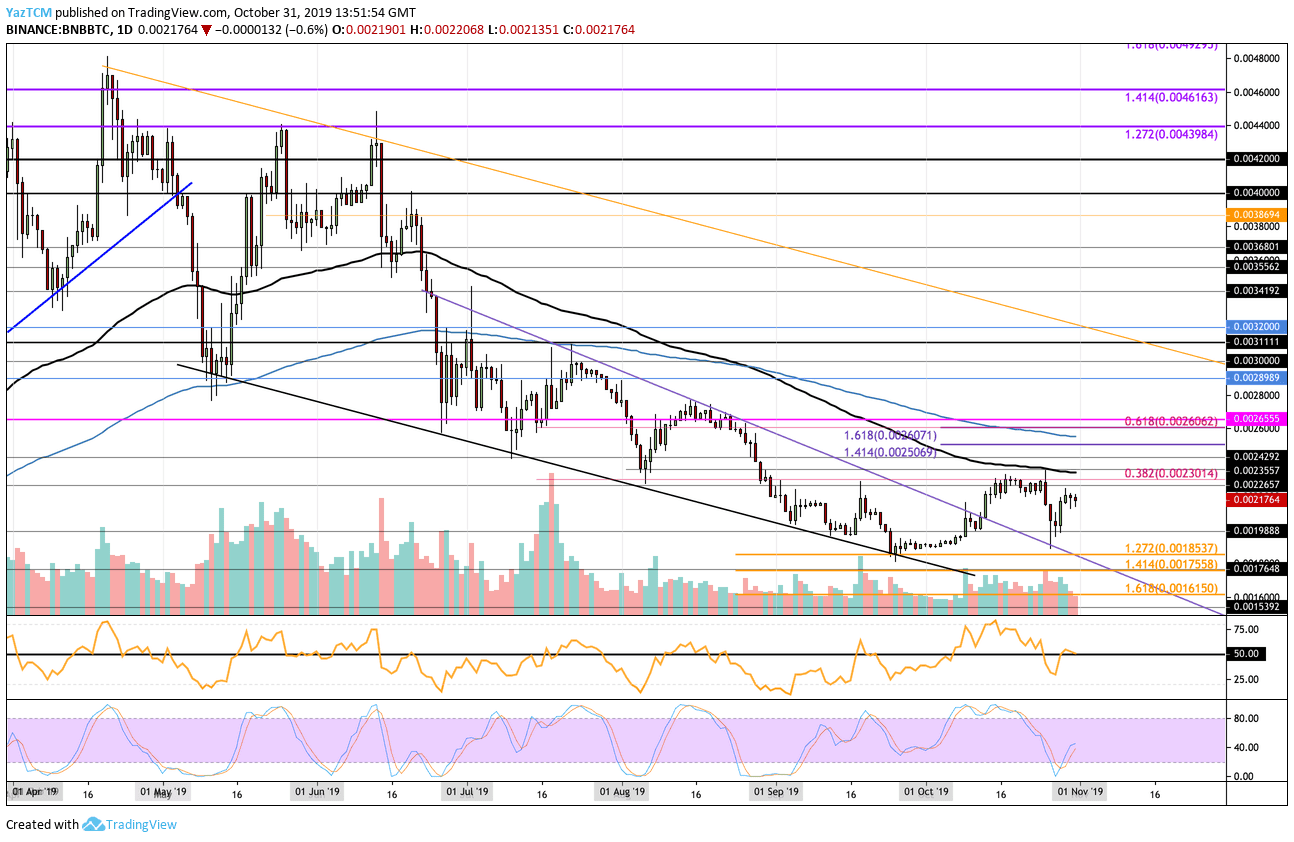
- Against Bitcoin, BNB fell further from the resistance at 0.0023 BTC but managed to find strong support at the 0.001988 BTC region, where we saw a rebound. BNB climbed higher to the current trading price of 0.00217 BTC.
- From above: The nearest level of resistance lies at 0.0023 BTC. Above this, resistance is located at 0.002340 BTC, 0.0025 BTC, 0.002506 BTC (1.414 Fib Extension), 0.002550 (200-days EMA), and 0.002607 BTC (1.618 Fib Extension).
- From below: The nearest levels of support lie at 0.0021 BTC and 0.0020 BTC. Beneath this, support lies at 0.001988 BTC, 0.0019 BTC, 0.001852 BTC, 0.0018 BTC, and 0.001755 BTC.
- The trading volume has also remained very high during October 2019.
- The RSI is battling the 50 level which shows indecision within the market. For a bullish run, we would need to see the RSI rise and climb further from the 50 level.