Summary:
Binance Coin saw a slight increase of around 1% over the past 24 hours and it currently trades at .88. This followed a larger surge in which BNB gained 9.7% over the past week. Binance Coin is the eighth-largest cryptocurrency with a market cap of .66 billion. Despite the recent price hikes, it still has a long road to recovery after dropping by 43% over the past 3 months.Since our previous BNB analysis, the cryptocurrency climbed to as high as before meeting resistance and rolling over. BNB has since dropped to where it currently trades at .68.From above: The nearest levels of resistance lie at and .30. Above this, resistance lies at , .16 and .85 (short term 1.272 Fib Extension). Higher resistance is found at .55 and .93. Above , resistance is
Topics:
Yaz Sheikh considers the following as important: Price Analysis
This could be interesting, too:
CryptoVizArt writes ETH’s Path to K Involves Maintaining This Critical Support (Ethereum Price Analysis)
Duo Nine writes Crypto Price Analysis June-29: ETH, XRP, ADA, DOGE, and DOT
Duo Nine writes Crypto Price Analysis June-15: ETH, XRP, ADA, DOGE, and DOT
Duo Nine writes Why is the Shiba Inu (SHIB) Price Down Today?
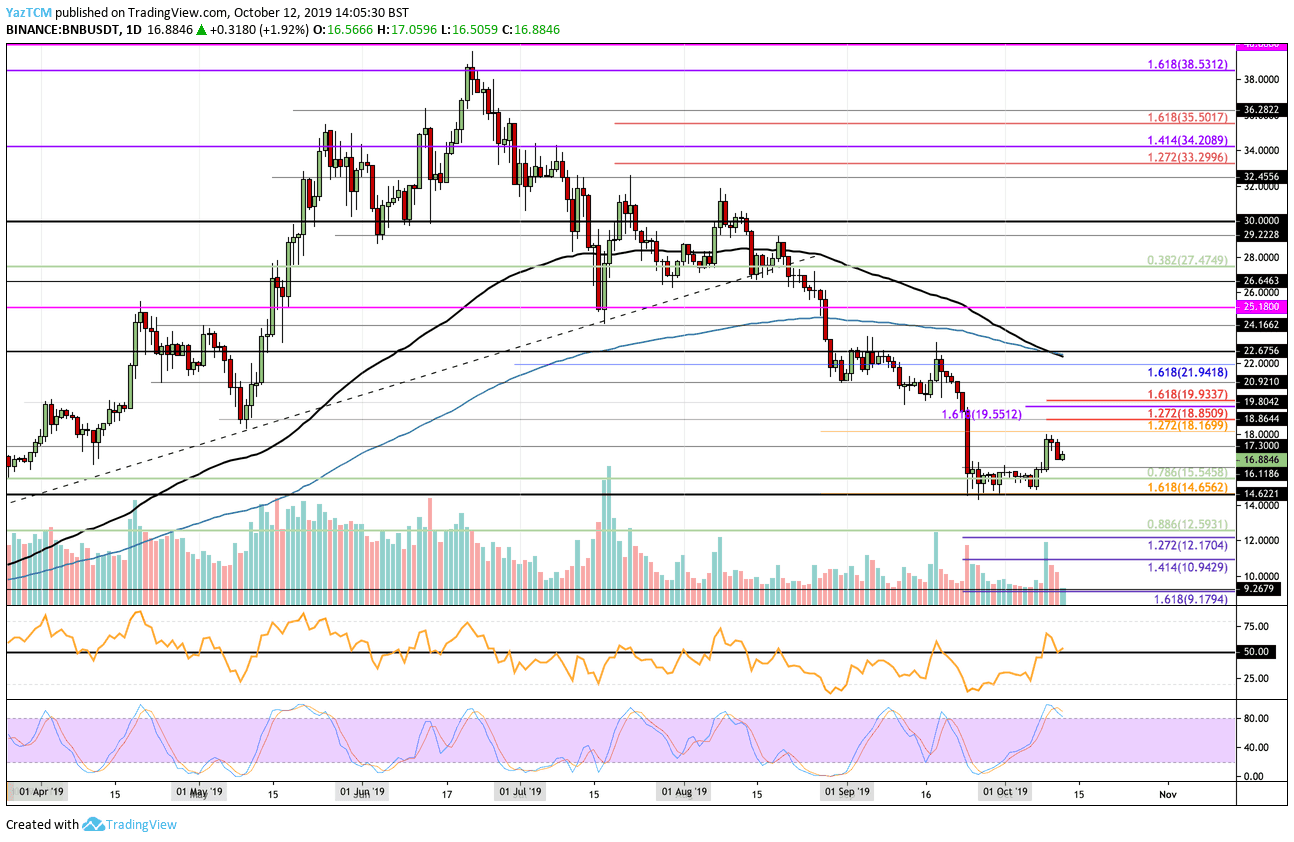
Binance Coin saw a slight increase of around 1% over the past 24 hours and it currently trades at $16.88. This followed a larger surge in which BNB gained 9.7% over the past week.
Binance Coin is the eighth-largest cryptocurrency with a market cap of $2.66 billion. Despite the recent price hikes, it still has a long road to recovery after dropping by 43% over the past 3 months.
- Since our previous BNB analysis, the cryptocurrency climbed to as high as $18 before meeting resistance and rolling over. BNB has since dropped to where it currently trades at $16.68.
- From above: The nearest levels of resistance lie at $17 and $17.30. Above this, resistance lies at $18, $18.16 and $18.85 (short term 1.272 Fib Extension). Higher resistance is found at $19.55 and $19.93. Above $20, resistance is expected at $20.92, $21.94 and $22.
- From below: The nearest level of support lies at $16.11. Beneath $16, support can be found at $15.54 (.786 Fib Retracement) and $14.65. If the sellers pull the price beneath the September low, support is located at $14, $13, and $12.59.
- The trading volume is showing signs that it would like to increase.
- The RSI has rebounded at the 50 level which shows that the bulls are battling to remain in control over the market momentum. However, the Stochastic RSI has produced a bearish crossover signal in overbought conditions that suggest an incoming retracement.
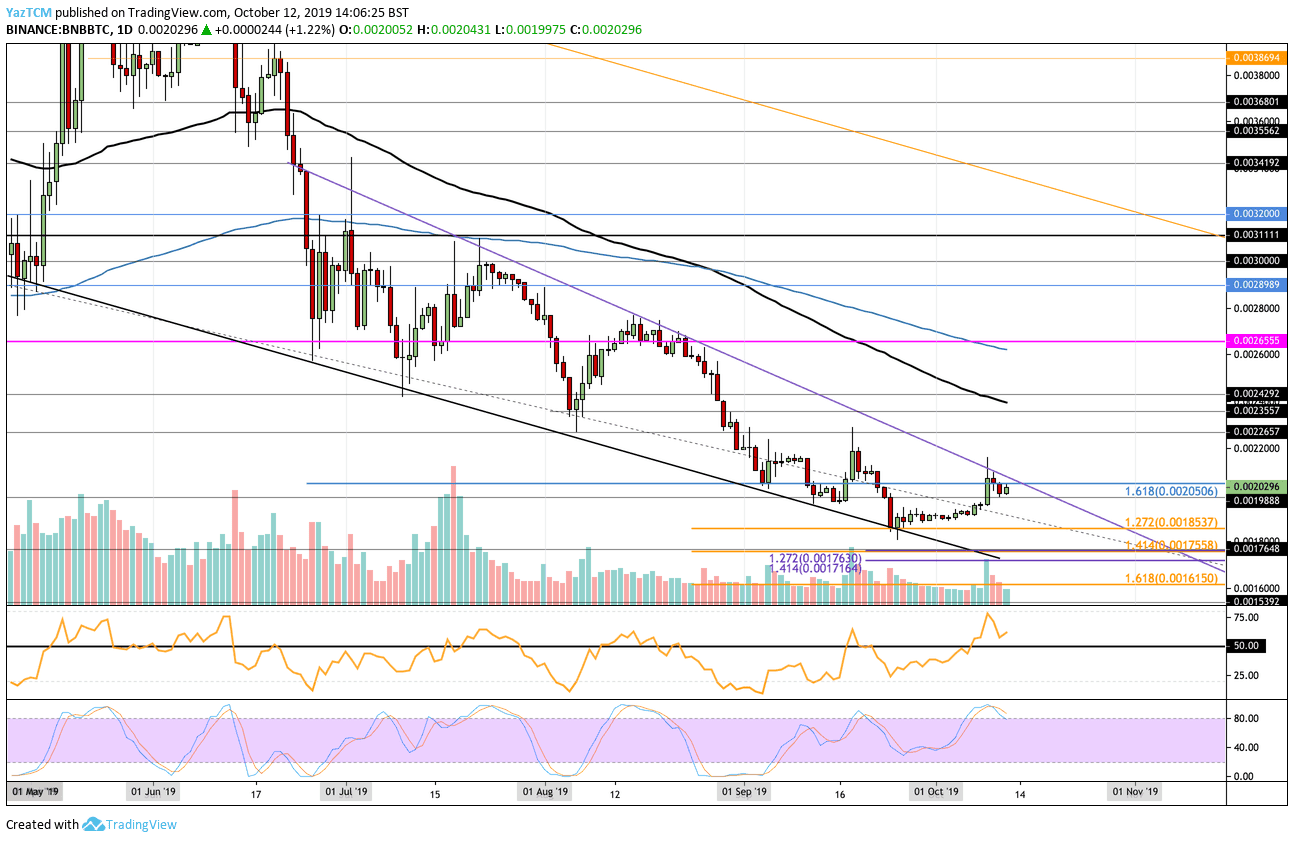
- Against Bitcoin, the upper boundary of the falling wedge turned out to be too strong for the cryptocurrency to break above. BNB has rolled over here to find support at 0.0020 BTC, where it currently trades.
- From above: The nearest level of resistance lies closely at 0.00205 BTC. Above this, resistance is expected at the upper boundary of the falling wedge. Above the wedge, resistance is expected at 0.0021 BTC, 0.0022 BTC, 0.002657 BTC, 0.0023557 BTC, and 0.0024 BTC (100-days EMA).
- From below: The nearest level of support lies at 0.0019888 BTC. Beneath this, support lies at 0.0019 BTC, 0.001853 BTC (September Low-Day Close), and 0.0018 BTC.
- The trading volume remains at an average level.
- The RSI is well above the 50 level which shows that the bulls remain in control over the market momentum. However, the Stocahstic RSI has produced a bearish crossover signal which suggests a potential pullback before traveling higher.