Summary:
TRX saw a small decrease of around 1.44% over the past 24 hours and it currently trades at %excerpt%.019. Despite this, it saw a successful month as the coin managed to surge by a total of 25%TRX remains the eleventh-largest cryptocurrency with a market cap of .28 billion.Looking at the TRX/USD 1-Day Chart:Since our last analysis, TRX surged higher above %excerpt%.0208 but ran into immediate resistance at %excerpt%.02206 which is provided by a long term bearish .382 Fibonacci Retracement level. After reaching this level, TRX rolled over and fell into support at %excerpt%.018723 which is provided by the short term .382 Fib Retracement (drawn in orange) and bolstered by the 100-days EMA.From above: The nearest level of resistance is located directly at %excerpt%.0208, where lies the 200-days EMA. Higher resistance is
Topics:
Yaz Sheikh considers the following as important: Price Analysis, Tron Price, trx
This could be interesting, too:
CryptoVizArt writes ETH’s Path to K Involves Maintaining This Critical Support (Ethereum Price Analysis)
Bhushan Akolkar writes Vitalik Buterin Appreciates Celo Blockchain on Beating Tron, CELO Surge 18%
Steve Muchoki writes Tron Network Registers 52% Rise in Active Addresses YTD, TRX Price Down 2%
Leon Okwatch writes eToro Introduces Staking for Solana and Ethereum
TRX saw a small decrease of around 1.44% over the past 24 hours and it currently trades at $0.019. Despite this, it saw a successful month as the coin managed to surge by a total of 25%
TRX remains the eleventh-largest cryptocurrency with a market cap of $1.28 billion.
Looking at the TRX/USD 1-Day Chart:
- Since our last analysis, TRX surged higher above $0.0208 but ran into immediate resistance at $0.02206 which is provided by a long term bearish .382 Fibonacci Retracement level. After reaching this level, TRX rolled over and fell into support at $0.018723 which is provided by the short term .382 Fib Retracement (drawn in orange) and bolstered by the 100-days EMA.
- From above: The nearest level of resistance is located directly at $0.0208, where lies the 200-days EMA. Higher resistance is expected at $0.02206, $0.023, $0.024, and $0.0252 (bearish .5 Fib Retracement). Following this, resistance is found at $0.026 and $0.02730.
- From below: The nearest level of support lies at $0.0187 (100-days EMA). Beneath this, support is at $0.017977, $0.01739 (.5 Fib Retracement), and $0.01607 $.618 Fib Retracement).
- The trading volume is very low when compared with October’s trading volume.
- The RSi has recently dipped beneath the 50 level which is a bad sign for the bulls. If we would like to see TRX rebound higher from the current support, we would need to see the RSI climb back above 50 to show that the bulls are in charge of the market momentum.

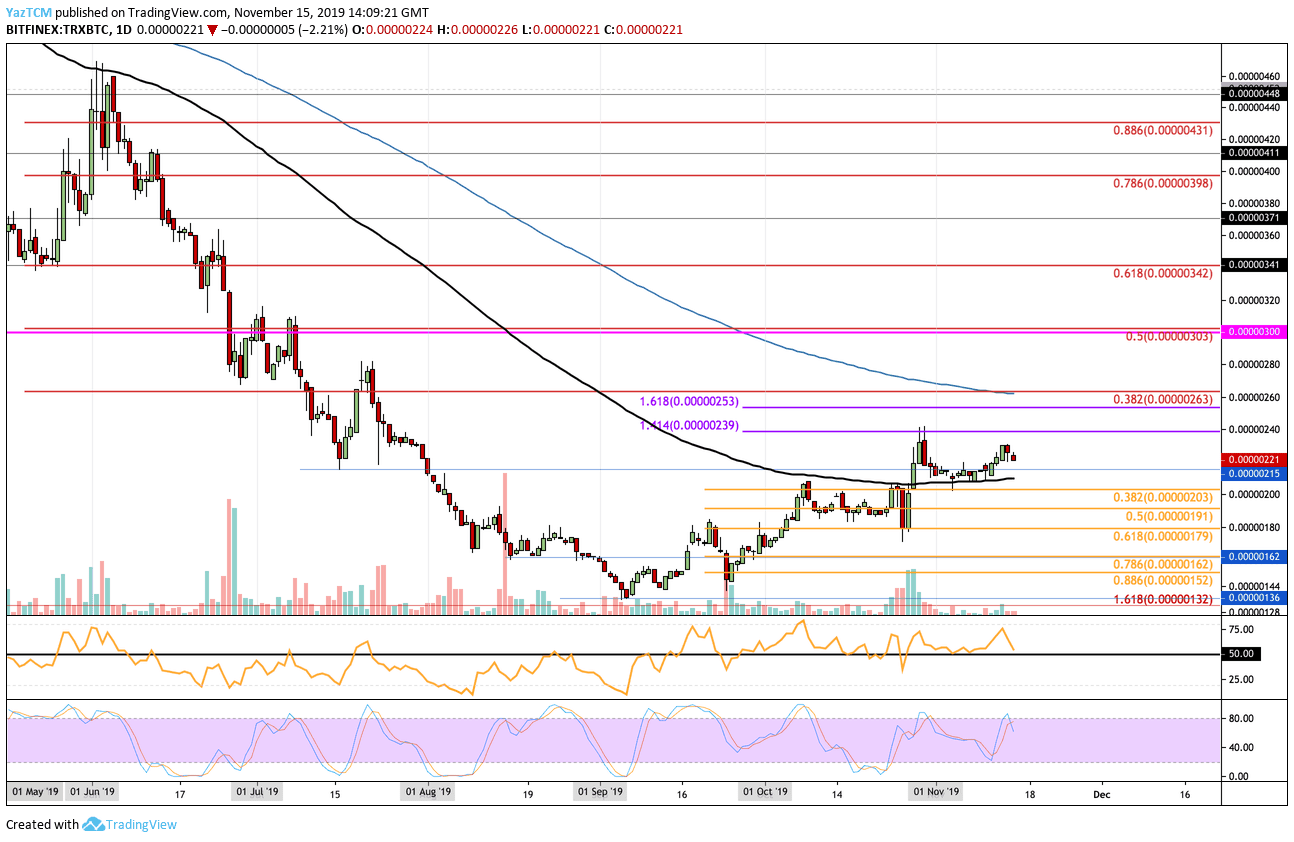
Looking at the TRX/BTC 1-Day Chart:
- Against Bitcoin, TRX climbed higher into the expected resistance at 239 SAT provided by a 1.414 Fibonacci Extension level. It has since dropped but remained supported at the 100-days EMA as it currently trades around 221 SAT.
- From above: The nearest level of resistance lies at the 239 SAT level. Above this, resistance is at 253 SAT (1.618 Fib Extension) and 263 SAT (bearish .382 Fib Retracement and 200-days EMA).
- From below: The nearest level of support lies at 215 SAT. Beneath this, support lies at 210 SAT and 203 SAT (.382 Fib Retracement). If the selling continues beneath 200 SAT, support can be found at 191 SAT (.5 Fib Retracement) and 179 SAT (.618 Fib Retracement).
- The trading volume remains extremely low during November 2019.
- The RSI has recently dipped toward the 50 level which shows that the bulls are losing control over the market momentum.