The S&P 500 lost over 30% in March in a few days of trading. The drop was primarily attributed to the spread of the novel coronavirus (COVID-19) and the effect it had on economies. The index has since recovered and gained more than 500 basis points but is still a long way to go. Now, however, the Bank of America says that the S&P 500 can mark new lows if the current volatility continues for much longer. Volatility Spells Trouble For The S&P 500 According to a recent report, a team of analysts from the Bank of America Corp. believes that the S&P 500 could reach new lows if the Volatility Index pattern holds. The experts say that the S&P 500 has been tracking the bear market rally of 2008-09 since its VIX peak on March 16th. Data shows that during the previous bear cycles from 1987, 2002,
Topics:
George Georgiev considers the following as important: AA News, bank of america, s&p 500, United States
This could be interesting, too:
Chayanika Deka writes Yuga Labs Secures Major Win as SEC Closes Investigation Without Charges
Andrew Throuvalas writes Bitcoin Soars Back To ,000 After BlackRock CEO Says “Buy The Dip”
Chayanika Deka writes XRP, SOL, and ADA Inclusion in US Crypto Reserve Pushes Traders on Edge
Chayanika Deka writes Why Arthur Hayes Is Bullish on Bitcoin Under Trump’s Economic Strategy
The S&P 500 lost over 30% in March in a few days of trading. The drop was primarily attributed to the spread of the novel coronavirus (COVID-19) and the effect it had on economies. The index has since recovered and gained more than 500 basis points but is still a long way to go.
Now, however, the Bank of America says that the S&P 500 can mark new lows if the current volatility continues for much longer.
Volatility Spells Trouble For The S&P 500
According to a recent report, a team of analysts from the Bank of America Corp. believes that the S&P 500 could reach new lows if the Volatility Index pattern holds.
The experts say that the S&P 500 has been tracking the bear market rally of 2008-09 since its VIX peak on March 16th. Data shows that during the previous bear cycles from 1987, 2002, and 2008, it took between one and a half and four months from the VIX peak for the S&P 500 to bottom. During these times, the S&P increased from 15% to 25% before falling again.
If the pattern holds, the S&P should see its current top at around 2,960 before falling below the lows from mid-March.
The team also recommends selling volatility puts on the belief that markets are currently pricing in a recovery path that is too optimistic.
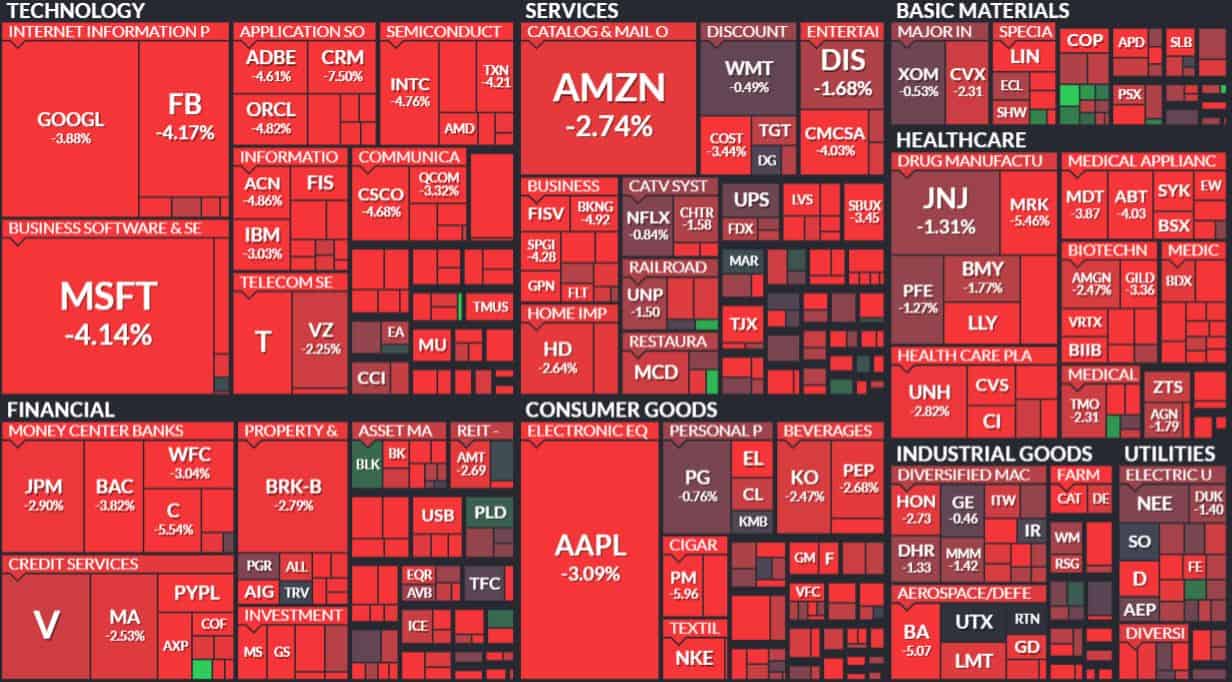
It’s a Sea Of Red For The S&P 500
Indeed, things aren’t looking great for the companies part of the index. Over the past 24 hours, almost every stock comprising the S&P 500 is trading in the red, with some such as Google, Facebook, and Microsoft marking declines of around 4%.
The index closed yesterday’s trading session losing 86.6 basis points or about 3% of its value. However, at the time of this writing, futures are looking more promises, charting an increase of about 1%.
It’s entirely possible that the markets were moved and shaken by the devastating drops in the price of oil. As CryptoPotato reported yesterday, oil was trading in the negative for the first time in history.