XRP/USD – Bulls Attempting To Recover Above November 2020 LowsKey Support Levels: %excerpt%.2, %excerpt%.171, %excerpt%.14.Key Resistance Levels: %excerpt%.254, %excerpt%.3, %excerpt%.325.A couple of days ago, XRP spiked beneath %excerpt%.2 to hit the July 2020 lows at %excerpt%.171. By the end of the day, the buyers regrouped to allow the daily candle to close above the November 2020 lows at %excerpt%.219.Yesterday, XRP penetrated beneath the November 2020 lows. Its daily candle eventually closed at %excerpt%.21. Today, after a brief spike back into %excerpt%.2, the buyers are attempting to bring XRP back up.XRP/USD Daily Chart. Source: TradingViewXRP-USD Short Term Price PredictionLooking ahead, if the bulls can close above %excerpt%.22, the first level of resistance lies at %excerpt%.254. This is followed by %excerpt%.3, %excerpt%.325 (200-days EMA), and %excerpt%.35 (Feb 2020 highs).On the other
Topics:
Yaz Sheikh considers the following as important: Ripple (XRP) Price, XRP Analysis, xrpbtc, xrpusd
This could be interesting, too:
Dimitar Dzhondzhorov writes Is a Major Ripple v. SEC Lawsuit Development Expected This Week? Here’s Why
Mandy Williams writes Ripple Releases Institutional DeFi Roadmap for XRP Ledger in 2025
Dimitar Dzhondzhorov writes Ripple Whales Go on a Selling Spree: Is XRP Headed for a Further Correction?
Jordan Lyanchev writes ChatGPT and DeepSeek Analyze Ripple’s (XRP) Price Potential for 2025
XRP/USD – Bulls Attempting To Recover Above November 2020 Lows
Key Support Levels: $0.2, $0.171, $0.14.
Key Resistance Levels: $0.254, $0.3, $0.325.
A couple of days ago, XRP spiked beneath $0.2 to hit the July 2020 lows at $0.171. By the end of the day, the buyers regrouped to allow the daily candle to close above the November 2020 lows at $0.219.
Yesterday, XRP penetrated beneath the November 2020 lows. Its daily candle eventually closed at $0.21. Today, after a brief spike back into $0.2, the buyers are attempting to bring XRP back up.
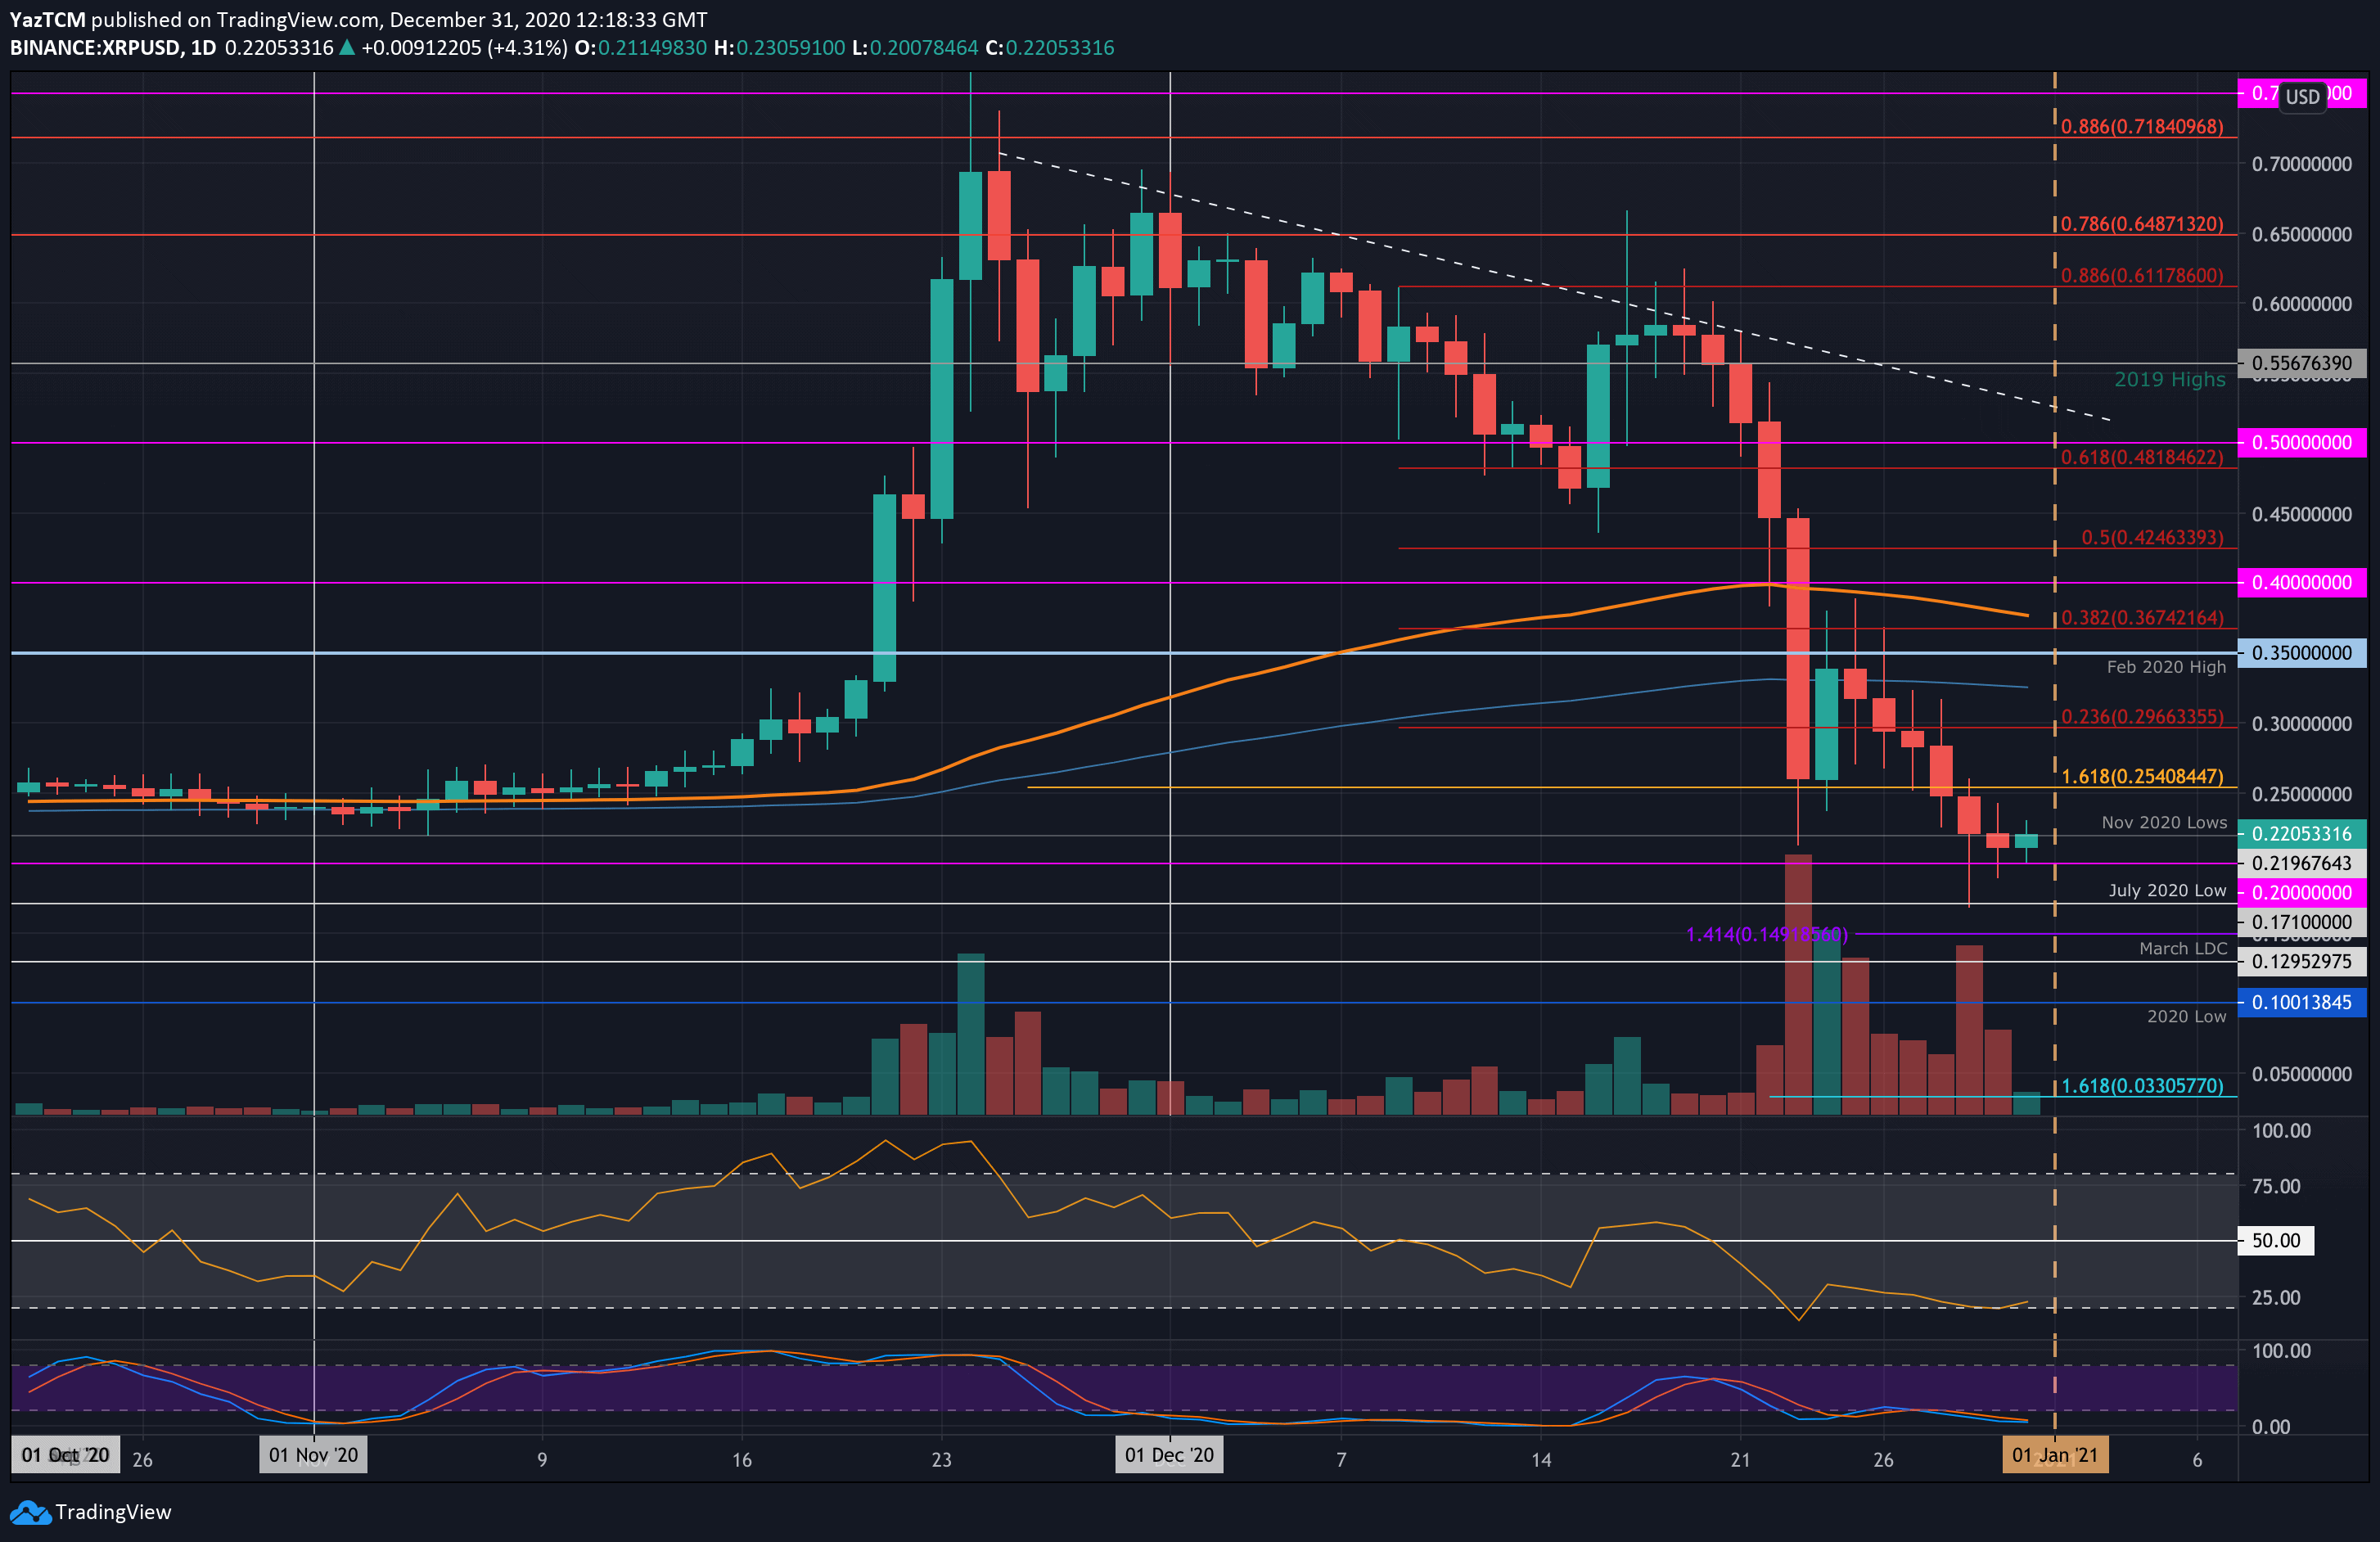
XRP-USD Short Term Price Prediction
Looking ahead, if the bulls can close above $0.22, the first level of resistance lies at $0.254. This is followed by $0.3, $0.325 (200-days EMA), and $0.35 (Feb 2020 highs).
On the other side, the first level of support lies at $0.2. This is followed by $0.171 (July 2020 lows), $0.15, and $0.129 (March low-day closing price).
The RSI rebounded from extremely oversold conditions, and if it can continue to rise, it will indicate the bearish momentum is finally fading. Additionally, the Stochastic RSI is primed for a bullish crossover.
XRP/BTC – Bulls Rebound Back Above 700 SAT
Key Support Levels: 695 SAT, 591 SAT, 500 SAT.
Key Resistance Levels: 800 SAT, 1000 SAT, 1200 SAT.
Earlier this week, XRP fell beneath the 1000 SAT support against Bitcoin as the capitulation continued. It proceeded to fall beneath 800 SAT yesterday to hit the support at 695 SAT (downside 1.414 Fib Extension).
Today, the bulls are attempting to rebound from 695 SAT as they currently trade at 758 SAT.
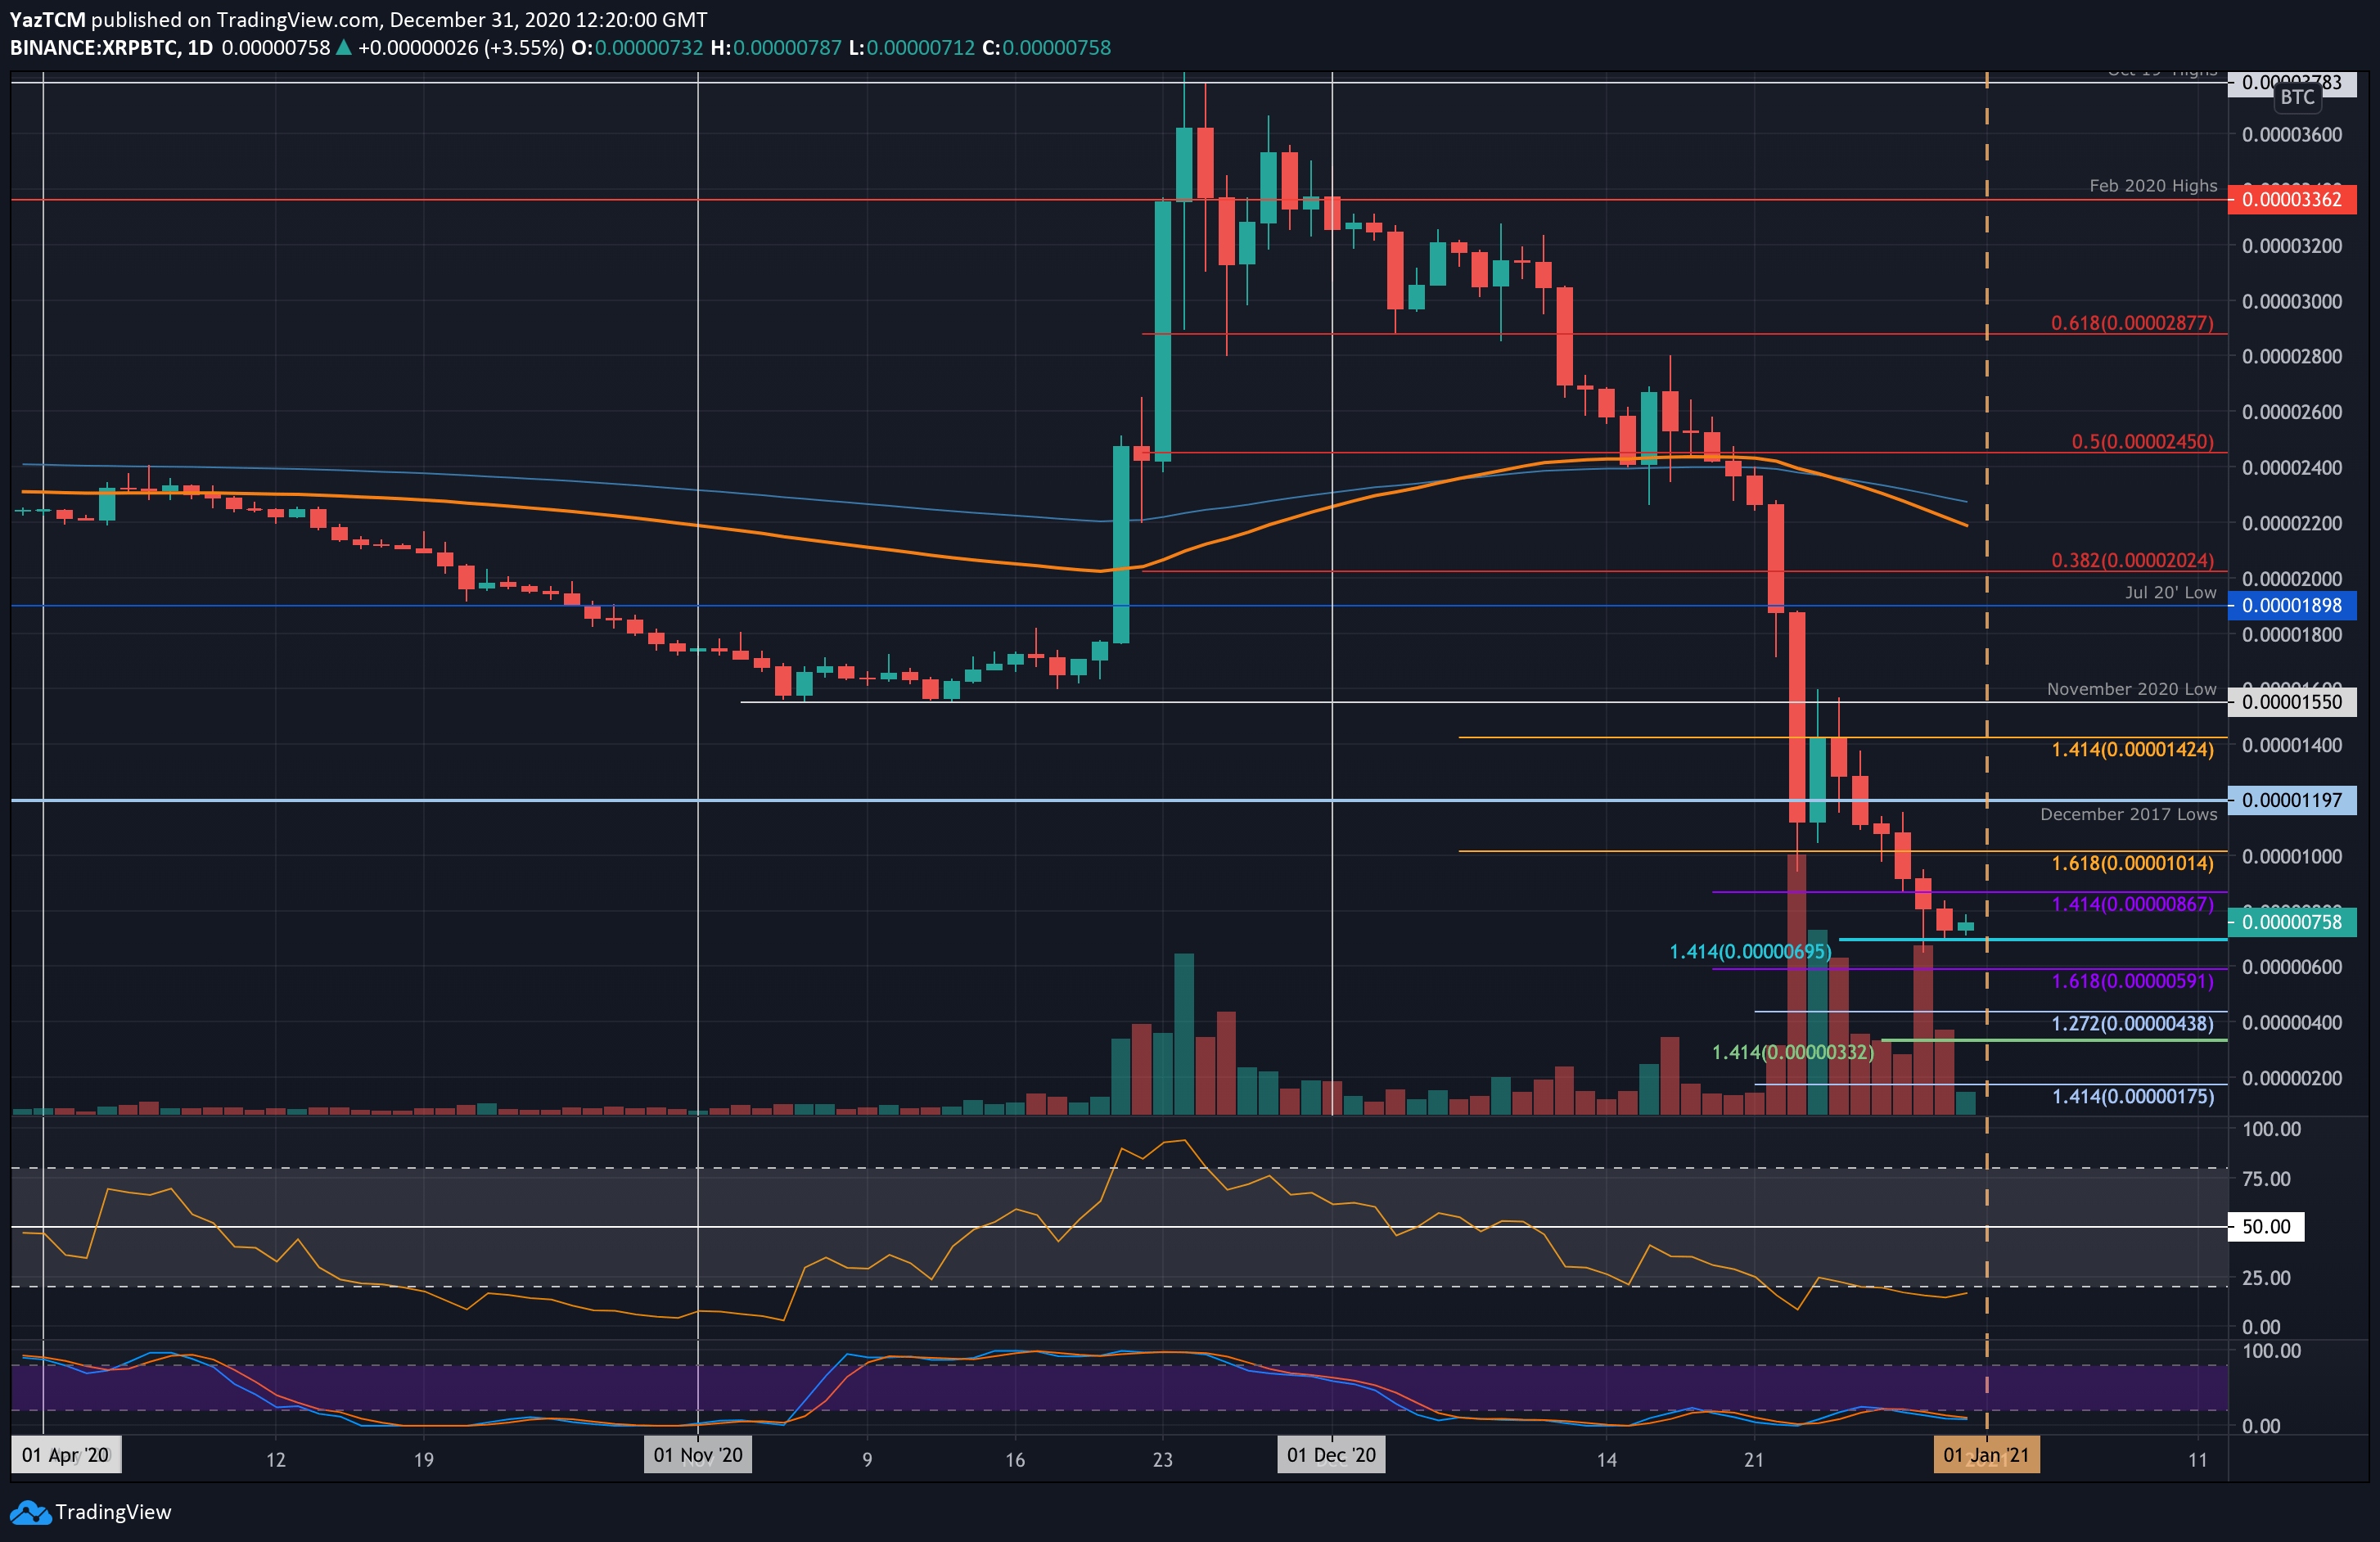
XRP-BTC Short Term Price Prediction
Looking ahead, if the buyers can continue with the rebound, the first level of resistance lies at 800 SAT. This is followed by 1000 SAT, 1200 SAT (December 2017 lows), and 1425 SAT.
On the other side, the first level of support lies at 695 SAT. This is followed by 591 SAT, 500 SAT, and 438 SAT.
Likewise, the RSI remains extremely oversold, suggesting that the sellers might be a little overextended.