Key Support levels: Key Resistance level: .2 Unfortunately, the bulls were unable to sustain the XRP price above .2, and it was pushed lower towards the support level at during today’s market downturn. For this reason, the previous support at .2 has turned into resistance. remains a strong level, and it would be quite surprising to see the price close below it in the near term. Chart by TradingViewTechnical Indicators Trading Volume: Volume increased on this drop to the support level. This shows the bears are in control of the price action, but it seems unlikely they can push XRP below as the bulls have defended this level quite well in the past. RSI: Due to this most recent drop in price, the RSI has taken a nosedive, particularly on the 4-hour
Topics:
Duo Nine considers the following as important: Ripple (XRP) Price, XRP Analysis, xrpbtc, xrpusd
This could be interesting, too:
CryptoVizArt writes Ripple Price Analysis: How Low Can XRP Go if it Loses the %related_posts%.5 Support?
Dimitar Dzhondzhorov writes Ripple’s Larsen Explains Why He Donated M Worth of XRP to Harris’ Presidential Campaign
Dimitar Dzhondzhorov writes The Ripple v. SEC Case Resembles Moby Dick: The Company’s CLO Explains Why
Dimitar Dzhondzhorov writes Can the XRP Price Hit When Ripple’s Stablecoin Goes Live? (ChatGPT Analyzes)
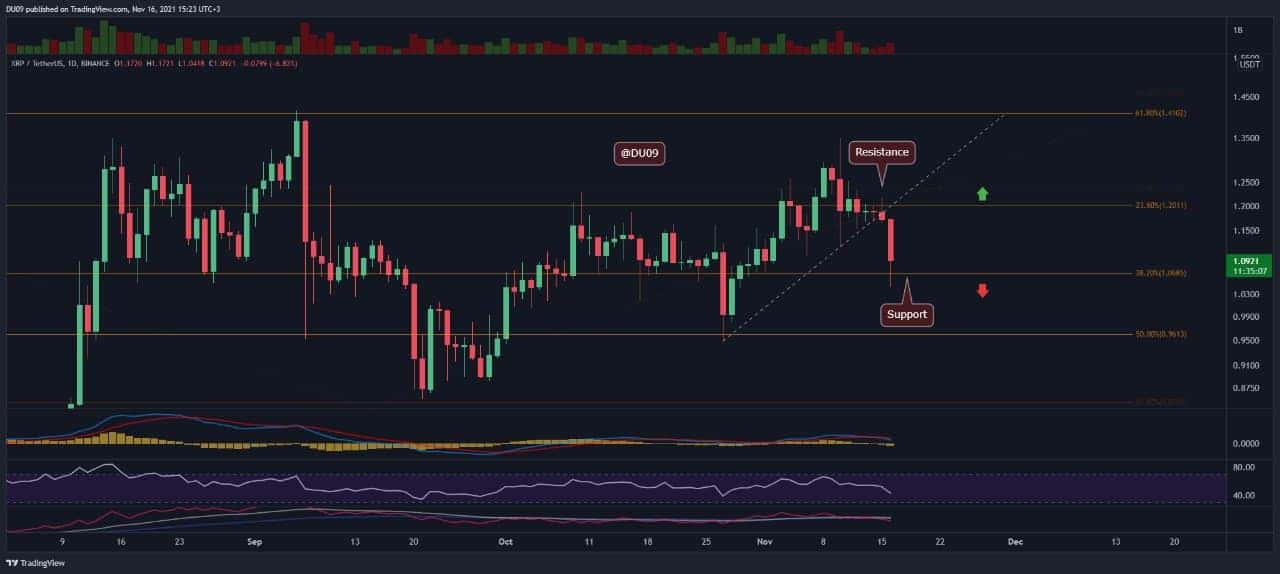
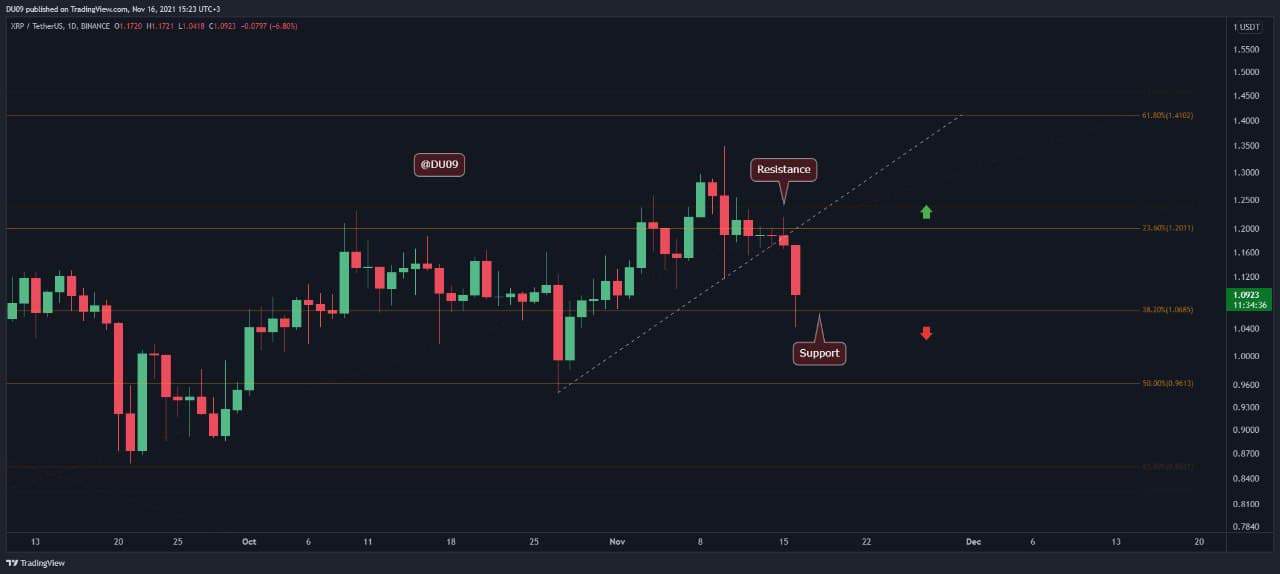
Key Support levels: $1
Key Resistance level: $1.2
Unfortunately, the bulls were unable to sustain the XRP price above $1.2, and it was pushed lower towards the support level at $1 during today’s market downturn. For this reason, the previous support at $1.2 has turned into resistance. $1 remains a strong level, and it would be quite surprising to see the price close below it in the near term.
Technical Indicators
Trading Volume: Volume increased on this drop to the $1 support level. This shows the bears are in control of the price action, but it seems unlikely they can push XRP below $1 as the bulls have defended this level quite well in the past.
RSI: Due to this most recent drop in price, the RSI has taken a nosedive, particularly on the 4-hour timeframe where it has reached the oversold zone, which lies under 30 points. This is bearish.
MACD: Unfortunately, the MACD on the daily timeframe completed a bearish cross two days ago, and today’s cras intensified the drop of the moving averages. Until the histogram makes a higher low, the bias remains bearish.
Bias
The bias is bearish on XRP due to this most recent drop and the fact that the price fell under $1.2. XRP may consolidate around $1 in the near term unless the bears try another push under $1.
Short-Term Prediction for XRP Price
Since the uptrend from last week was reversed, at this time, the best-case scenario for XRP is to hold above $1. A drop below this key support level appears unlikely, but it is too early to be certain as the bears may attempt another push lower, depending on the market conditions.