With buyers absent, BNB is struggling to hold above $200.
Key Support levels: $206, $180
Key Resistance levels: $220, $230
1. Indecision Continues
Binance Coin has not managed to move away from its key support just above $200. This is not ideal, as any new sell pressure could quickly test or even break this level. The price action also shows that sellers are having the upper hand right now.
Chart by TradingView.2. Indicators Lean Bearish
The volume and momentum indicators show weakness and are bearish on the daily timeframe. Generally speaking, volume was always higher on the sell side and this is reflected both on the RSI and OBV which remain low.
Chart by TradingView.3. MACD Bearish Cross
The daily MACD just did a bearish cross, further confirming that sellers appear to
Articles by Duo Nine
Crypto Price Analysis Sep-22: ETH, XRP, ADA, SOL, and BNB
September 22, 2023This week, we take a closer look at Ethereum, Ripple, Cardano, Solana, and Binance Coin.
Ethereum (ETH)
Since June, Ethereum has formed a large ascending triangle. However, yesterday, the price fell under this formation and closed the week with a 2% loss. This puts ETH in a difficult position as it signals this correction may just be starting.
There is good support at $1,440 and ETH may test this level before any sustained recover can be had. So far, the price action remains bearish and the resistance at $1,660 continues to hold strong.
Looking ahead, ETH is in a downtrend and this latest breakdown puts sellers in charge with little hope of a reversal at this time.
Chart by TradingView.Ripple (XRP)
XRP has been consolidating since mid-August and has closed the week with a
What’s Next for SHIB Following 22% Weekly Disaster? 3 Things to Watch This Week (Shiba Inu Price Analysis)
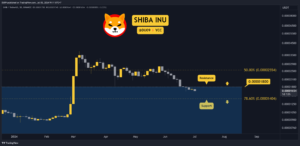
August 21, 2023SHIB bounced, but failed to move above the key resistance.
Key Support levels: $0.0000080, $0.0000070
Key Resistance levels: $0.0000085, $0.000010
1. Rejection at Key Resistance
The price found support at $0.0000080 and tried to move higher but was quickly rejected once reaching the resistance at $0.0000085. Since then, the cryptocurrency fell back on the key support, which is now put under pressure again.
Chart by TradingView2. Sellers Dominate
In the past nine days, sellers managed to close eight daily candles in red. This shows that bears are dominating the chart right now, but in the past three days, the selling volume has been declining. This could be indicative that SHIB has reached a local bottom.
Chart by TradingView3. Bearish Bias Continues
While the intensity of
Can SHIB Explode Higher? Here’s What You Need to Know (Shiba Inu Price Analysis)
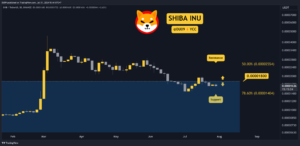
August 2, 2023Shiba Inu is in a clear uptrend, and momentum still favors bulls.
Key Support levels: $0.0000080
Key Resistance levels: $0.0000094
1. Clear Higher Highs
The price has been making higher highs since late June, and SHIB has not stopped since. This puts the price in a clear uptrend which could take SHIB to the key resistance at $0.0000094.
However, in the process, this meme coin also appears to have formed a bearish wedge which could see the price break under it once the key resistance is hit.
Chart by TradingView2. Sustained Buy Volume
Despite regular pullbacks, buyers continue to dominate the chart. This is also represented in the price that has slowly moved higher every week. Buyers appear to rush in whenever SHIB breaches a key resistance pushing the price higher in a
Crypto Price Analysis July-21: ETH, XRP, ADA, SOL, and MATIC
July 21, 2023This week, we take a closer look at Ethereum, Ripple, Cardano, Solana, and Polygon.
Ethereum (ETH)
Ethereum has shown indecision in the past week. This allowed sellers to take over the price action, which ended the week with a 5% loss. Despite this correction, the cryptocurrency remains above the key support at $1,820.
The current resistance is found at $2,000. ETH tried several times to turn this key level into support, but buyers were not strong enough, and the price fell under it every time.
Looking ahead, ETH seems likely to continue to range above the key support until the market forces push for a breakout. Considering that bears have the upper hand right now, do not exclude a possible test of the key support at $1,820.
Chart by TradingViewRipple (XRP)
XRP has managed
Crypto Price Analysis July-14: ETH, XRP, ADA, BNB, and SOL
July 14, 2023This week, we take a closer look at Ethereum, Ripple, Cardano, Binance Coin, and Solana.
Ethereum (ETH)
The market turned bullish yesterday, and Ethereum broke above $2,000. This allowed it to book a respectable 7% price increase this week. The momentum is bullish, and continuation seems likely.
The current resistance is found at $2,120 and represents a local high achieved in April which is also the last time ETH broke above $2,000. A second attempt to break this key level could be successful if buyers manage to sustain and increase the momentum here.
Looking ahead, ETH’s price is expected to at least test the key resistance. If sellers won’t hold down the price there, then it could escape and move towards $2,500 next.
Chart by TradingViewRipple (XRP)
XRP has been the
ADA Plummets 7% Weekly, Here’s How Low it Could Go (ADA Price Analysis)
June 19, 2023With volatility declining, buyers may soon have an opportunity to stop the downtrend.
Key Support levels: $0.24
Key Resistance levels: $0.29
The weekly price for ADA shows a 7% loss. However, sellers appear to have lost interest since the crash on June 10th and have failed to take the price lower. With good support at 24 cents, bulls may have an opportunity to push ADA higher in the coming days.
Chart by TradingViewTrading Volume: The volume crashed in the past few days. It appears that sellers don’t have the strength to continue the downtrend right now. This provides an opportunity for a reversal.
RSI: The daily RSI is in the oversold area of under 30 points since June 9th. While this is bearish, it could also mean that ADA may soon leave this area to attempt a breakout.
Analysis of This Week’s Worst Performers: LDO, ADA, APT, SOL, and MATIC
June 15, 2023This week, we take a closer look at the worst performing altcoins with a market cap of over $1 billion: Lido, Cardano, Aptos, Solana, and Polygon.
Lido (LDO) | -24.8%
LDO is the worst performer on our list this week after falling by almost 25%. Buyers failed to sustain the uptrend and with the support at $2 lost, the price was quick to crash.
At the time of this post, the most significant support level is found at $1.4 and the resistance is at $1.8. Considering the market sentiment, the price is unlikely to change its current momentum which is bearish.
Looking ahead, Lido appears to continue its correction that started in February. With lower lows and lower highs, the bears have the upper hand and they may not stop their assault until the price reaches the key support
Crypto Price Analysis Jun-9: XRP, ADA, BNB, SOL, and MATIC
June 9, 2023This week, we take a closer look at Ripple, Cardano, Binance Coin, Solana, and Polygon.
Ripple (XRP)
Ripple continues to surprise the market with its strength, considering that in the past week, most altcoins ended up in red. More so, XRP has managed to close in green with a 2.6% increase in price, making it the best performer on our list today.
This resilience has taken the price just under the key resistance at 53 cents. Volatility also increased this week, and buyers already attempted to break higher but were pushed back by bears.
Looking ahead, XRP seems well-positioned to break the key resistance since the momentum is firmly on the buyer’s side. The indicators on the daily timeframe are also bullish, and another push higher could turn the 53 cents level into support.
PEPE Price Analysis: This is What Needs to Happen for PEPE to Target Critical Resistance
May 29, 2023PEPE continues to range as market participants are waiting for something to happen.
Key Support levels: $0.0000013, $0.0000011
Key Resistance levels: $0.0000020
PEPE’s volatility is extremely low right now with the price unable to make any significant moves. It appears that both sellers and buyers are exhausted or absent from the market. PEPE has support at $0.0000013, and if broken the price could go to $0.0000011 next. The resistance is at $0.0000020, and so far, bulls failed to surpass it.
Chart by TradingViewTrading Volume: The volume almost disappeared from the chart. This has led to low volatility.
RSI: The daily RSI is somewhat flat but may turn bearish if bulls can’t sustain the price at the current support.
MACD: The daily MACD is bearish. However, considering
Crypto Price Analysis May-26: ETH, XRP, ADA, TRX, and LTC
May 26, 2023This week, we take a closer look at Ethereum, Ripple, Cardano, Tron, and Litecoin.
Ethereum (ETH)
Ethereum’s volatility increased this past week but failed to break above the key resistance at $1,820. For this reason, the price is at a similar point to last week.
This consolidation under the key resistance is unlikely to last, and bulls appear eager to break away. On Tuesday, buyers briefly took the price over the key level, but sellers were quick to reverse the price action back under $1,820.
Looking ahead, bulls could take ETH into a renewed rally next week and turn the current resistance into support. If successful, this cryptocurrency will turn bullish and rally to $1,900 and $2,000 next.
Chart by TradingViewRipple (XRP)
XRP found strong resistance at 47 cents and was
Cardano Due for a Price Explosion? Consolidation at $0.36 Tightens (ADA Price Analysis)
May 22, 2023With the price consolidating under the key resistance, ADA may attempt a breakout.
Key Support levels: $0.36, $0.34
Key Resistance levels: $0.38, $0.40
The price has formed a double bottom with good support at 36 cents. As long as this key level holds, bulls have a good chance to take ADA’s price to the resistance at 38 cents. A breakout above it would confirm the end of this correction that started in April.
Chart by TradingViewTrading Volume: The volume continues to be low, and momentum has yet to return for bulls.
RSI: The daily RSI is making higher lows which gives hopes of a reversal soon.
MACD: The daily MACD did a bullish cross today, and if buyers return, it could signal the start of an uptrend.
Chart by TradingViewBias
The bias for ADA is neutral.
Short-Term
PEPE Bounced 40% Off the Weekend Lows, But Is Another Crash Incoiming? (PEPE Price Analysis)
May 16, 2023PEPE managed to find support and buyers were quick to jump in over the weekend.
Key Support levels: $0.0000011
Key Resistance levels: $0.0000020
This meme coin managed to rally and double in price between Friday and Saturday, but it was not enough to break the key resistance at $0.0000020. Sellers came in strong and stopped the rally. In the process, the price made a lower high which is a bearish signal. The current support is at $0.0000011.
Chart by TradingViewTrading Volume: The volume increased over the weekend, but this quickly faded as of Tuesday. Buyers could not sustain the rally.
RSI: The 12h RSI made a lower high and is again under 50 points. This is bearish.
MACD: The 12h MACD is bearish, but the histogram is making higher lows. This shows that sellers have lost
Crypto Price Analysis May-12: ETH, XRP, ADA, PEPE, and DOGE
May 12, 2023This week, we take a closer look at Ethereum, Ripple, Cardano, Pepe, and Dogecoin.
Ethereum (ETH)
With the market in the red, Ethereum has fallen by 7.4% this week. In the process, the key level at $1,800 has turned into a resistance. This highlights a major change in the structure and puts bears in control of the price action.
The momentum has turned bearish, and a test of the key support at $1,660 appears likely in the coming week. This becomes increasingly so if Bitcoin continues with its correction.
Looking ahead, if the key support at $1,660 holds, Ethereum might maintain its macro uptrend (higher lows). If not, then bulls will be put in a very difficult position, as that would open the path for this cryptocurrency to revisit levels not seen since March 2023 (under
Crypto Price Analysis May-5: ETH, XRP, ADA, PEPE, TRX
May 5, 2023This week, we take a closer look at Ethereum, Ripple, Cardano, Pepe, and Tron.
Ethereum (ETH)
This week, Ethereum has retested the support at $1,800. Buyers showed strength and did not allow the price to fall lower, which is why ETH is found at a similar level to last week due to low volatility.
The current target for this cryptocurrency is $2,000, which is also a key psychological level. In April, ETH managed to break above it but quickly lost ground once sellers took over the price action. Another break above $2,000 would be quite bullish, but momentum is lacking at this time.
Looking ahead, Ethereum has found a good foundation to gather strength in the coming week. If buyers return to the market, then a retest of the key resistance appears imminent.
Chart by
DOGE Crashes 20% in Three Days, How Low Can It Go? (Dogecoin Price Analysis)
April 10, 2023With DOGE buyers out of steam, the price fell and is now approaching the key support.
Key Support levels: $0.07
Key Resistance levels: $0.11
After a significant spike in the price, bulls failed to run it higher, and it lost 20% of its valuation in the last three days. This puts DOGE on a clear path to retest the key support at 7 cents. If it holds, buyers could attempt to reverse the current bearish momentum. The resistance continues to hold strong at 11 cents.
Chart by TradingViewTrading Volume: The selling volume exceeded the buying volume after the spike in price, which explains why bears have the upper hand right now.
RSI: The daily RSI is just above 50 points. Should bulls manage to keep it there, then they could take control of the price action.
MACD: The daily MACD
Crypto Price Analysis Apr-7: ETH, XRP, ADA, BNB, SOL
April 7, 2023This week, we take a closer look at Ethereum, Ripple, Cardano, Binance Coin, and Solana.
Ethereum (ETH)
Ethereum continued to move up this week and managed to book a 3.5% price increase. In the process, ETH broke the key resistance at $1,800, which is now acting as support.
The next resistance is found at $2,000, and it represents a major psychological level that will likely attract sellers and profit-takers. Momentum continues to favor buyers at this time, but it’s best to be careful, considering the key resistance is not far away.
Looking ahead, even if Ethereum manages to maintain its rally, it would be surprising to see the price move above $2,000 on a first try. The more likely scenario is that a pullback will follow instead.
Chart by TradingViewRipple (XRP)
XRP’s
DOGE Cools Off Following Twitter Hype, Tumbles 9% Daily? (Dogecoin Price Analysis)
April 6, 2023After Twitter changed its logo to Dogecoin’s, the price spiked 36%, but it still remains under a key resistance.
Key Support levels: $0.07
Key Resistance levels: $0.11
Elon Musk did not disappoint and kept his promise to change the logo of Twitter should he acquire it. Doge rallied hard on this news, but not as much as expected, with the price yet to break the resistance at 11 cents. Elon will have to do more for that. The key support is at 7 cents.
Chart by TradingViewTrading Volume: The buying volume exploded on Twitter news, but since then, sellers have dominated, placing DOGE into a correction.
RSI: The daily RSI was briefly overbought and has corrected since. So long it remains above 50 points, the bias is bullish.
MACD: The daily MACD is bullish, but the histogram is
Crypto Price Analysis Mar-31: ETH, XRP, ADA, SOL, LTC
March 31, 2023This week, we take a closer look at Ethereum, Ripple, Cardano, Solana, and Litecoin.
Ethereum (ETH)
Ethereum decided to range this week and booked a slight loss of 1.4%. This flat trend could not muster the energy to hold the price above $1,800, which is the current key resistance.
The support is at $1,700, and bulls have done a good job defending this level to date. Therefore, any pullback should find buyers here if the price falls again.
Looking ahead, ETH has lost some of its momentum, with the buying volume steadily decreasing since mid-March. If this does not reverse soon, then the cryptocurrency will lack the strength to push higher at this time and may even enter a correction.
Chart by TradingViewRipple (XRP)
If Ethereum is still deciding where to go next, this is
Crypto Price Analysis Mar-17: ETH, XRP, ADA, BNB, DOT
March 17, 2023This week, we take a closer look at Ethereum, Ripple, Cardano, Binance Coin, and Polkadot.
Ethereum (ETH)
This week, the market sentiment completely shifted, with bulls taking full control of the price action. ETH rallied by 21%, making it the best performer on our list. This spectacular rally allowed it to break above the key resistance at $1,660, which has now turned into support.
With the uptrend in full swing, this cryptocurrency can reach $2,000, which is a key psychological level. The momentum indicators are bullish, and there is no sign of exhaustion yet.
Looking ahead, it seems likely that ETH could move higher and test the key resistance levels found at $1,800 and $2,000. Sellers already paid an expensive price trying to short the market, and for this reason, they
ADA Surges 15% Off Critical Support, Here’s the Next Target (Cardano Price Analysis)
March 15, 2023As soon as the bears reached the key support, they completely lost control of the price action.
Key Support levels: $0.30
Key Resistance levels: $0.35, $0.38
ADA finally found good support at 30 cents from where the bulls managed to turn the momentum in their favor. The price quickly rallied to hit the resistance at 35 cents. This show of strength has turned the chart bullish, which could see ADA move higher later this week.
Chart by TradingViewTrading Volume: The explosive buying volume reversed the downtrend abruptly. This is bullish.
RSI: The daily RSI touched the mid-level at 50 points. Buyers need to keep the pressure up to protect their most recent gains.
MACD: The daily MACD completed a bullish cross yesterday. This is a significant change in the momentum and may
Crypto Price Analysis Mar-10: ETH, XRP, ADA, DOGE, MATIC
March 10, 2023This week, we take a closer look at Ethereum, Ripple, Cardano, Dogecoin, and Polygon.
Ethereum (ETH)
The overall market has turned red, and ETH’s price has lost 15% in the past week. With support broken to the downside, Ethereum is struggling to find its footing and could go to $1,300, where the next key support is found.
The news that Ethereum could be considered a security is another blow that may intensify the current bearish momentum. As the pressure is building up, bears appear to become more confident.
Looking ahead, there is not much that can stop this selloff. Until the current sentiment shifts, the price action could lead to a re-test of the lows seen back in December 2022 (~$1,000).
Chart by TradingViewRipple (XRP)
Ripple had a small rally on the back of the
SOL Dives 7% Daily, is $15 The Next Big Target? (Solana Price Analysis)
March 8, 2023Solana lost its key support at $20 and is now accelerating down.
Solana Price Analysis
Key Support levels: $17, $15
Key Resistance levels: $20, $23
SOL failed to maintain its price within the descending triangle, and with the support at $20 turned into resistance, it’s currently in search of support. The key levels to watch are found at $17 and $15, with the latter having the highest confidence.
Chart by TradingViewTrading Volume: The sustained sell volume in the past week has pushed Solana into making lower lows.
RSI: The daily RSI is quickly approaching the oversold area at under 30 points. Hopefully, buyers will become interested again.
MACD: The daily MACD is in freefall, and there are no signs that this downtrend will end at this time.
Chart by TradingViewBias
The
Crypto Price Analysis Feb-17: ETH, XRP, ADA, MATIC, OKB
February 17, 2023This week, we take a closer look at Ethereum, Ripple, Cardano, Polygon, and OKB.
Ethereum (ETH)
Ethereum had a great rally this past week but failed to break above the key resistance at $1,660. Nevertheless, the price still managed to increase by 7.4%.
the current PA shows that buyers are becoming eager, and the key resistance is being tested again and again. The more this happens, the likelier it becomes for ETH to break above and move higher.
Looking ahead, ETH has good support at $1,550, and the bias turned bullish due to this latest rally. If buyers continue to put pressure, then there might be a quick breakout to higher levels, which would take this cryptocurrency closer to the key psychological level of $2,000.
Chart by TradingViewRipple (XRP)
While Ripple also
Crypto Price Analysis Feb-3: ETH, XRP, ADA, MATIC, and FTM
February 3, 2023This week, we take a closer look at Ethereum, Ripple, Cardano, Polygon, and Fantom.
Ethereum (ETH)
Ethereum, the second-largest cryptocurrency, continued to consolidate this week. The price only registered a 2.9% increase. This is because ETH is stuck in a channel between $1,670 and $1,550.
All attempts to break these levels were rejected in the past two weeks. While some altcoins were booking double digits gains (see Fantom below), Ethereum appears to be on a pause. This could also be because money is rotating between different altcoins.
Looking ahead, ETH will eventually break away from this range, and that will set the tone for where the price will go next. The current bias is neutral, and the indicators also give mixed signals.
Chart by TradingViewRipple (XRP)
Solana is Up 6% Daily, Here’s the Key Resistance (SOL Price Analysis)
January 26, 2023Solana continues to perform despite a decline in the buying volume, booking a 6% increase in the past 24h.
Key Support levels: $20
Key Resistance levels: $27
The resistance at $27 is keeping bulls in check. They have been rejected at that level on Saturday. In the process, SOL has formed an ascending triangle, and a major breakout is expected over the coming days. Should bulls fail, then the price can quickly fall to the $20 support.
Chart by TradingViewTrading Volume: The considerable buying volume has allowed Solana to remain on the offensive, but the momentum is fading.
RSI: The daily RSI is just under 80 points and is making lower highs. This is bearish.
MACD: The daily MACD is still bullish but may do a bearish cross at any moment based on the histogram, which is also
SOL Explodes 60% Weekly But How High Can it Reach? (Solana Price Analysis)
January 16, 2023Solana’s price doubled since the end of December, and bulls continue to be in control of the price action.
Key Support levels: $20
Key Resistance levels: $27
SOL has managed to fully recover most of the drop that started in November 2022. At this rate, buyers seem eager to return its price back to pre-FTX collapse levels soon.
To maintain this positive momentum, the cryptocurrency will have to break the key resistance at $27. Sellers continue to be absent, but if they return, then the key support is found at $20.
Chart by TradingViewTrading Volume: The buying volume is making higher highs. This is bullish. As long as it continues, there is no looking back for buyers.
RSI: The daily RSI almost reached 90 points. While this shows buy pressure is high, it also serves as a
Crypto Price Analysis Jan-06: ETH, XRP, ADA, LTC, and SOL
January 6, 2023This week, we take a closer look at Ethereum, Ripple, Cardano, Litecoin, and Solana
Ethereum (ETH)
This Wednesday, the bulls took over the price action and pushed ETH all the way to the key resistance at $1,260. Since then, the price seemed unable to break above. Nevertheless, Ethereum still managed to book a 3.8% increase in the past seven days.
The fact that in the past two days, the price has been rather timid in pulling back from this most recent rally suggests that sellers are exhausted or lack interest at this moment. This could turn into a key opportunity for the bulls.
Looking ahead, ETH is giving good signals that buyers are in control with higher lows and higher highs in the price action. Should they maintain the momentum, the next critical level to watch for is
Solana Surges 34% Weekly But is the New Year Rally Running out of Steam? (SOL Price Analysis)
January 5, 2023In a somewhat surprising move, Solana’s price exploded this past week, putting bears on the defensive.
Key Support levels: $9.5
Key Resistance levels: $15
After falling to the single-digit territory (almost $8), Solana seemed destined to continue on the bearish footing. However, this was interrupted on Monday when the price suddenly spiked higher after finding good support at $9.5. This led SOL to close the past seven days with a 34% price increase. The resistance is at $15, and SOL’s price reached $14 during this most recent rally.
Chart by TradingViewTrading Volume: The volume exploded on Monday and remained high until Wednesday. Today the volume opened in red, and the price is falling, which could mean a pullback is likely.
RSI: The daily RSI moved above 50 points
Cardano Spikes 4% in a Day, but Is The Worst Over? (ADA Price Analysis)
January 2, 2023After making a lower low in December, Cardano surprised the market in the new year by opening in green.
Key Support levels: $0.24, $0.20
Key Resistance levels: $0.30, $0.34
Optimism is building up as Cardano seems to have found good support at $0.24. Since the start of 2023, ADA is in green and does not appear to be looking back. If this momentum continues then, this cryptocurrency could even target $0.30, which is the next key resistance.
Chart by TradingViewTrading Volume: The volume is rather flat, but despite this, ADA closed in the green for the past three days. Buyers may be returning.
RSI: The daily RSI made a bullish divergence as the price fell to a yearly low in December 2022. This is promising, particularly in light of the current price action.
MACD: The daily