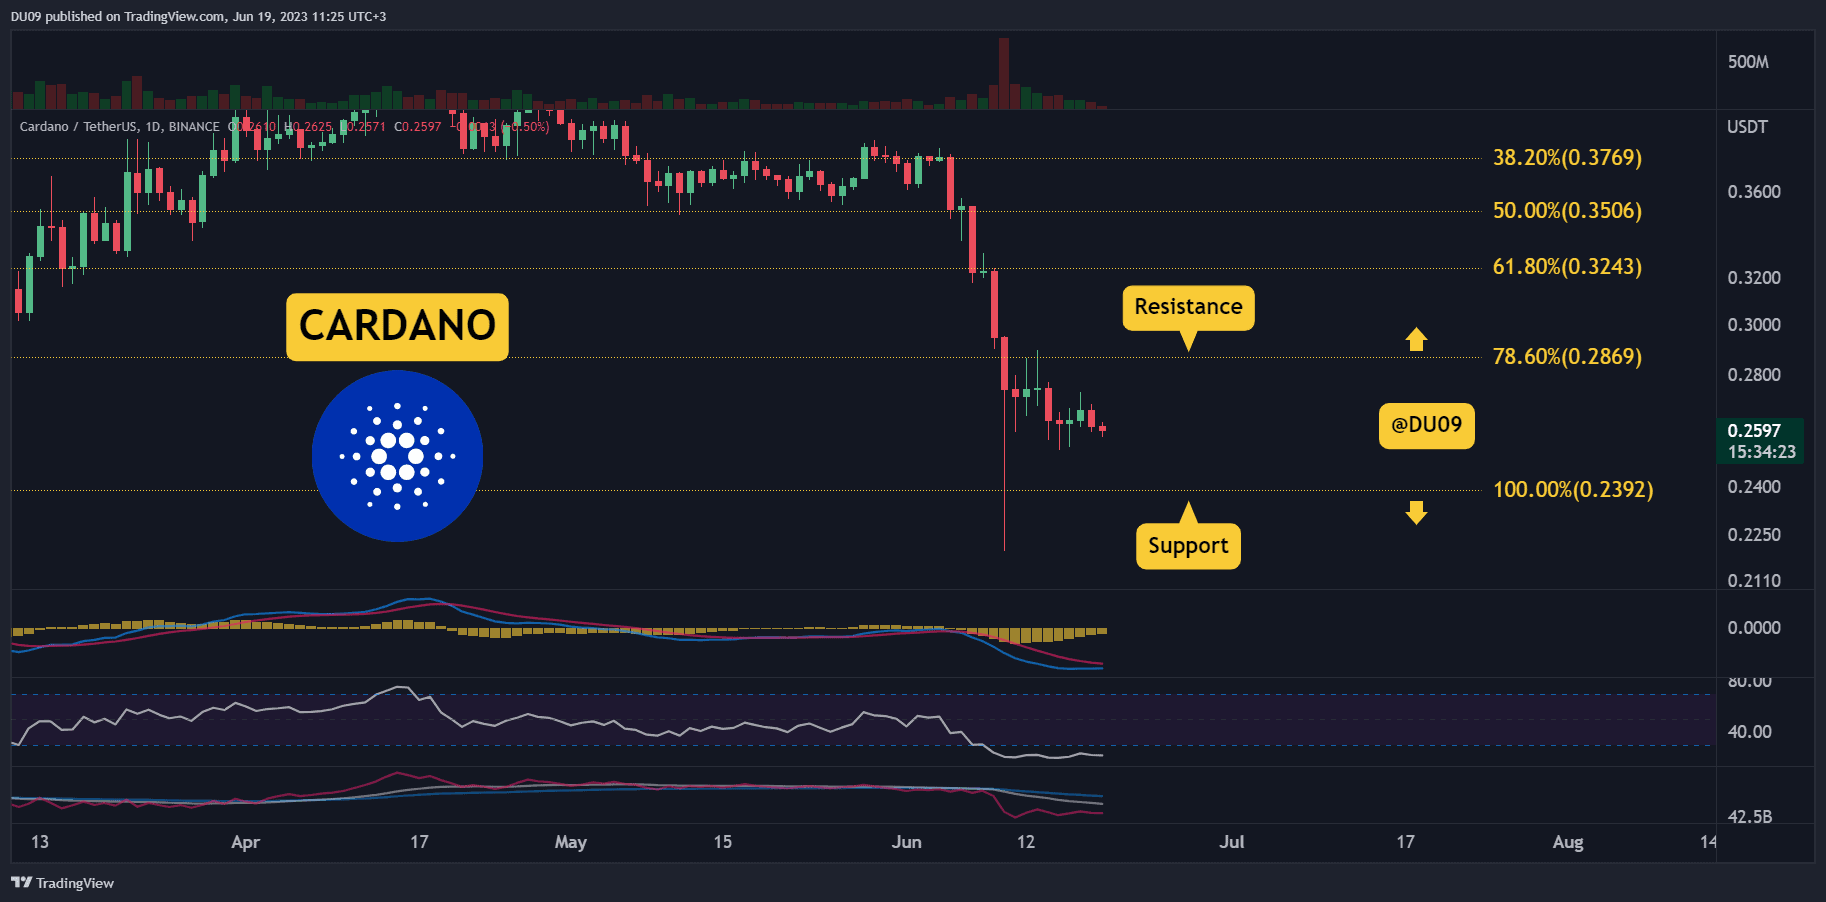
With volatility declining, buyers may soon have an opportunity to stop the downtrend. Key Support levels: %excerpt%.24 Key Resistance levels: %excerpt%.29 The weekly price for ADA shows a 7% loss. However, sellers appear to have lost interest since the crash on June 10th and have failed to take the price lower. With good support at 24 cents, bulls may have an opportunity to push ADA higher in the coming days. Chart by TradingViewTrading Volume: The volume crashed in the past few days. It appears that sellers don’t have the strength to continue the downtrend right now. This provides an opportunity for a reversal. RSI: The daily RSI is in the oversold area of under 30 points since June 9th. While this is bearish, it could also mean that ADA may soon leave this area to attempt a breakout.
Topics:
Duo Nine considers the following as important: ADABTC, ADAUSD, Cardano (ADA) Price, Price Analysis
This could be interesting, too:
Jordan Lyanchev writes Cardano (ADA) Surpasses Dogecoin After 55% Surge
Jordan Lyanchev writes Trump Confirms Work on Strategic Crypto Reserve: XRP, ADA, SOL Included
Dimitar Dzhondzhorov writes Millions of ADA Sold by Cardano Whales During Market Crash – Will the Decline Continue?
Jordan Lyanchev writes Here’s How Cardano’s 17% Weekly Correction Can Help ADA Hit This Cycle: Analyst
With volatility declining, buyers may soon have an opportunity to stop the downtrend.
Key Support levels: $0.24
Key Resistance levels: $0.29
The weekly price for ADA shows a 7% loss. However, sellers appear to have lost interest since the crash on June 10th and have failed to take the price lower. With good support at 24 cents, bulls may have an opportunity to push ADA higher in the coming days.
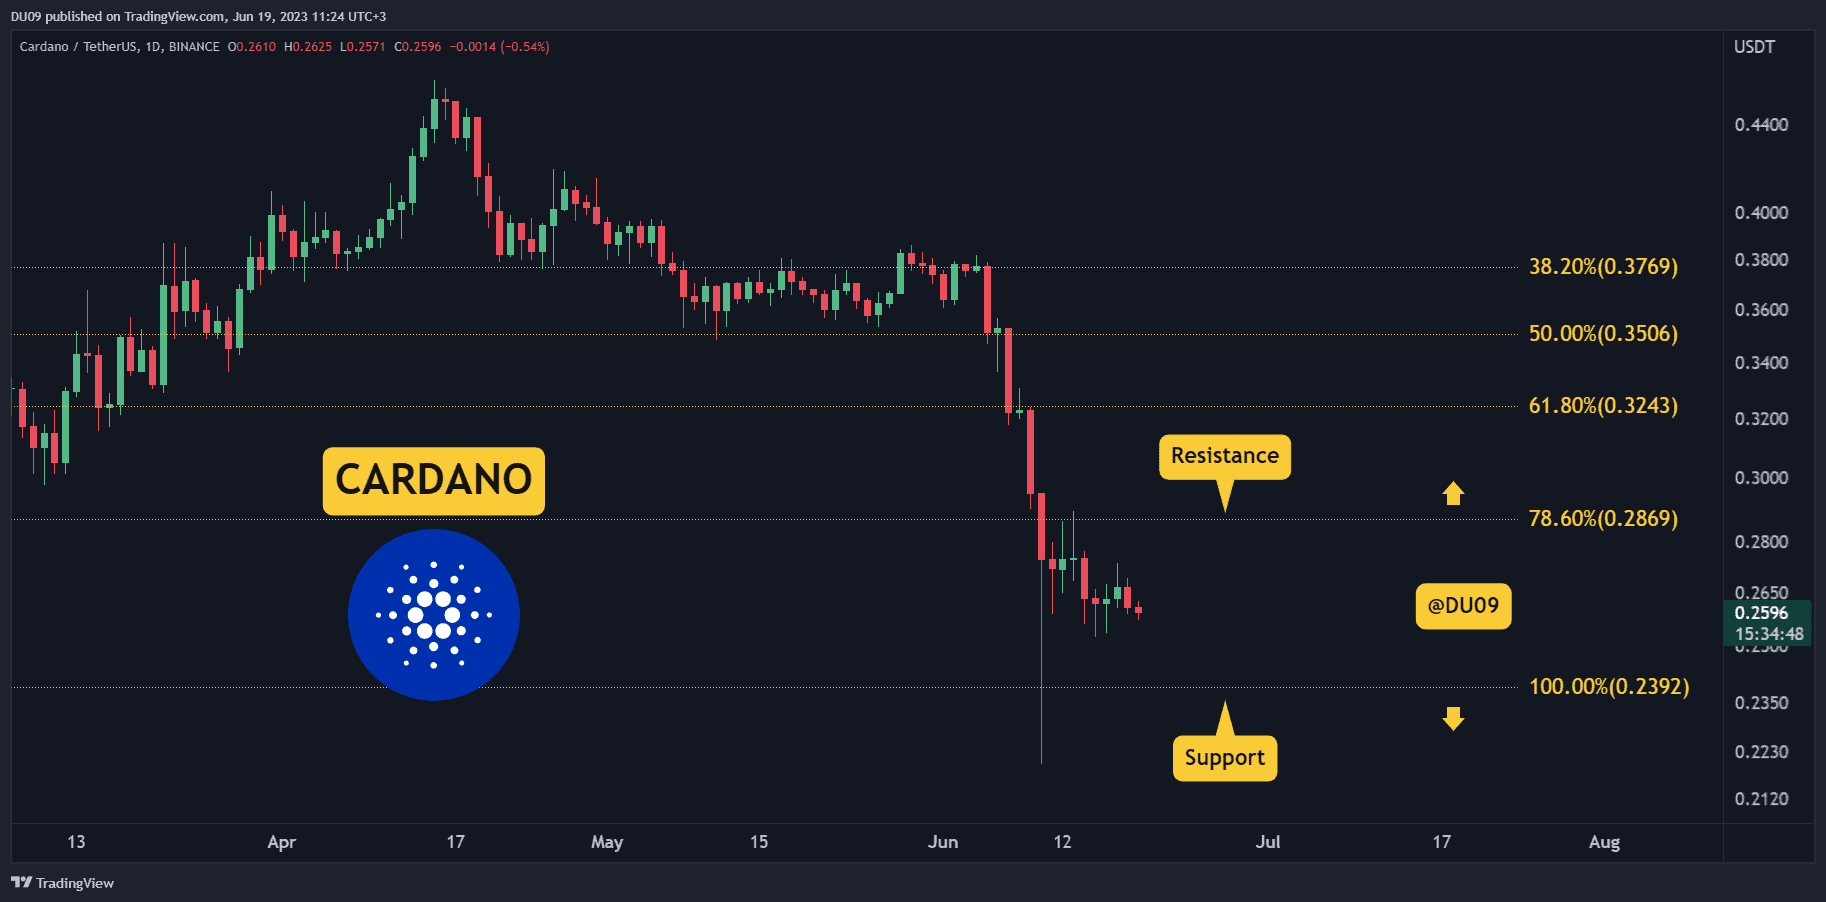
Trading Volume: The volume crashed in the past few days. It appears that sellers don’t have the strength to continue the downtrend right now. This provides an opportunity for a reversal.
RSI: The daily RSI is in the oversold area of under 30 points since June 9th. While this is bearish, it could also mean that ADA may soon leave this area to attempt a breakout.
MACD: The daily MACD is bearish, but the histogram is making higher lows. If this continues, a reversal appears likely.
Bias
The bias for ADA is bearish.
Short-Term Prediction for ADA Price
ADA is in desperate need of a relief rally that has been delayed for days after its sharp drop last week. This exhaustion from sellers could soon turn into an opportunity for bulls to take the price to the key resistance at 29 cents.