Shiba Inu is in a clear uptrend, and momentum still favors bulls. Key Support levels: %excerpt%.0000080 Key Resistance levels: %excerpt%.0000094 1. Clear Higher Highs The price has been making higher highs since late June, and SHIB has not stopped since. This puts the price in a clear uptrend which could take SHIB to the key resistance at %excerpt%.0000094. However, in the process, this meme coin also appears to have formed a bearish wedge which could see the price break under it once the key resistance is hit. Chart by TradingView2. Sustained Buy Volume Despite regular pullbacks, buyers continue to dominate the chart. This is also represented in the price that has slowly moved higher every week. Buyers appear to rush in whenever SHIB breaches a key resistance pushing the price higher in a
Topics:
Duo Nine considers the following as important: Price Analysis, Shiba Inu (SHIB), SHIBBTC, SHIBUSD
This could be interesting, too:
Dimitar Dzhondzhorov writes Watch Out: Shiba Inu (SHIB) Team Issues a Major Warning to the Community
Dimitar Dzhondzhorov writes Shiba Inu (SHIB) Might Plunge by Another 30% Before Finding Support (Analyst)
Jordan Lyanchev writes Shiba Inu Price Forecasts: Another 50% Crash or 420% Rally Ahead for SHIB?
Dimitar Dzhondzhorov writes This Trader Made Over Million by Selling Shiba Inu (SHIB) Holdings: Details
Shiba Inu is in a clear uptrend, and momentum still favors bulls.
Key Support levels: $0.0000080
Key Resistance levels: $0.0000094
1. Clear Higher Highs
The price has been making higher highs since late June, and SHIB has not stopped since. This puts the price in a clear uptrend which could take SHIB to the key resistance at $0.0000094.
However, in the process, this meme coin also appears to have formed a bearish wedge which could see the price break under it once the key resistance is hit.
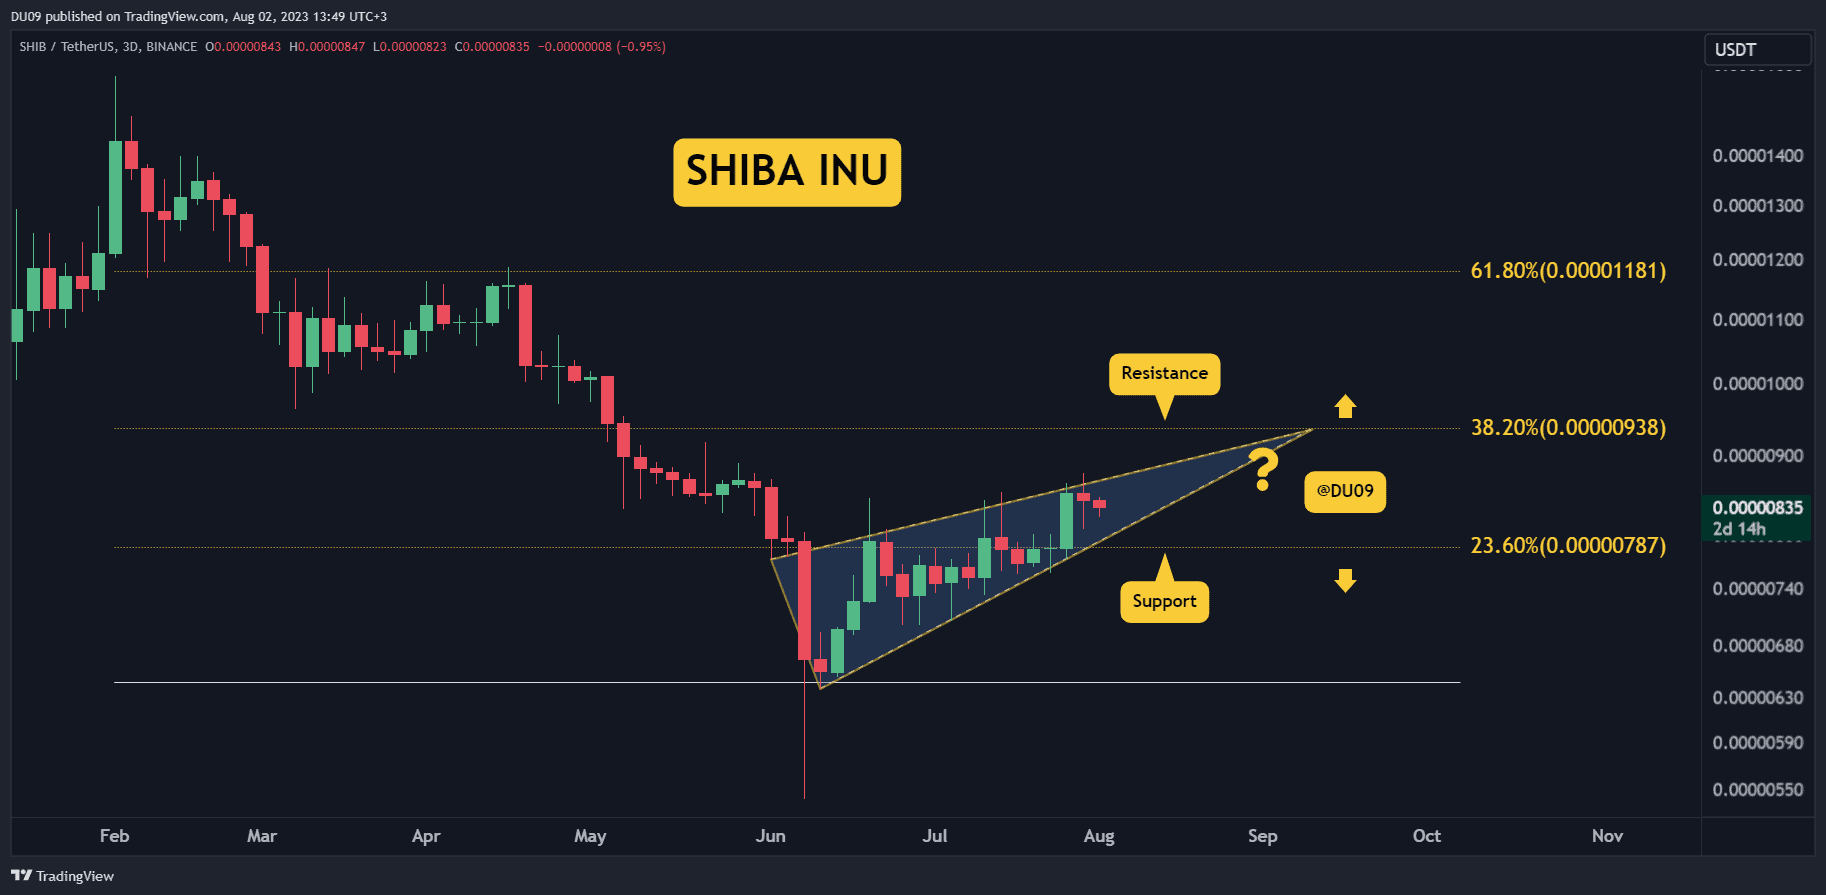
2. Sustained Buy Volume
Despite regular pullbacks, buyers continue to dominate the chart. This is also represented in the price that has slowly moved higher every week. Buyers appear to rush in whenever SHIB breaches a key resistance pushing the price higher in a short amount of time which sustains the bullish bias.

3. Bullish Momentum
The momentum is clearly positive on the MACD and RSI indicators, as they both show higher highs. With good support at $0.0000080, SHIB seems to be on a clear path to hit the key resistance.

Bias
The bias for SHIB is bullish.
Short-Term Prediction for SHIB Price
A test of the key resistance at $0.0000094 appears imminent. Nevertheless, it’s important to watch closely how the wedge will resolve as a break below it could lead to a correction. On the other hand, a break above it could likely be extremely bullish for Shiba Inu’s price action.