Solana broke above 0 as its rally appears unstoppable. In the following, we take a closer look at a few interesting technical indicators. They might provide some information as to why the price of SOL is up today. Key Support levels: 3 Key Resistance levels: 9 1. Higher Highs on Volume When the price rallies on higher volume – it is a very bullish signal. It shows strength, and Solana is currently singlehandedly dominating the crypto market. It also broke above 0. Chart by TradingView2. All-Time High in Sight Solana’s all-time high is 6. Considering the price is already above 0 at the time of this post, there is very little left to stop it from reaching that key resistance. If buyers break above that level, then SOL will enter price discovery. Chart by
Topics:
Duo Nine considers the following as important: Crypto Bits, Solana (SOL) Price
This could be interesting, too:
Dimitar Dzhondzhorov writes Trump-Related Meme Coins in Freefall as Crypto Market Takes a Hit
Dimitar Dzhondzhorov writes Is the Ripple v. SEC Lawsuit Over? This Former White House Official Thinks so
Dimitar Dzhondzhorov writes Urgent Update for Pi Network (PI) Users Who Haven’t Completed KYC
Dimitar Dzhondzhorov writes Watch Out: Shiba Inu (SHIB) Team Issues a Major Warning to the Community
Solana broke above $200 as its rally appears unstoppable. In the following, we take a closer look at a few interesting technical indicators. They might provide some information as to why the price of SOL is up today.
Key Support levels: $163
Key Resistance levels: $259
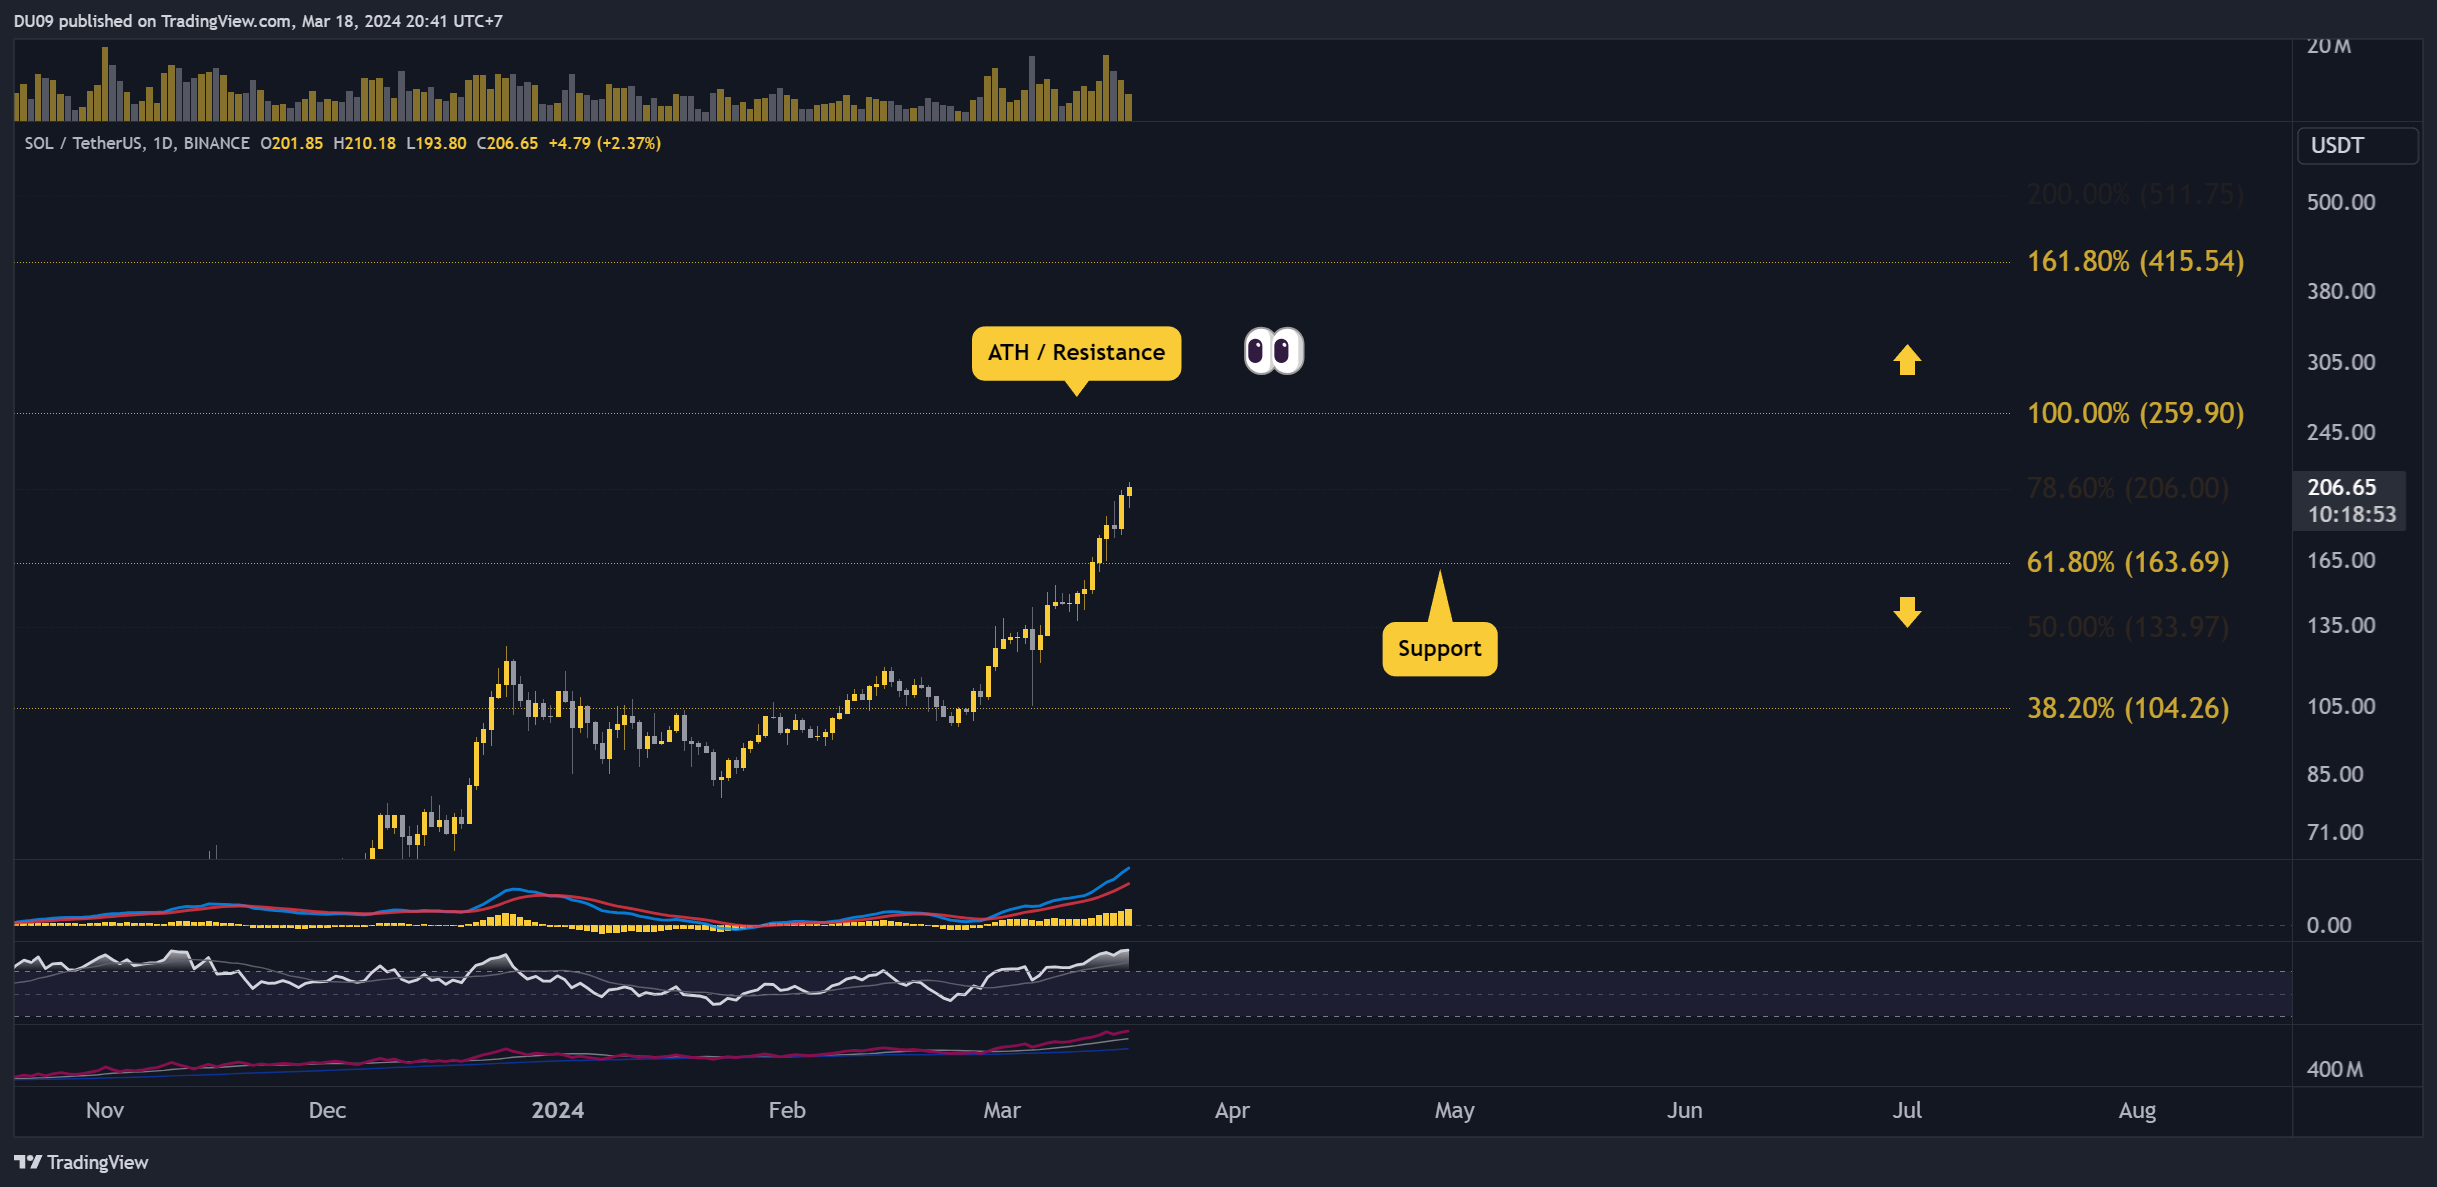
1. Higher Highs on Volume
When the price rallies on higher volume – it is a very bullish signal. It shows strength, and Solana is currently singlehandedly dominating the crypto market. It also broke above $200.
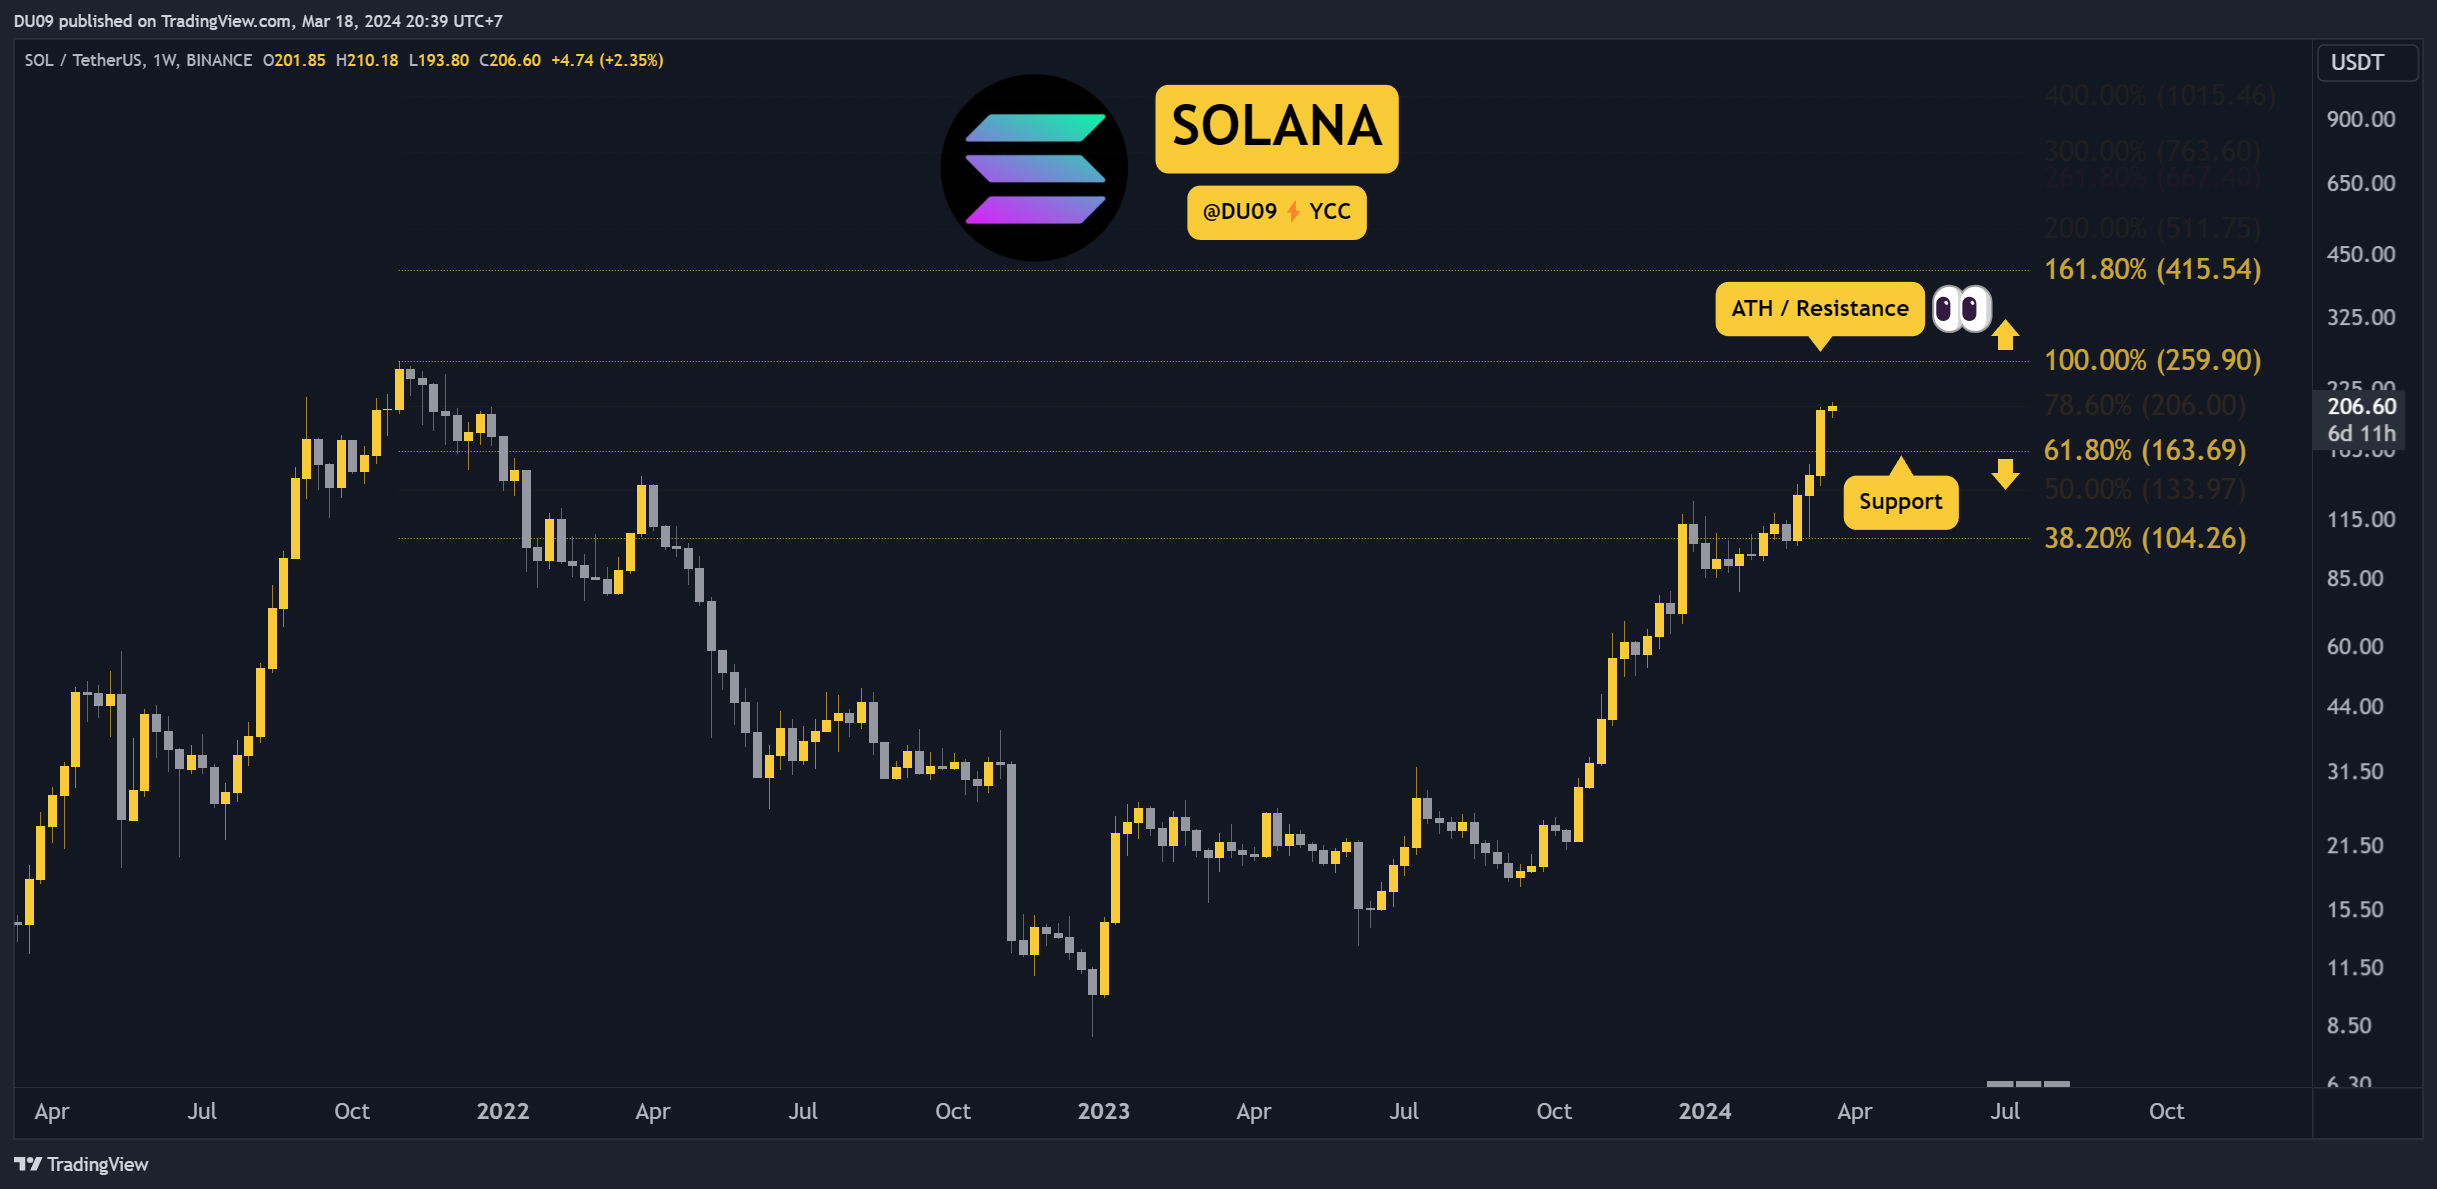
2. All-Time High in Sight
Solana’s all-time high is $256. Considering the price is already above $200 at the time of this post, there is very little left to stop it from reaching that key resistance. If buyers break above that level, then SOL will enter price discovery.
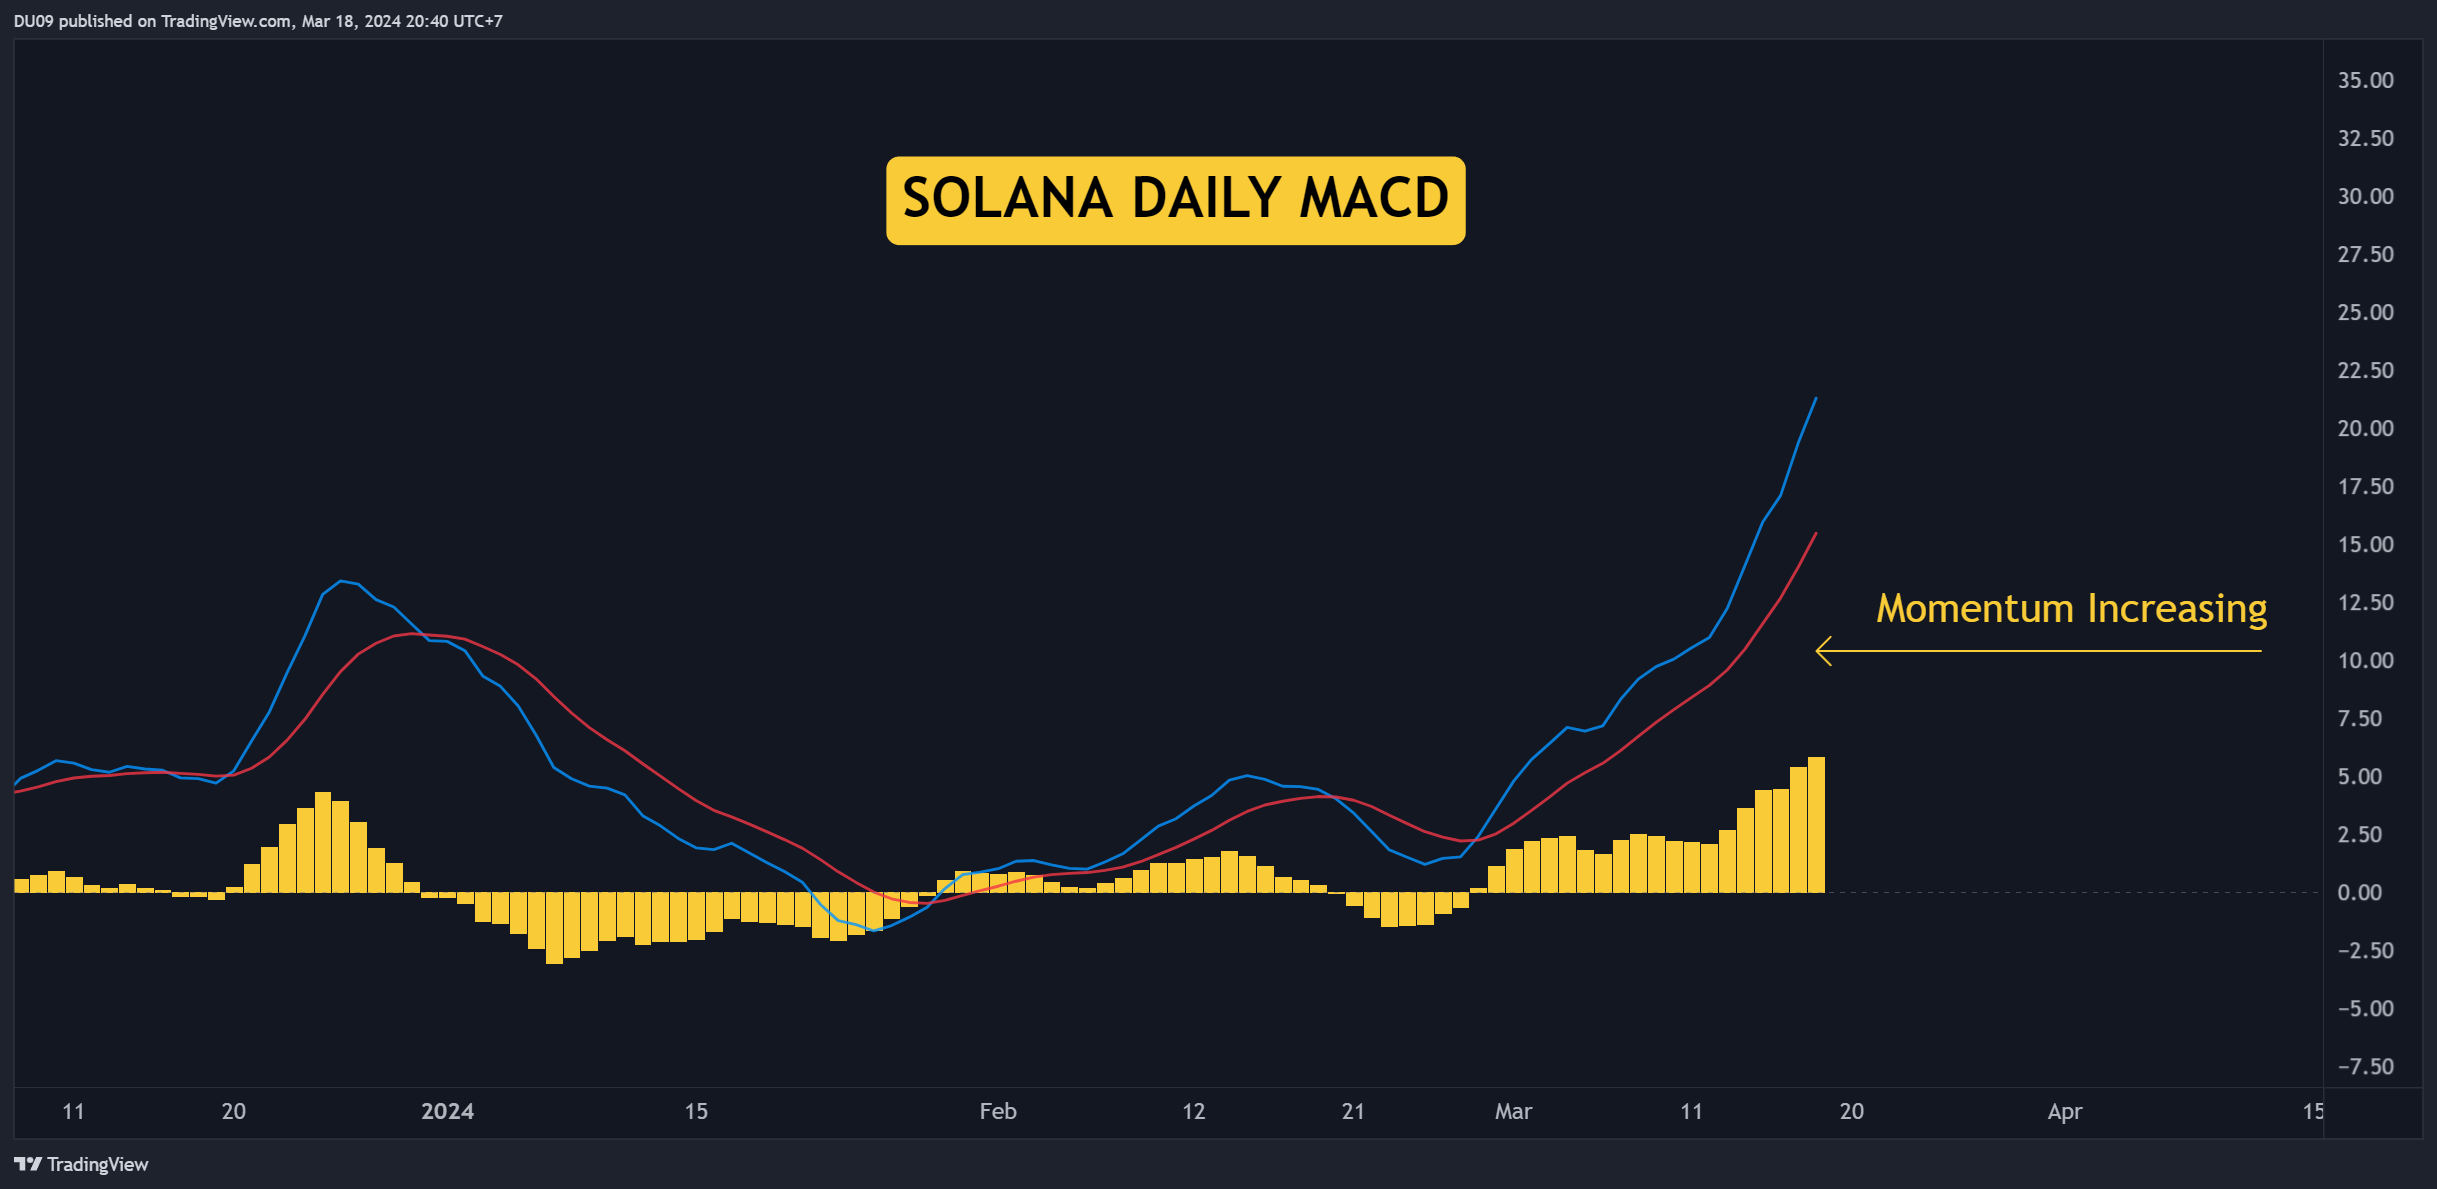
3. Bullish Momentum Intensifies
The daily MACD moving averages are expanding as they move higher. This is another sign of strength, and the current momentum gives no indication of exhaustion. Until the histogram makes a lower high, there is little reason to be concerned.