Ethereum’s price has finally reached a significant obstacle following months of rallying. Yet, there are still reasons to be optimistic that the market can climb higher. Technical Analysis By TradingRage The Daily Chart On the daily chart, the price has been rejected from the ,000 resistance after rallying consistently since the beginning of February. The price has dropped to the ,600 support level, which is currently holding. If ETH rebounds from here, the market might be able to rise above ,000 and make a new all-time high in the coming weeks. On the other hand, a breakdown can lead to a decline toward ,000. Source: TradingViewThe 4-Hour Chart Looking at the 4-hour timeframe, the price has seemingly experienced a shift in structure. The market has been making
Topics:
CryptoVizArt considers the following as important: ETH Analysis, ETHBTC, Ethereum (ETH) Price, ethusd
This could be interesting, too:
Mandy Williams writes BTC at 0K, ETH to K, and More: Here’s VanEck’s Top Crypto Predictions for 2025
Jordan Lyanchev writes Bitcoin, Ethereum ETF Streak Continues With Massive Net Inflows: Weekly Recap
CryptoVizArt writes ETH Seems Primed to Take Down K After Recent Rebound: Ethereum Price Analysis
Dimitar Dzhondzhorov writes Top Ethereum (ETH) Price Predictions: New ATH or Another Severe Correction?
Ethereum’s price has finally reached a significant obstacle following months of rallying. Yet, there are still reasons to be optimistic that the market can climb higher.
Technical Analysis
By TradingRage
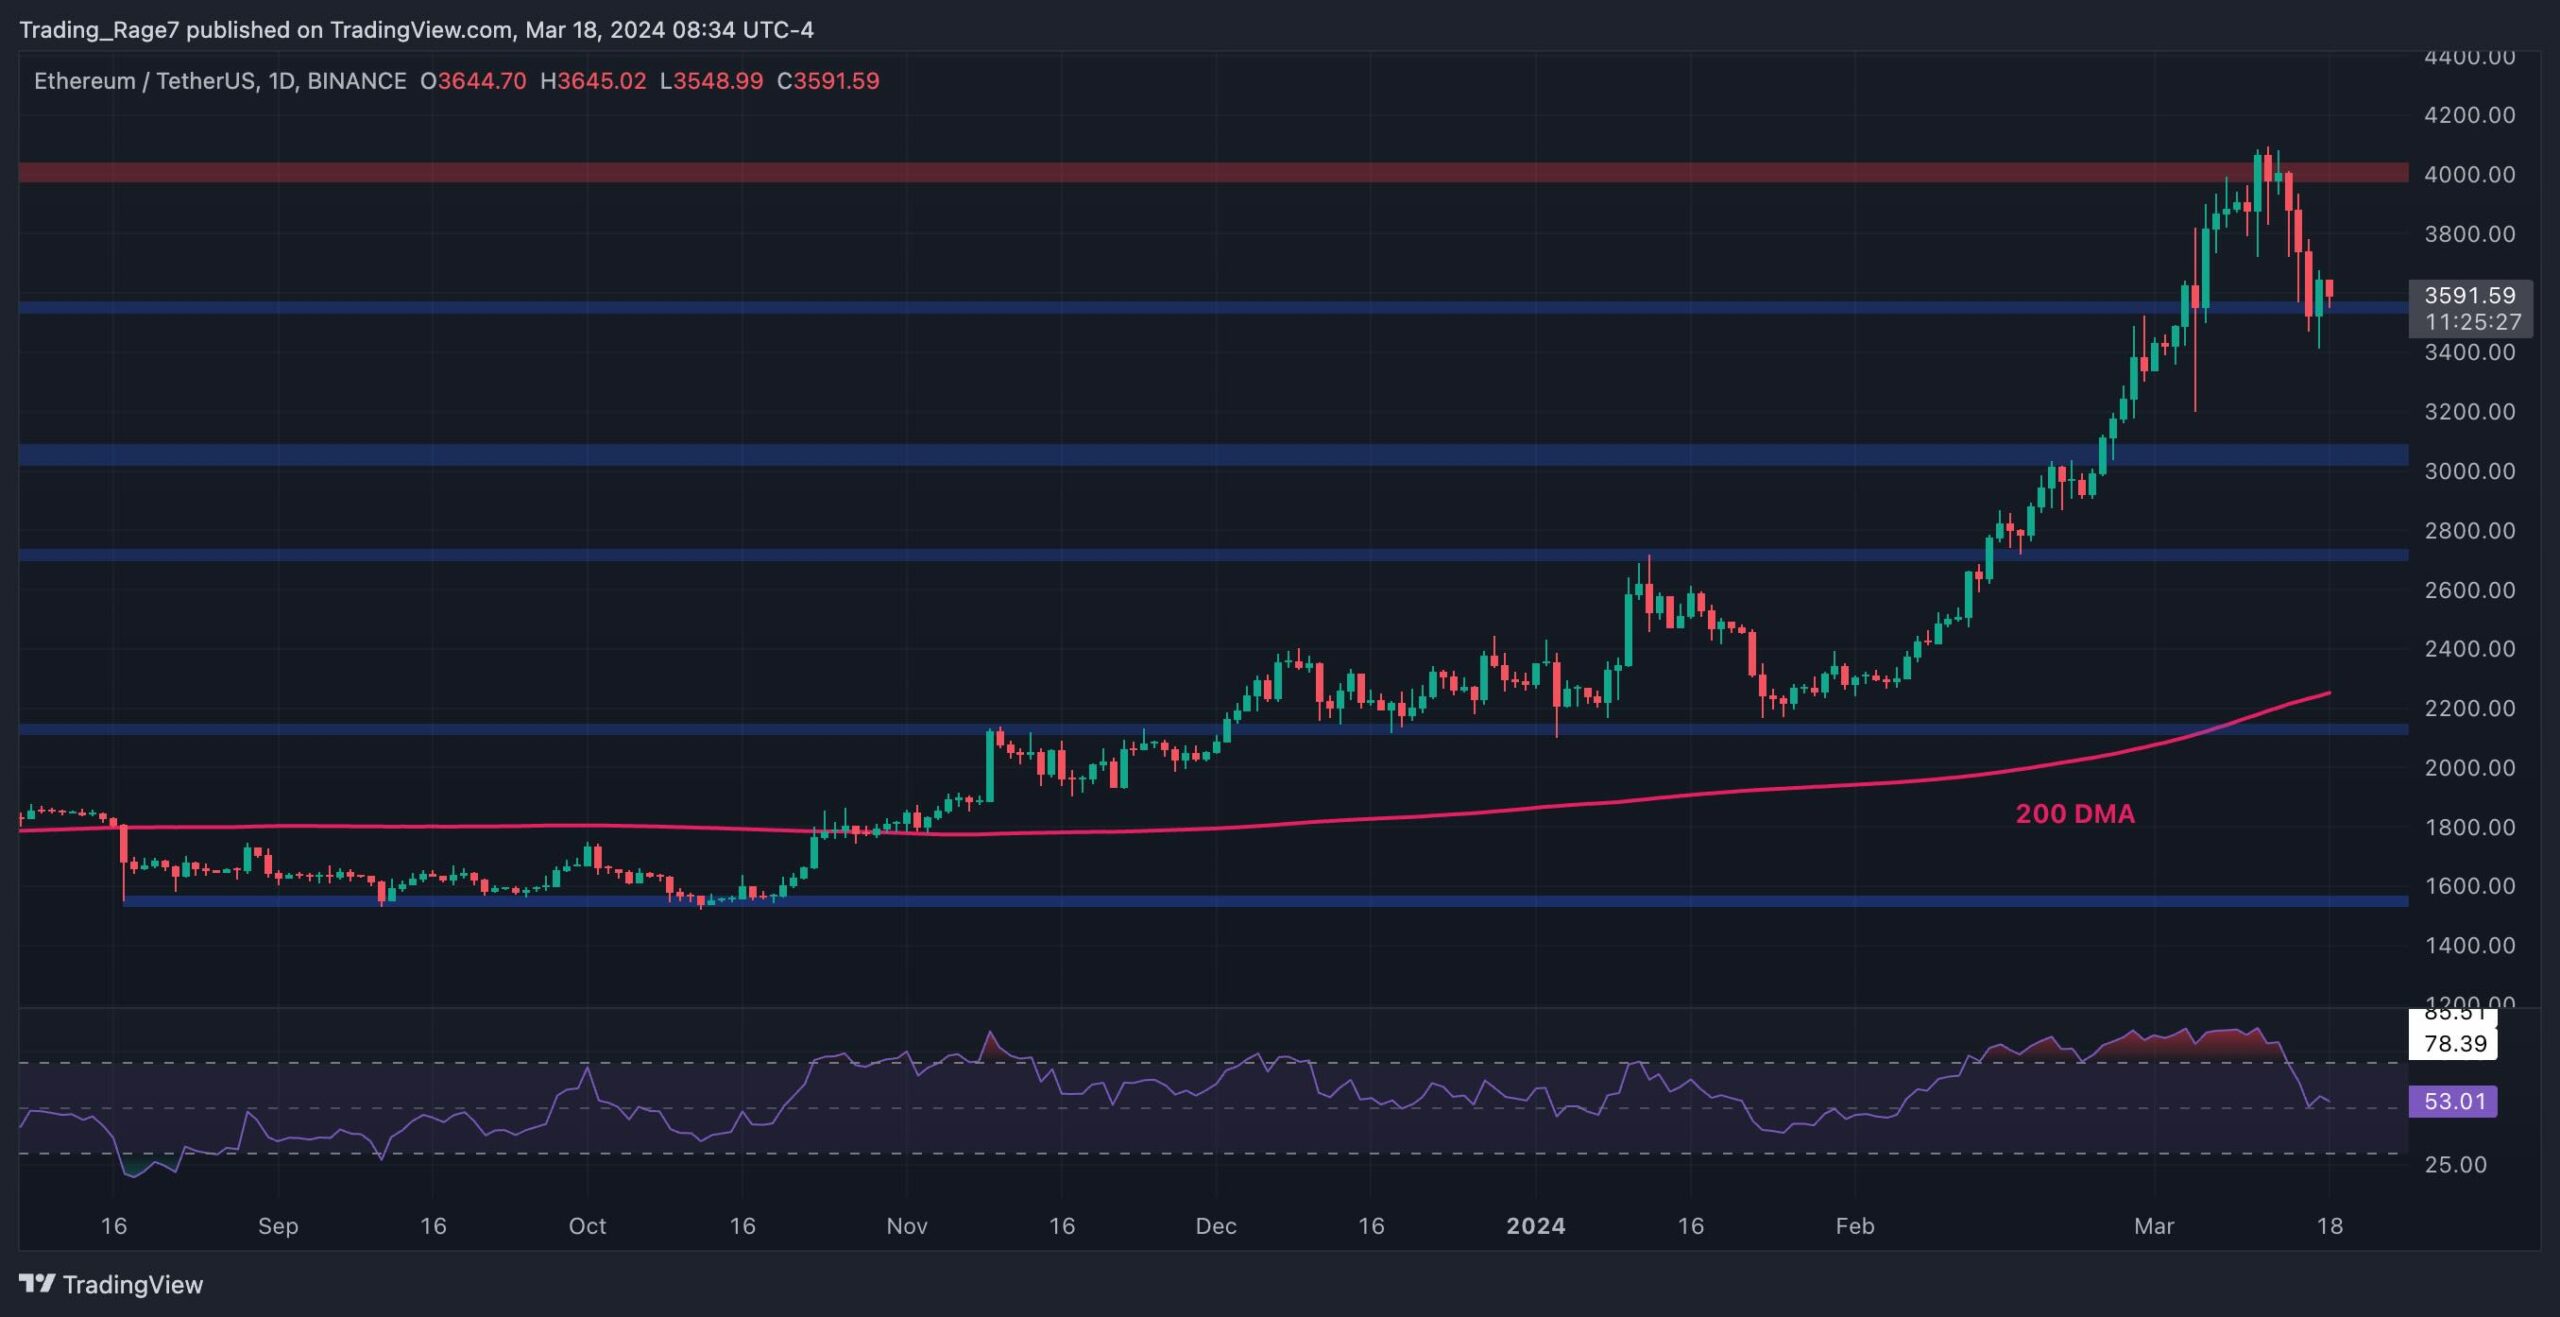
The Daily Chart
On the daily chart, the price has been rejected from the $4,000 resistance after rallying consistently since the beginning of February.
The price has dropped to the $3,600 support level, which is currently holding. If ETH rebounds from here, the market might be able to rise above $4,000 and make a new all-time high in the coming weeks. On the other hand, a breakdown can lead to a decline toward $3,000.
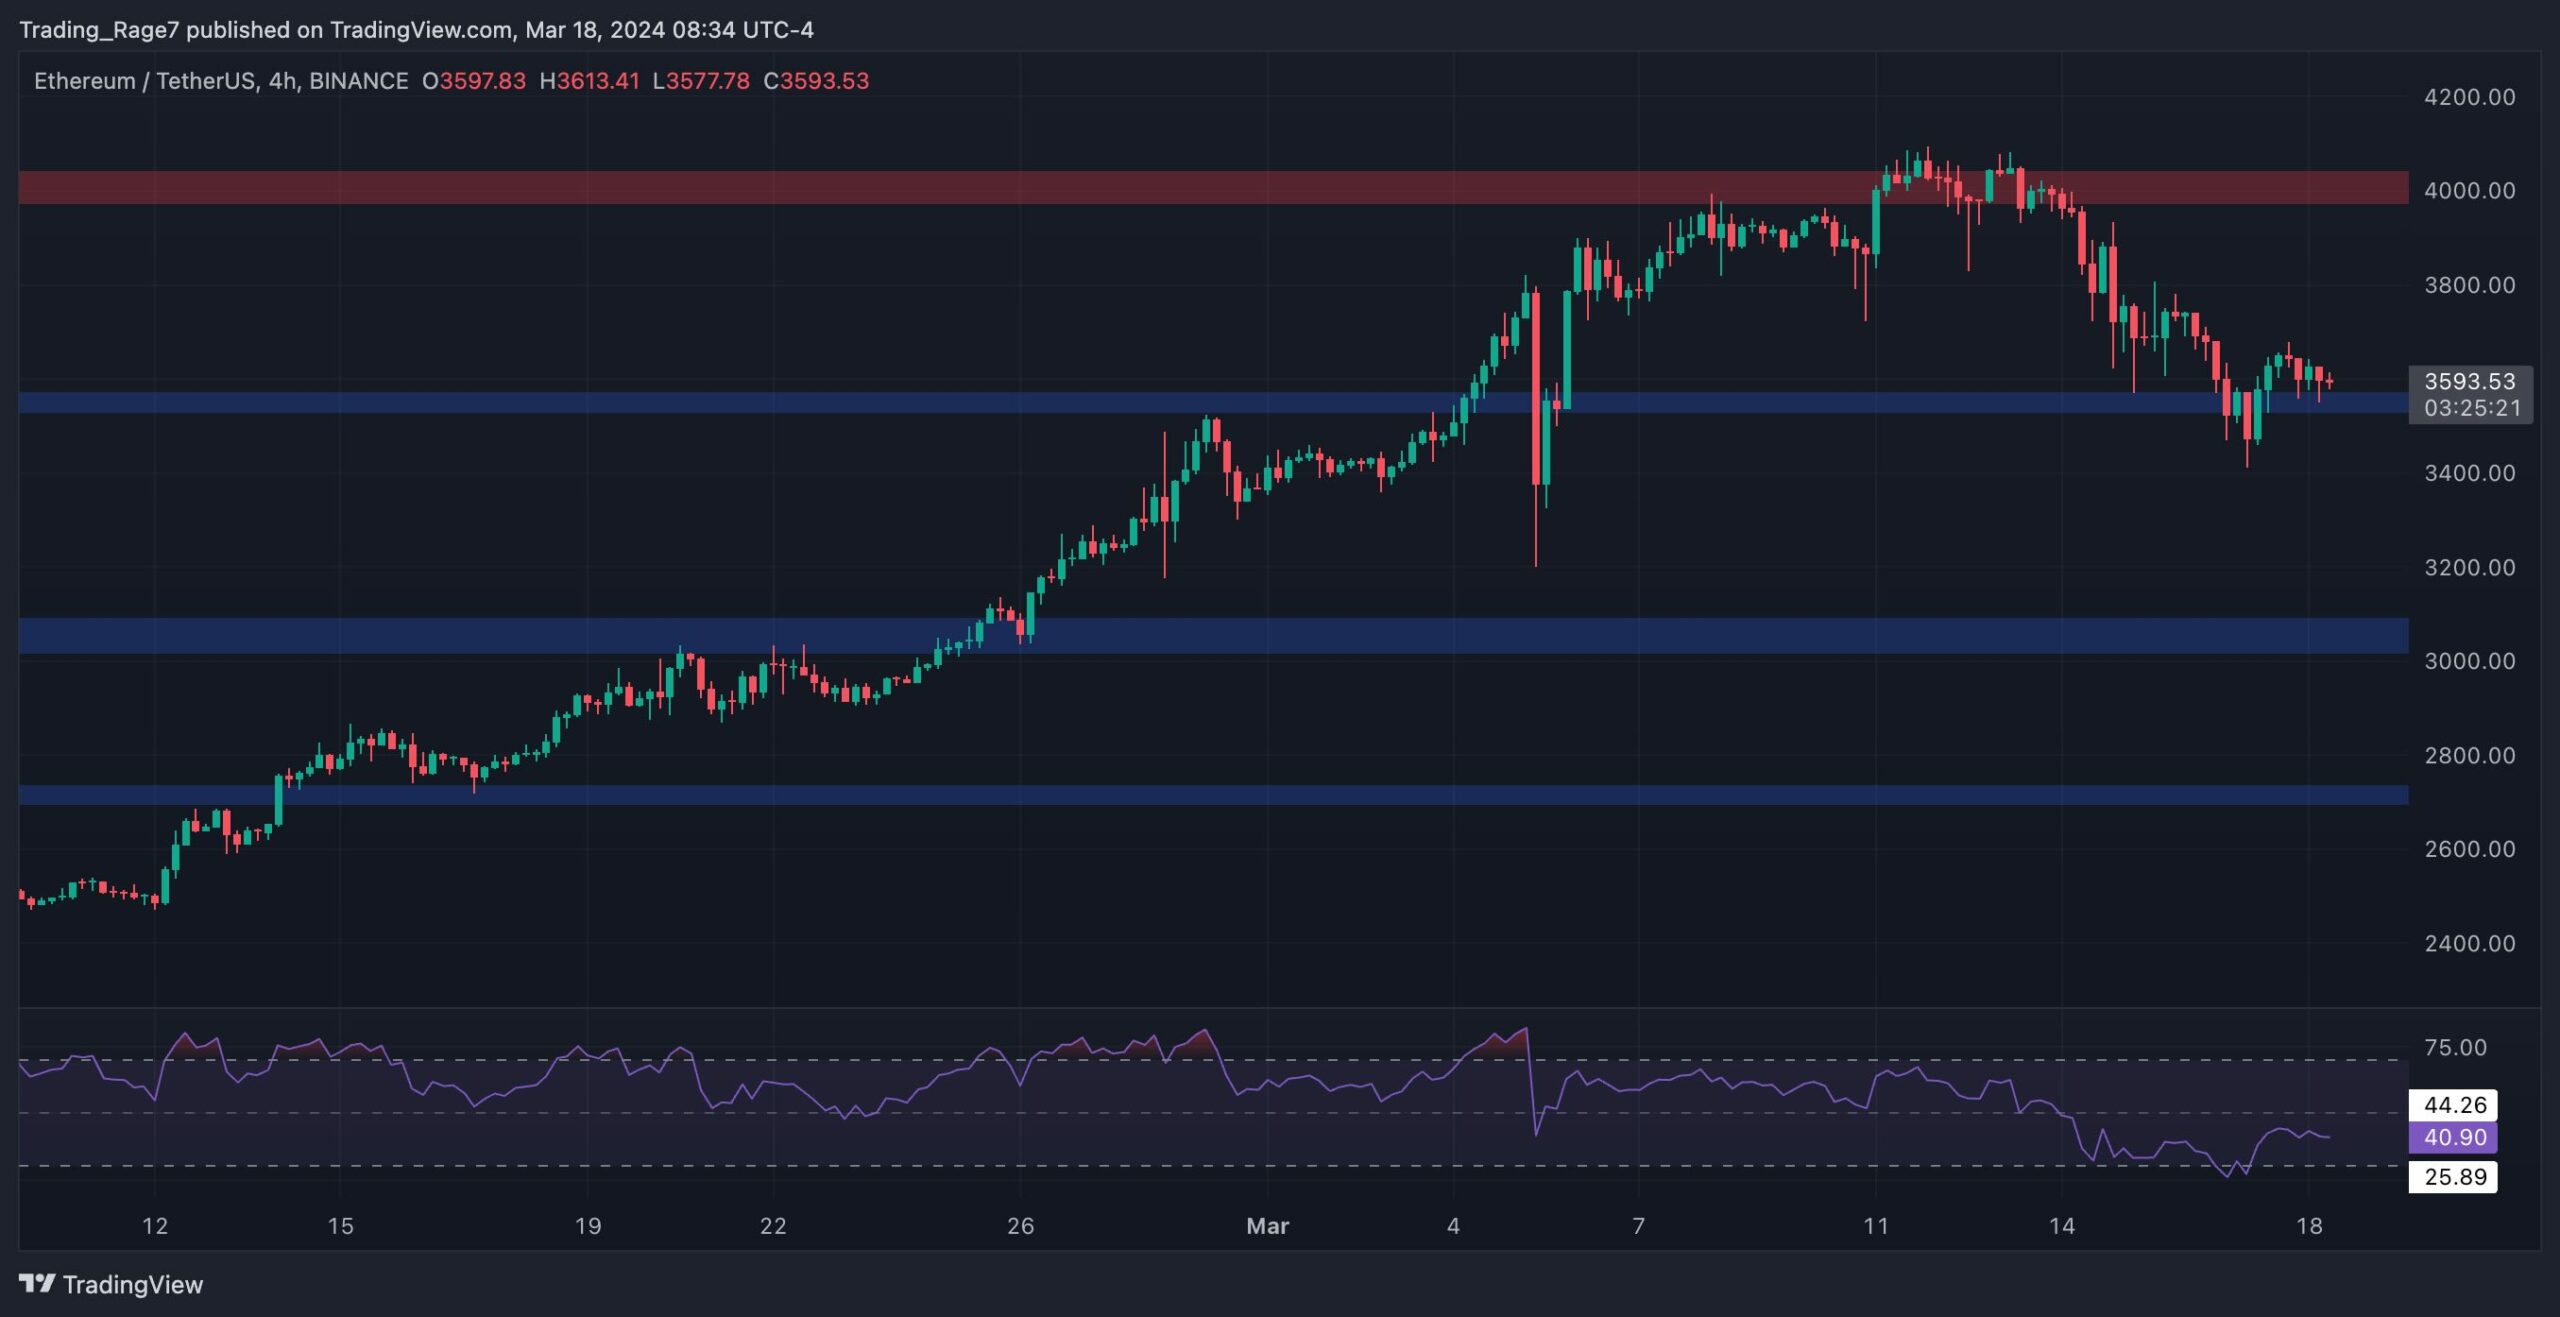
The 4-Hour Chart
Looking at the 4-hour timeframe, the price has seemingly experienced a shift in structure. The market has been making lower highs and lows since its rejection from the $4,000 resistance zone.
While the $3,600 support level might still hold, ETH might break lower, as the Relative Strength Index is showing values below 50%. Therefore, a pullback toward the $3,000 level might be expected in the short term.
On-Chain Analysis
By TradingRage
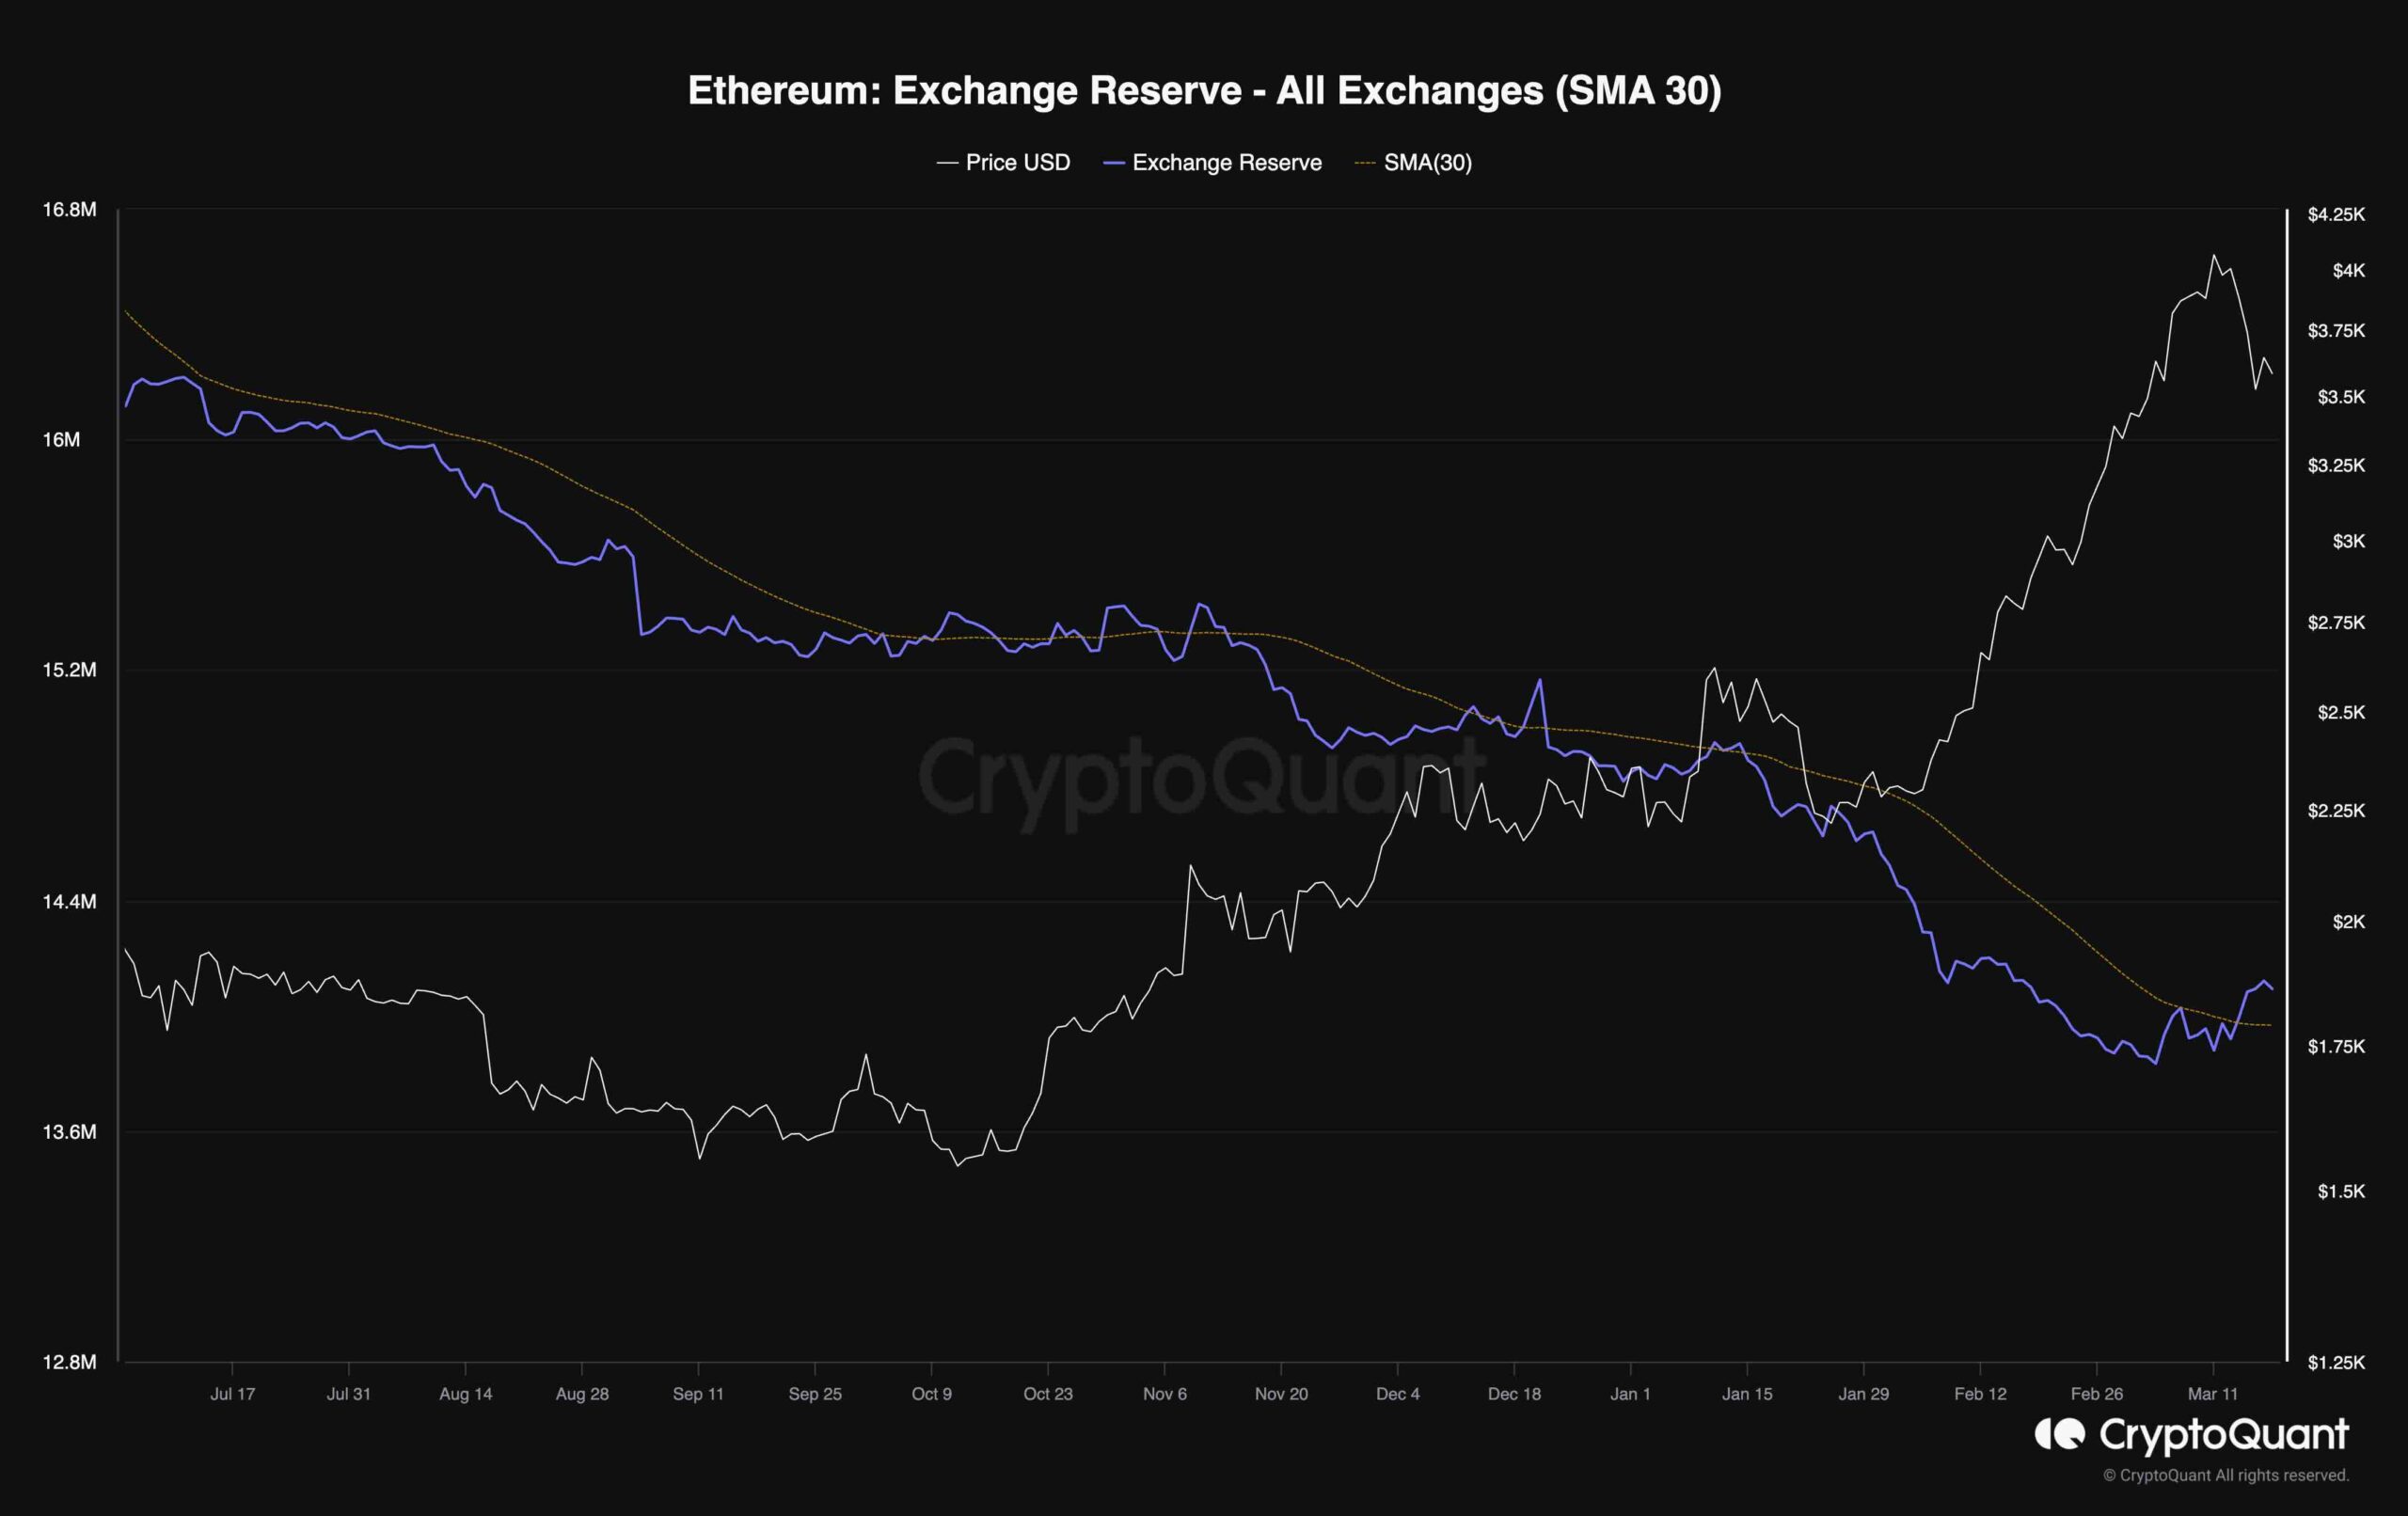
Ethereum Exchange Reserve
Ethereum’s price has been rallying aggressively over the last few weeks. Yet, the recent drop below the $4,000 level has shocked market participants and caused panic selling by some holders.
This chart displays the exchange reserve metric, which measures the amount of Bitcoin held in exchange wallets. A rise in the metric typically indicates a rise in supply, which could lead to a decline in price.
As the chart demonstrates, the exchange reserve has risen above its 30-day moving average. This points to the fact that many holders are depositing their coins to the exchanges with the intention to sell them. A continuation of this trend can be detrimental, as it could result in a further price decline in the coming weeks.