Ripple recently broke past its previous major swing high of , maintaining strong upward momentum and nearing its all-time high of .4. This price zone is critical, as a breakout above it could ignite a substantial rally to unprecedented levels. XRP Analysis By Shayan The Weekly Chart After an extended accumulation phase within the %excerpt%.3–%excerpt%.9 range, Ripple witnessed intensified buying pressure, triggering a powerful surge. The price soared approximately 490% from the lowest levels, reclaiming multiple key resistance levels, including the pivotal mark. However, XRP now faces a significant supply zone around , where selling pressure could hinder further advances. Additionally, the RSI indicates overbought conditions, suggesting a likely consolidation phase within the
Topics:
CryptoVizArt considers the following as important: Ripple (XRP) Price, XRP Analysis, xrpbtc, xrpusd
This could be interesting, too:
Jordan Lyanchev writes Ripple’s (XRP) Surge to Triggers Over Million in Short Liquidations
Jordan Lyanchev writes Trump Confirms Work on Strategic Crypto Reserve: XRP, ADA, SOL Included
Dimitar Dzhondzhorov writes Is a Major Ripple v. SEC Lawsuit Development Expected This Week? Here’s Why
Mandy Williams writes Ripple Releases Institutional DeFi Roadmap for XRP Ledger in 2025
Ripple recently broke past its previous major swing high of $2, maintaining strong upward momentum and nearing its all-time high of $3.4.
This price zone is critical, as a breakout above it could ignite a substantial rally to unprecedented levels.
XRP Analysis
By Shayan
The Weekly Chart
After an extended accumulation phase within the $0.3–$0.9 range, Ripple witnessed intensified buying pressure, triggering a powerful surge. The price soared approximately 490% from the lowest levels, reclaiming multiple key resistance levels, including the pivotal $2 mark. However, XRP now faces a significant supply zone around $3, where selling pressure could hinder further advances.
Additionally, the RSI indicates overbought conditions, suggesting a likely consolidation phase within the $2–$3.4 range. This pause would allow the market to absorb selling pressure before buyers potentially mount a decisive attempt to break through this psychological resistance and set a new ATH.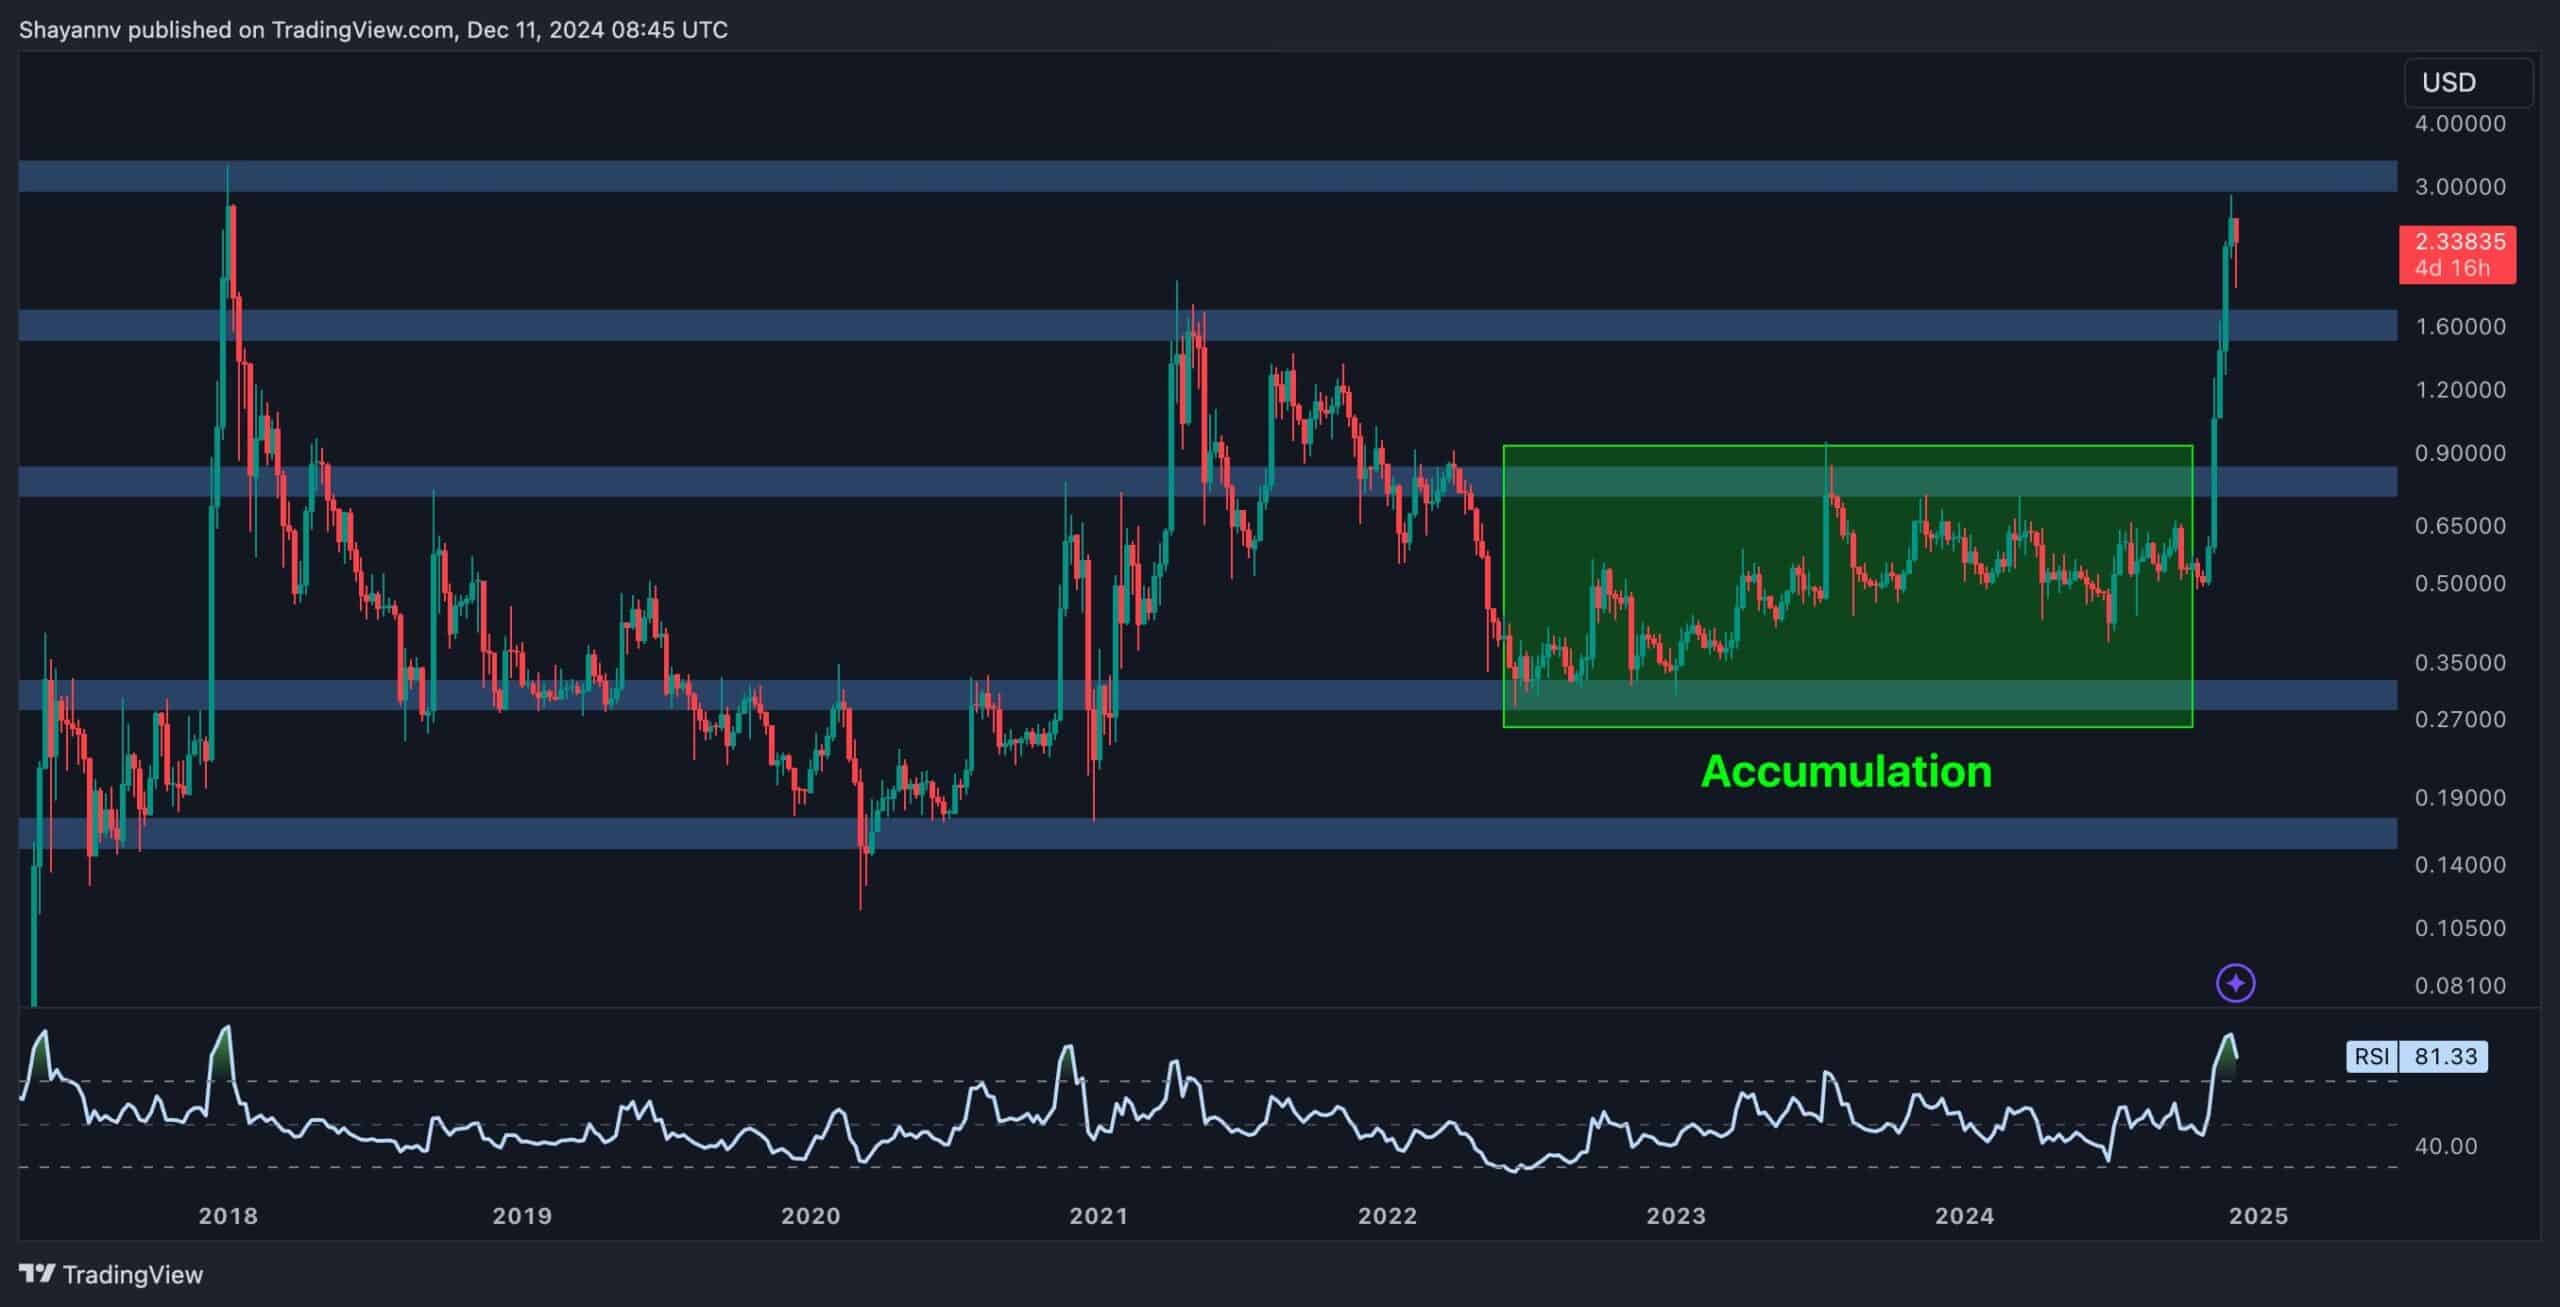
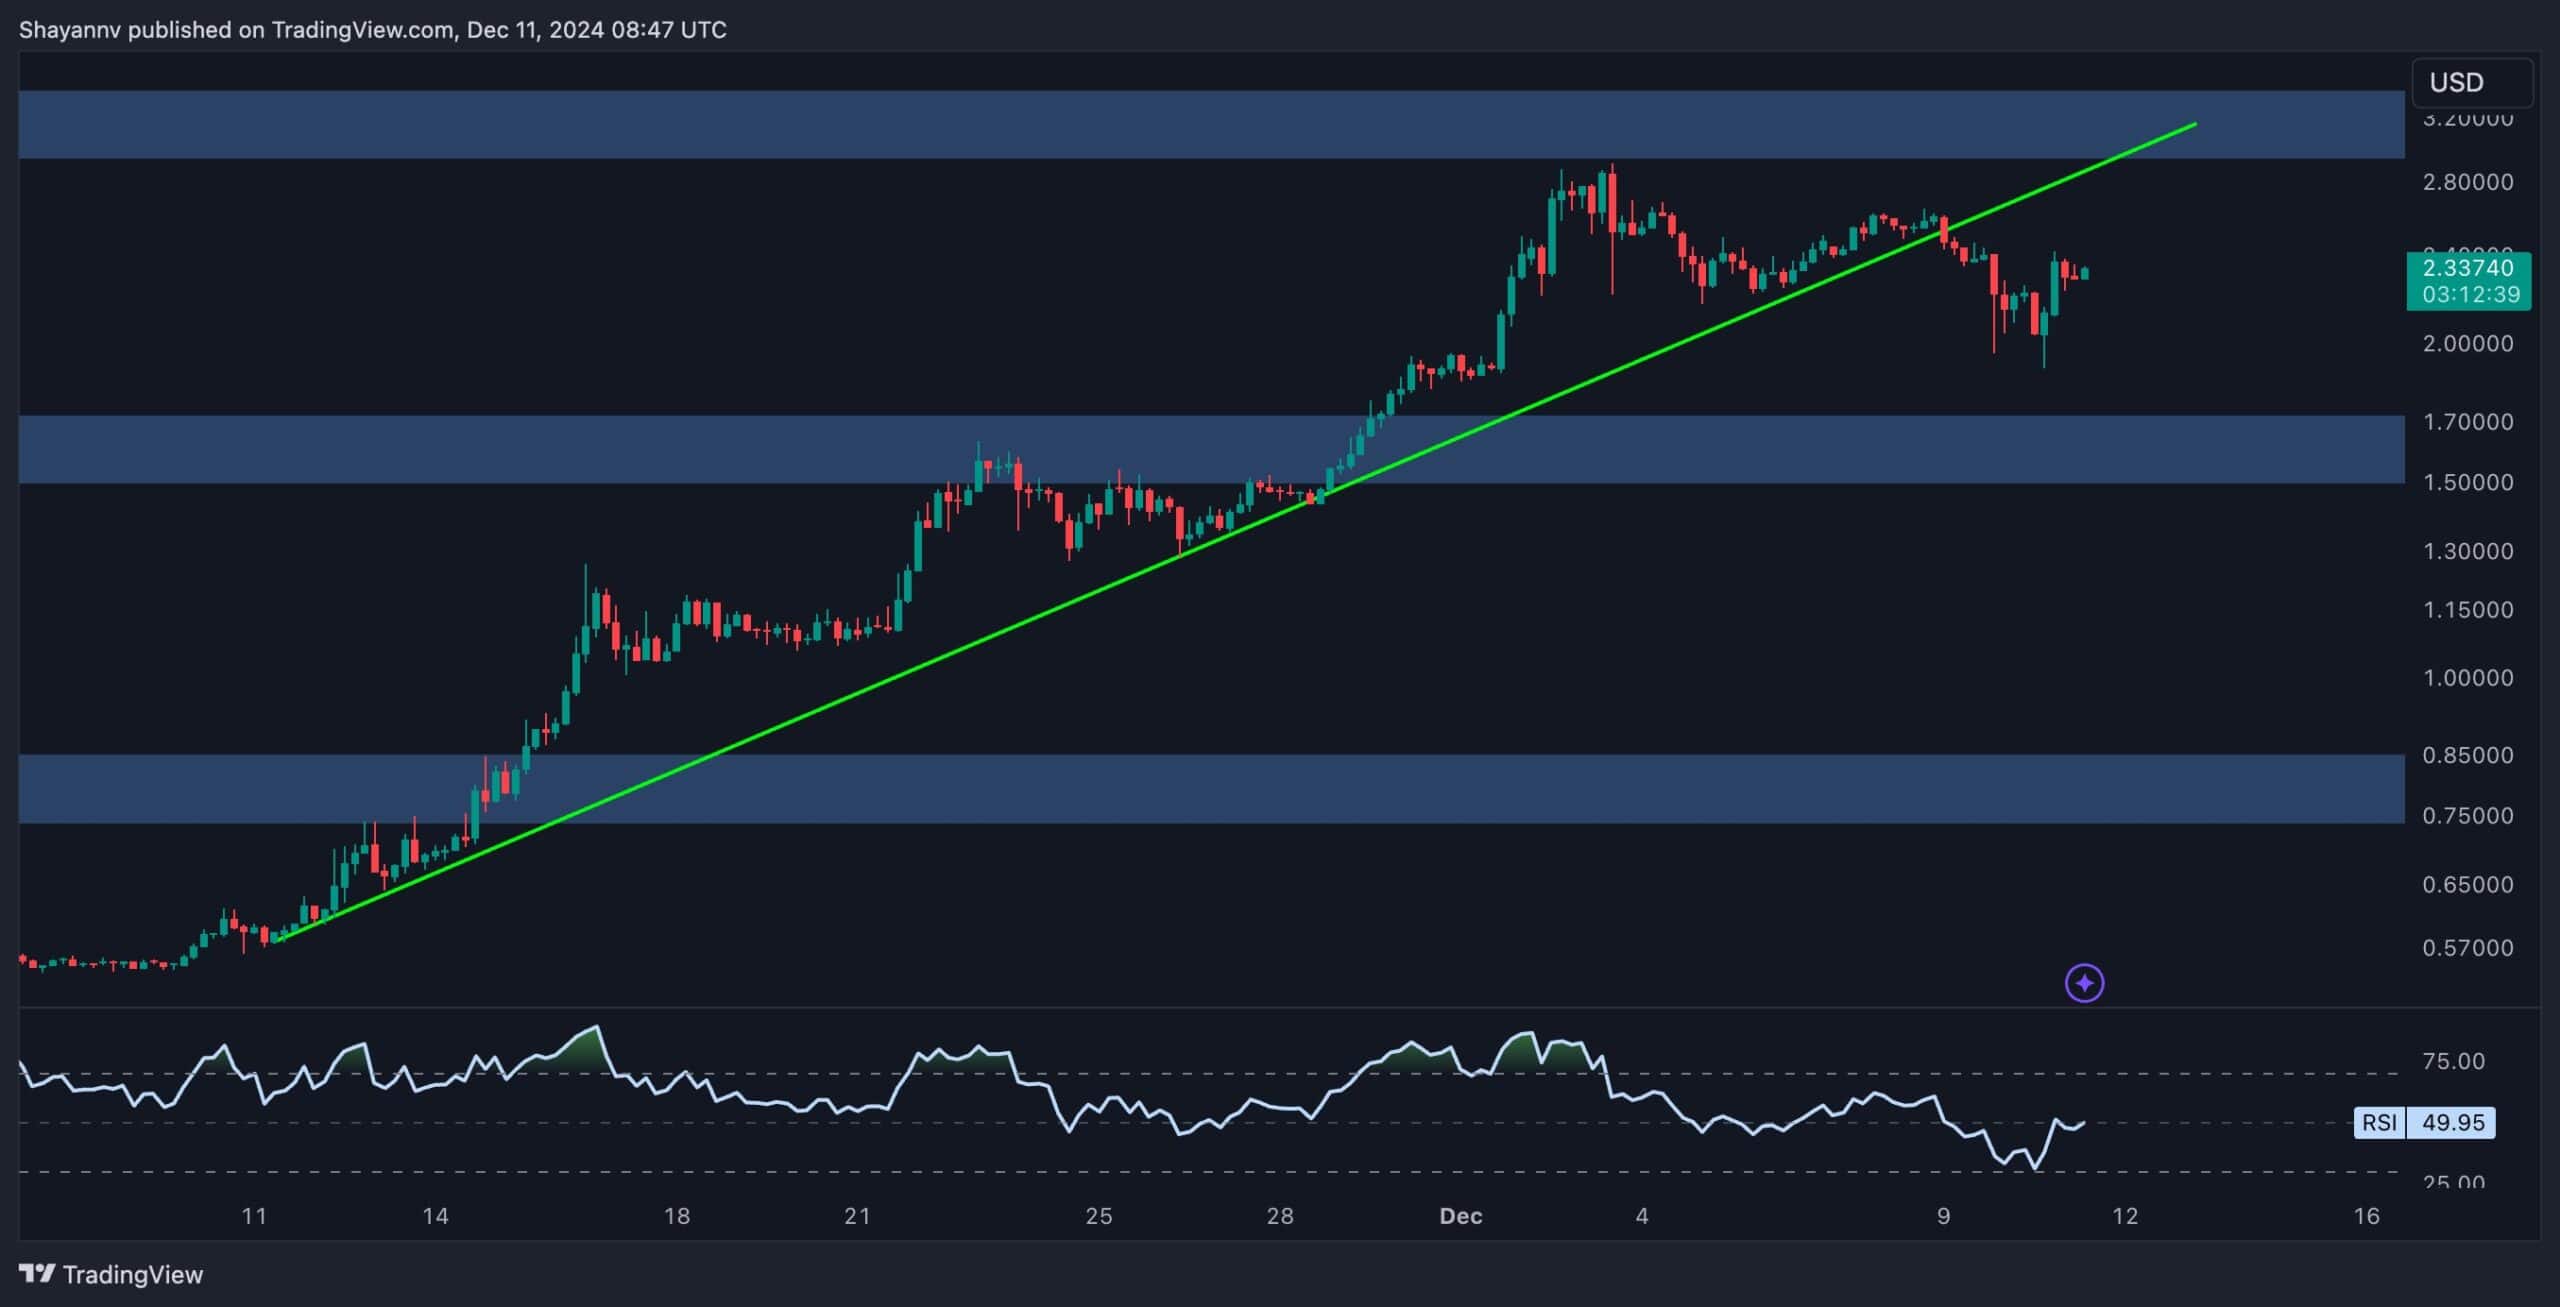
The 4-Hour Chart
On the 4-hour timeframe, XRP encountered strong resistance at the $3 region, triggering notable selling activity and a price rejection. This pullback signals a temporary loss of bullish momentum, possibly reflecting profit-taking and distribution among market participants.
Following the rejection, Ripple entered a consolidation phase, breaking below its multi-week ascending trendline. This development suggests increasing dominance of sellers and a likely corrective phase in the near term. Market volatility and fluctuations could intensify, with the $2 level acting as a critical support zone.
After this consolidation period, Ripple is expected to regain bullish traction, with another attempt to breach the $3 resistance likely on the horizon.