With buyers absent, BNB is struggling to hold above 0. Key Support levels: 6, 0 Key Resistance levels: 0, 0 1. Indecision Continues Binance Coin has not managed to move away from its key support just above 0. This is not ideal, as any new sell pressure could quickly test or even break this level. The price action also shows that sellers are having the upper hand right now. Chart by TradingView.2. Indicators Lean Bearish The volume and momentum indicators show weakness and are bearish on the daily timeframe. Generally speaking, volume was always higher on the sell side and this is reflected both on the RSI and OBV which remain low. Chart by TradingView.3. MACD Bearish Cross The daily MACD just did a bearish cross, further confirming that sellers appear to
Topics:
Duo Nine considers the following as important: Binance Coin (BNB) Price, BNBBTC, bnbusd, Price Analysis
This could be interesting, too:
Chayanika Deka writes Osprey Funds Launches First US Publicly Quoted BNB Trust
Chayanika Deka writes BNB Overtakes Solana to Secure 5th Spot by Market Cap After Historic Rally
CryptoVizArt writes ETH’s Path to K Involves Maintaining This Critical Support (Ethereum Price Analysis)
Dimitar Dzhondzhorov writes Binance to Temporarily Suspend Deposits and Withdrawals on BNB Smart Chain Soon: Here’s Why
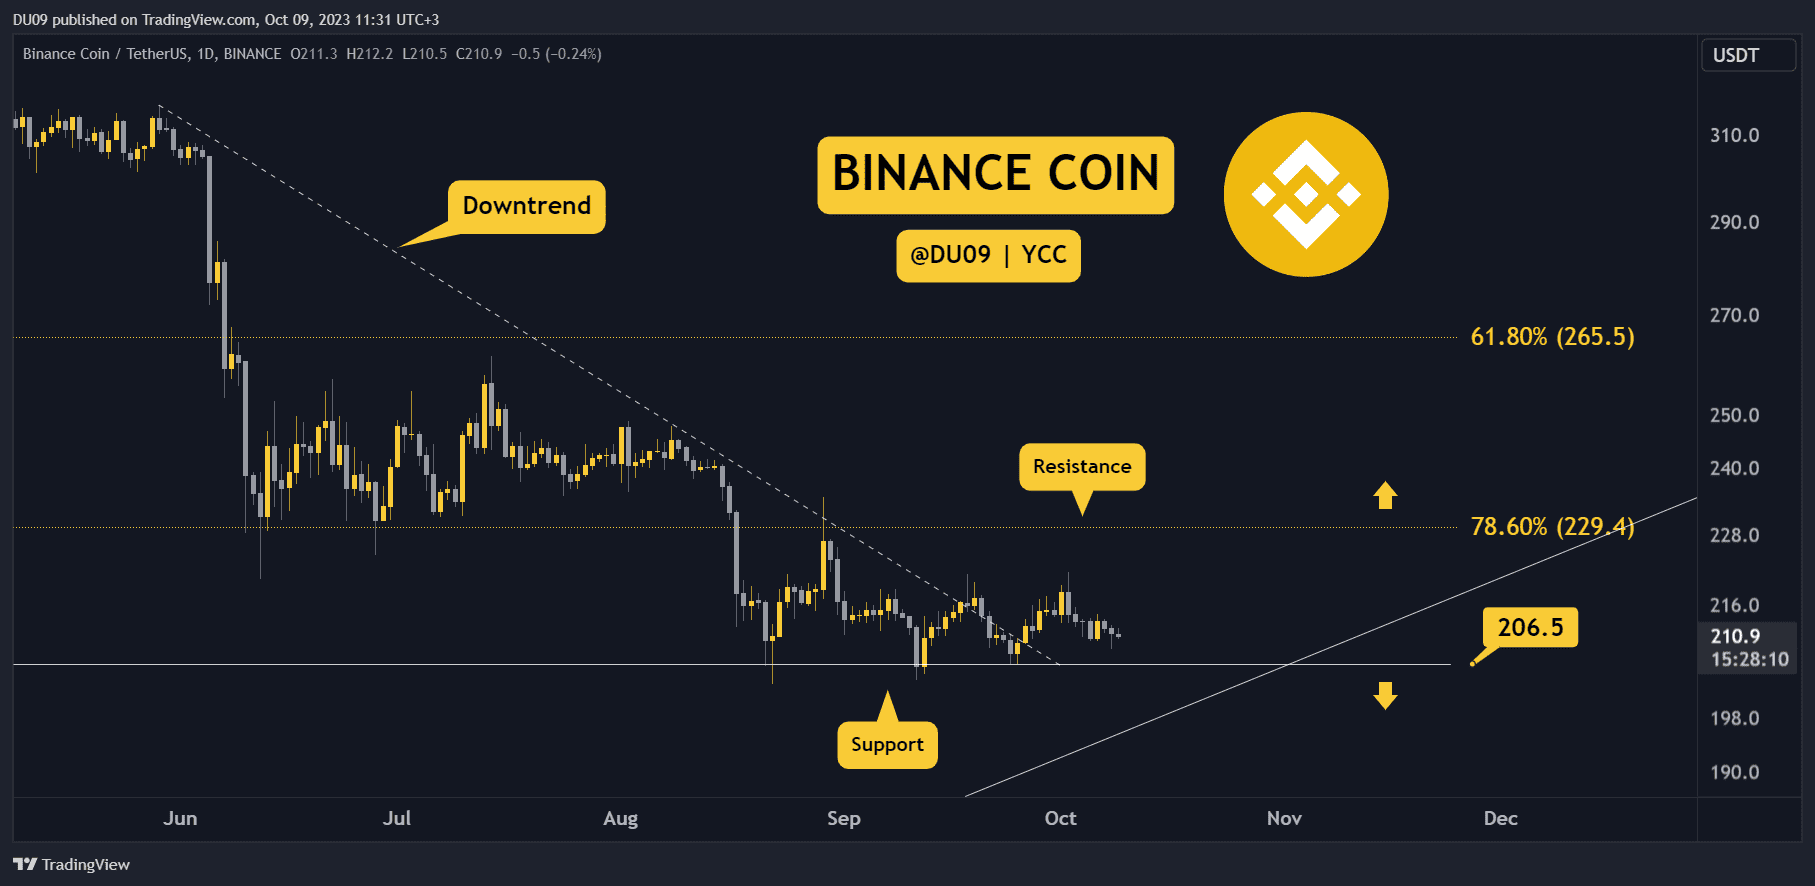
With buyers absent, BNB is struggling to hold above $200.
Key Support levels: $206, $180
Key Resistance levels: $220, $230
1. Indecision Continues
Binance Coin has not managed to move away from its key support just above $200. This is not ideal, as any new sell pressure could quickly test or even break this level. The price action also shows that sellers are having the upper hand right now.
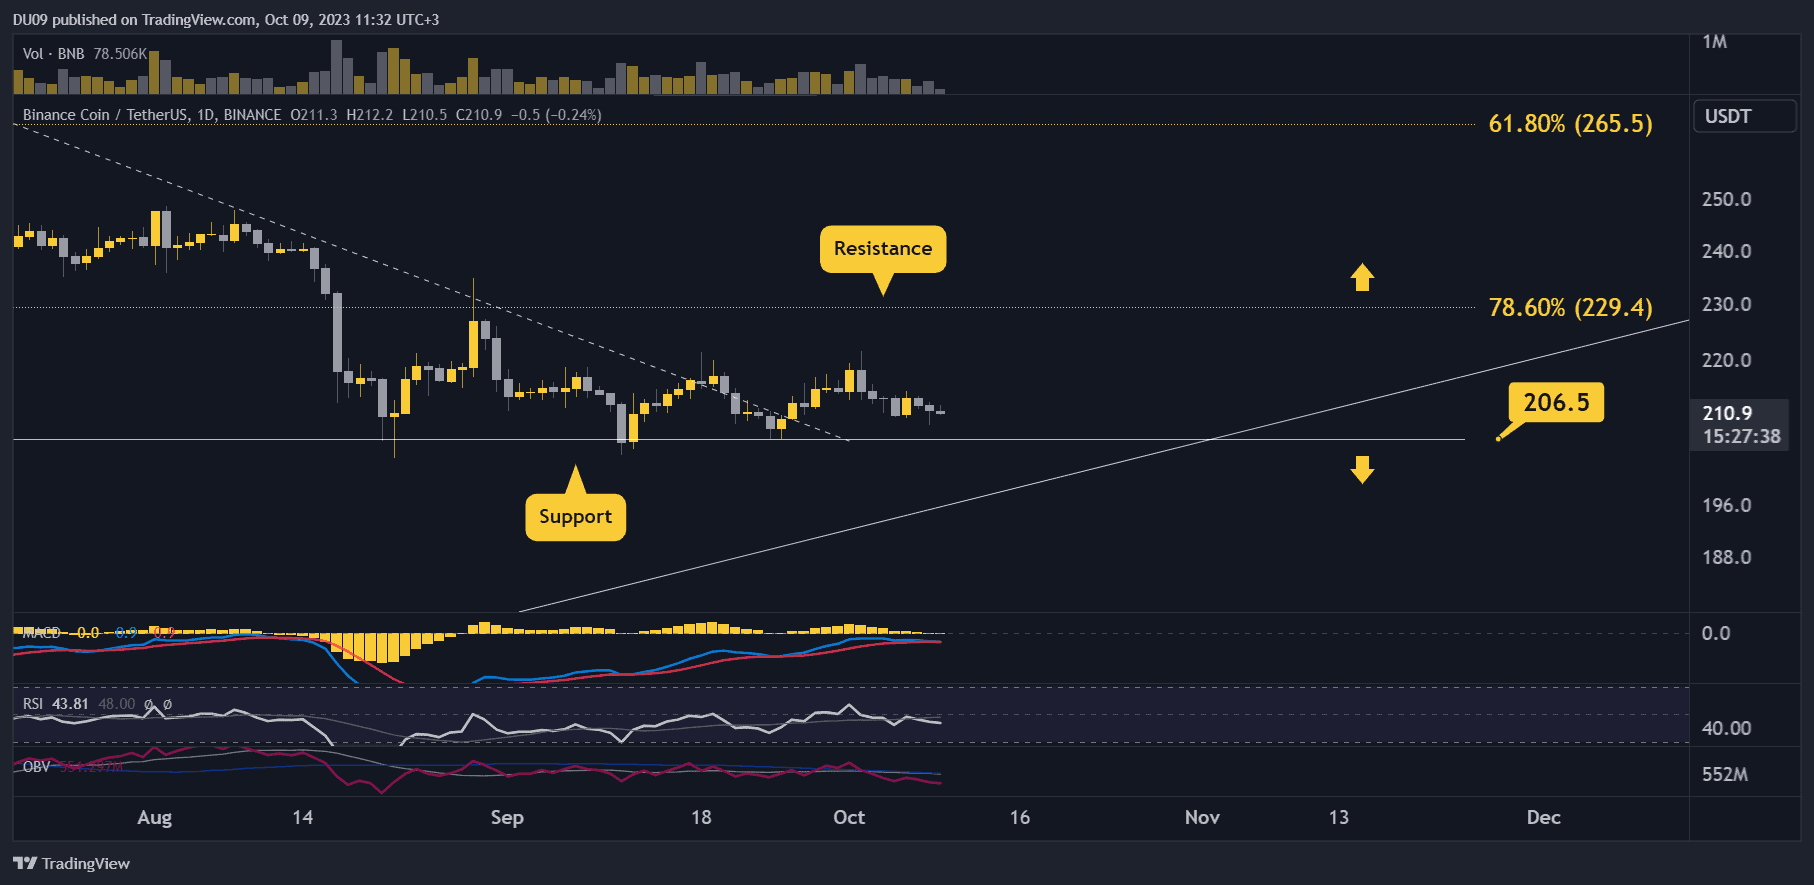
2. Indicators Lean Bearish
The volume and momentum indicators show weakness and are bearish on the daily timeframe. Generally speaking, volume was always higher on the sell side and this is reflected both on the RSI and OBV which remain low.
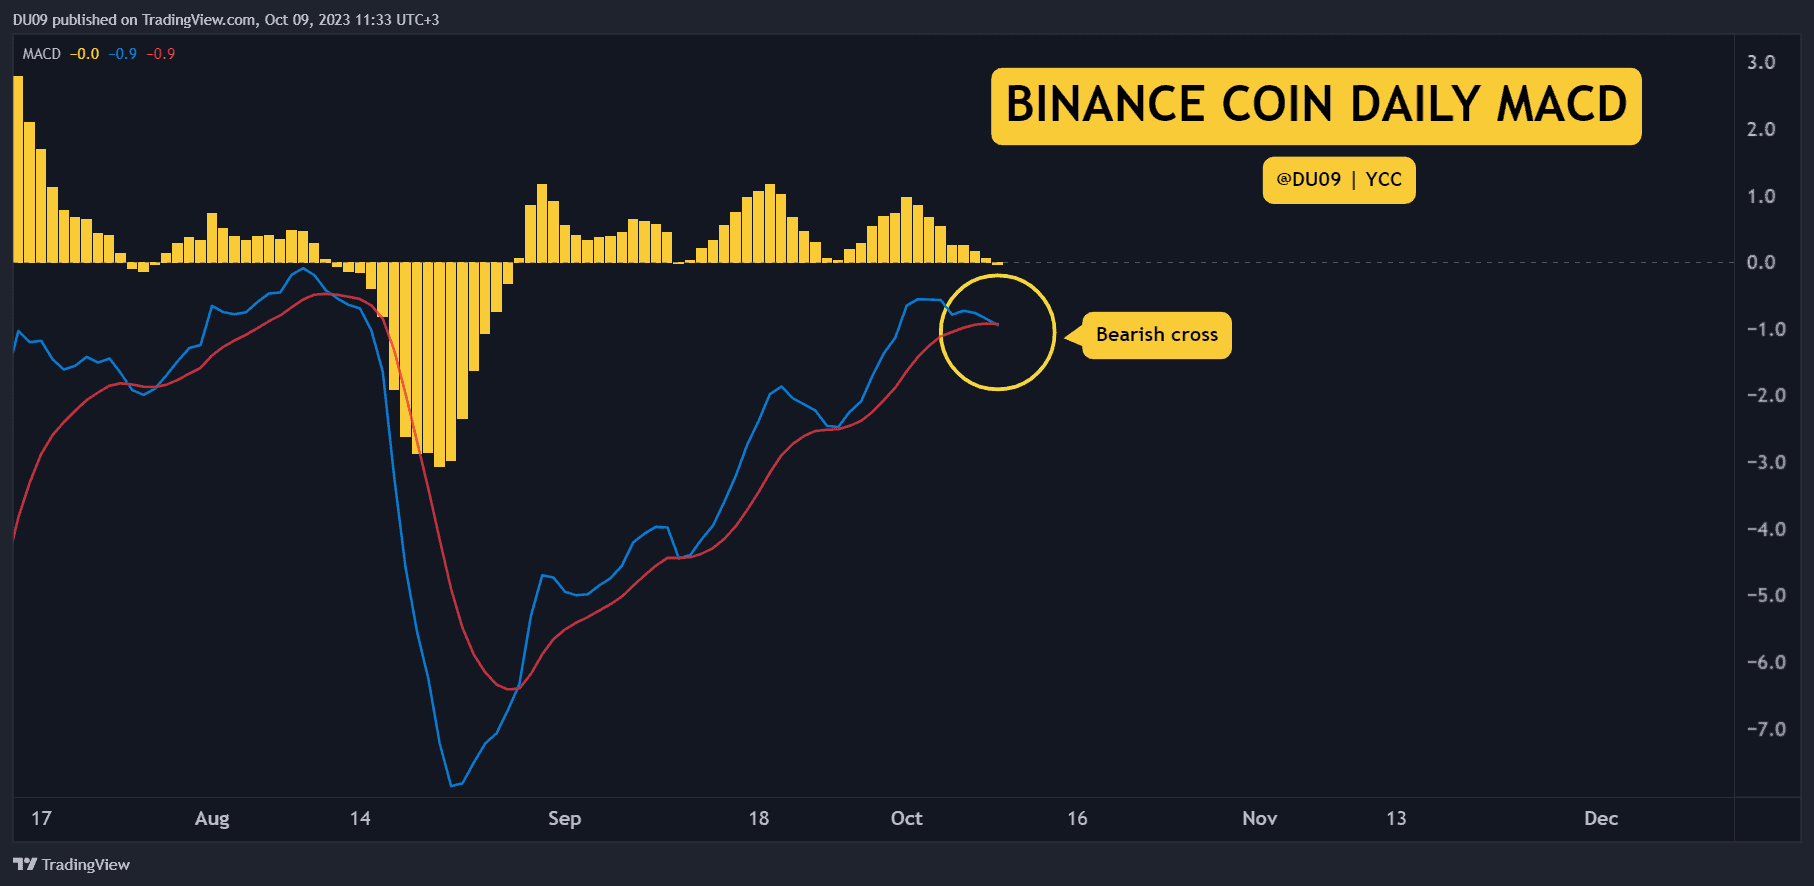
3. MACD Bearish Cross
The daily MACD just did a bearish cross, further confirming that sellers appear to dominate at this time. If buyers don’t return, then the key support at $206 is in danger.
Bias
The bias for BNB is bearish.
Short-Term Prediction for BNB Price
Prepare for another test of the key support at $206. If that breaks, then BNB’s price will likely move towards $180 next.