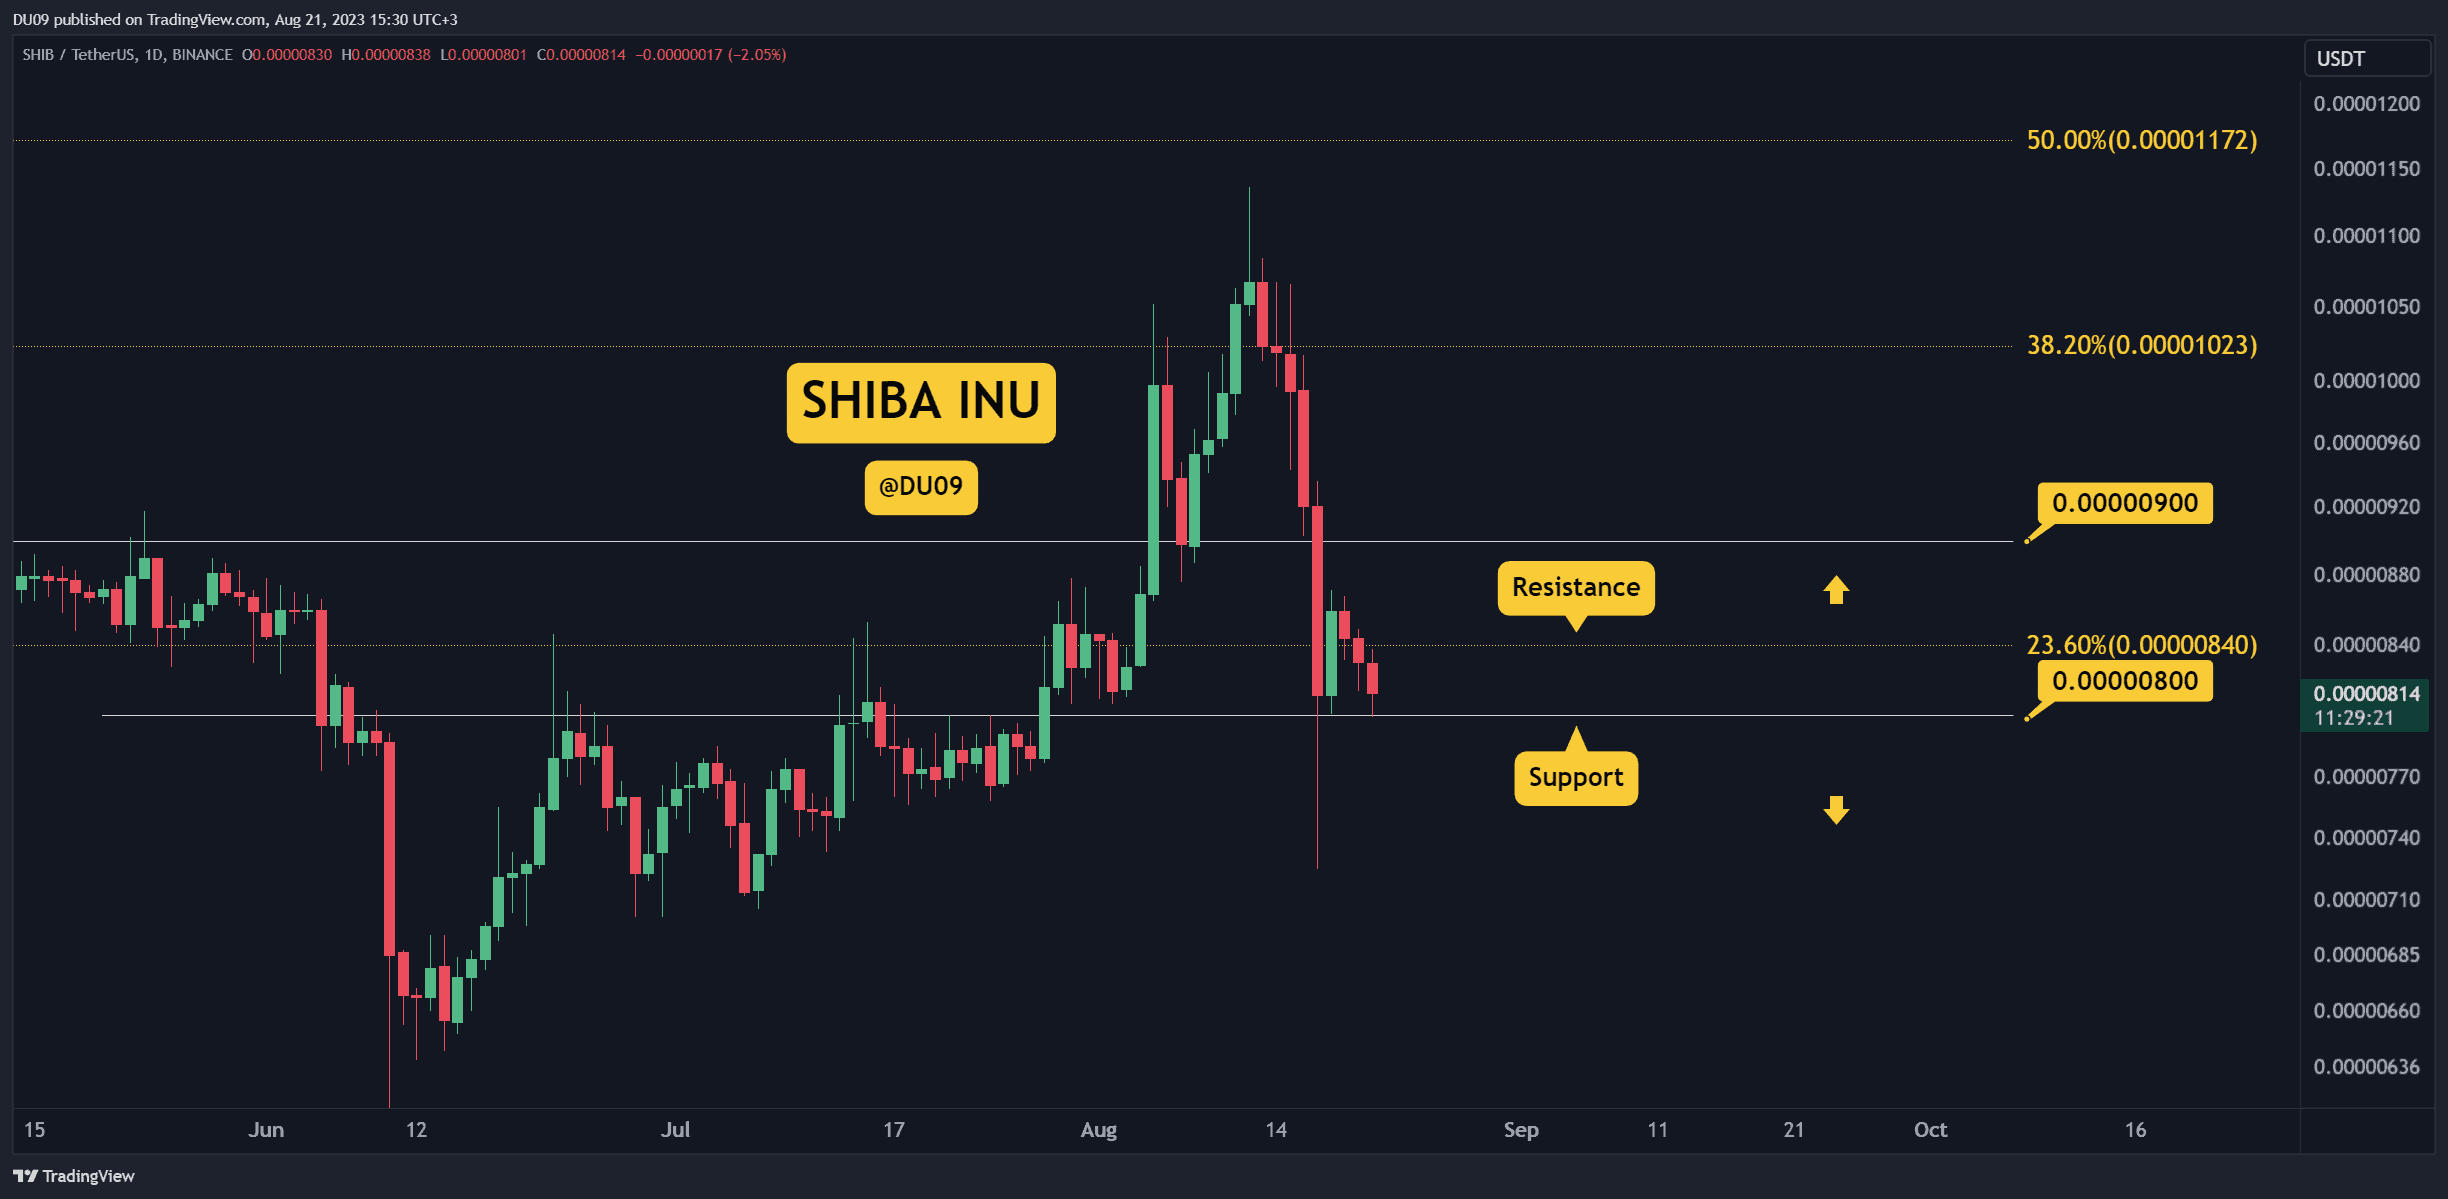
SHIB bounced, but failed to move above the key resistance. Key Support levels: %excerpt%.0000080, %excerpt%.0000070 Key Resistance levels: %excerpt%.0000085, %excerpt%.000010 1. Rejection at Key Resistance The price found support at %excerpt%.0000080 and tried to move higher but was quickly rejected once reaching the resistance at %excerpt%.0000085. Since then, the cryptocurrency fell back on the key support, which is now put under pressure again. Chart by TradingView2. Sellers Dominate In the past nine days, sellers managed to close eight daily candles in red. This shows that bears are dominating the chart right now, but in the past three days, the selling volume has been declining. This could be indicative that SHIB has reached a local bottom. Chart by TradingView3. Bearish Bias Continues While the intensity of
Topics:
Duo Nine considers the following as important: Price Analysis, Shiba Inu (SHIB), SHIBBTC, SHIBUSD
This could be interesting, too:
Dimitar Dzhondzhorov writes Watch Out: Shiba Inu (SHIB) Team Issues a Major Warning to the Community
Dimitar Dzhondzhorov writes Shiba Inu (SHIB) Might Plunge by Another 30% Before Finding Support (Analyst)
Jordan Lyanchev writes Shiba Inu Price Forecasts: Another 50% Crash or 420% Rally Ahead for SHIB?
Dimitar Dzhondzhorov writes This Trader Made Over Million by Selling Shiba Inu (SHIB) Holdings: Details
SHIB bounced, but failed to move above the key resistance.
Key Support levels: $0.0000080, $0.0000070
Key Resistance levels: $0.0000085, $0.000010
1. Rejection at Key Resistance
The price found support at $0.0000080 and tried to move higher but was quickly rejected once reaching the resistance at $0.0000085. Since then, the cryptocurrency fell back on the key support, which is now put under pressure again.
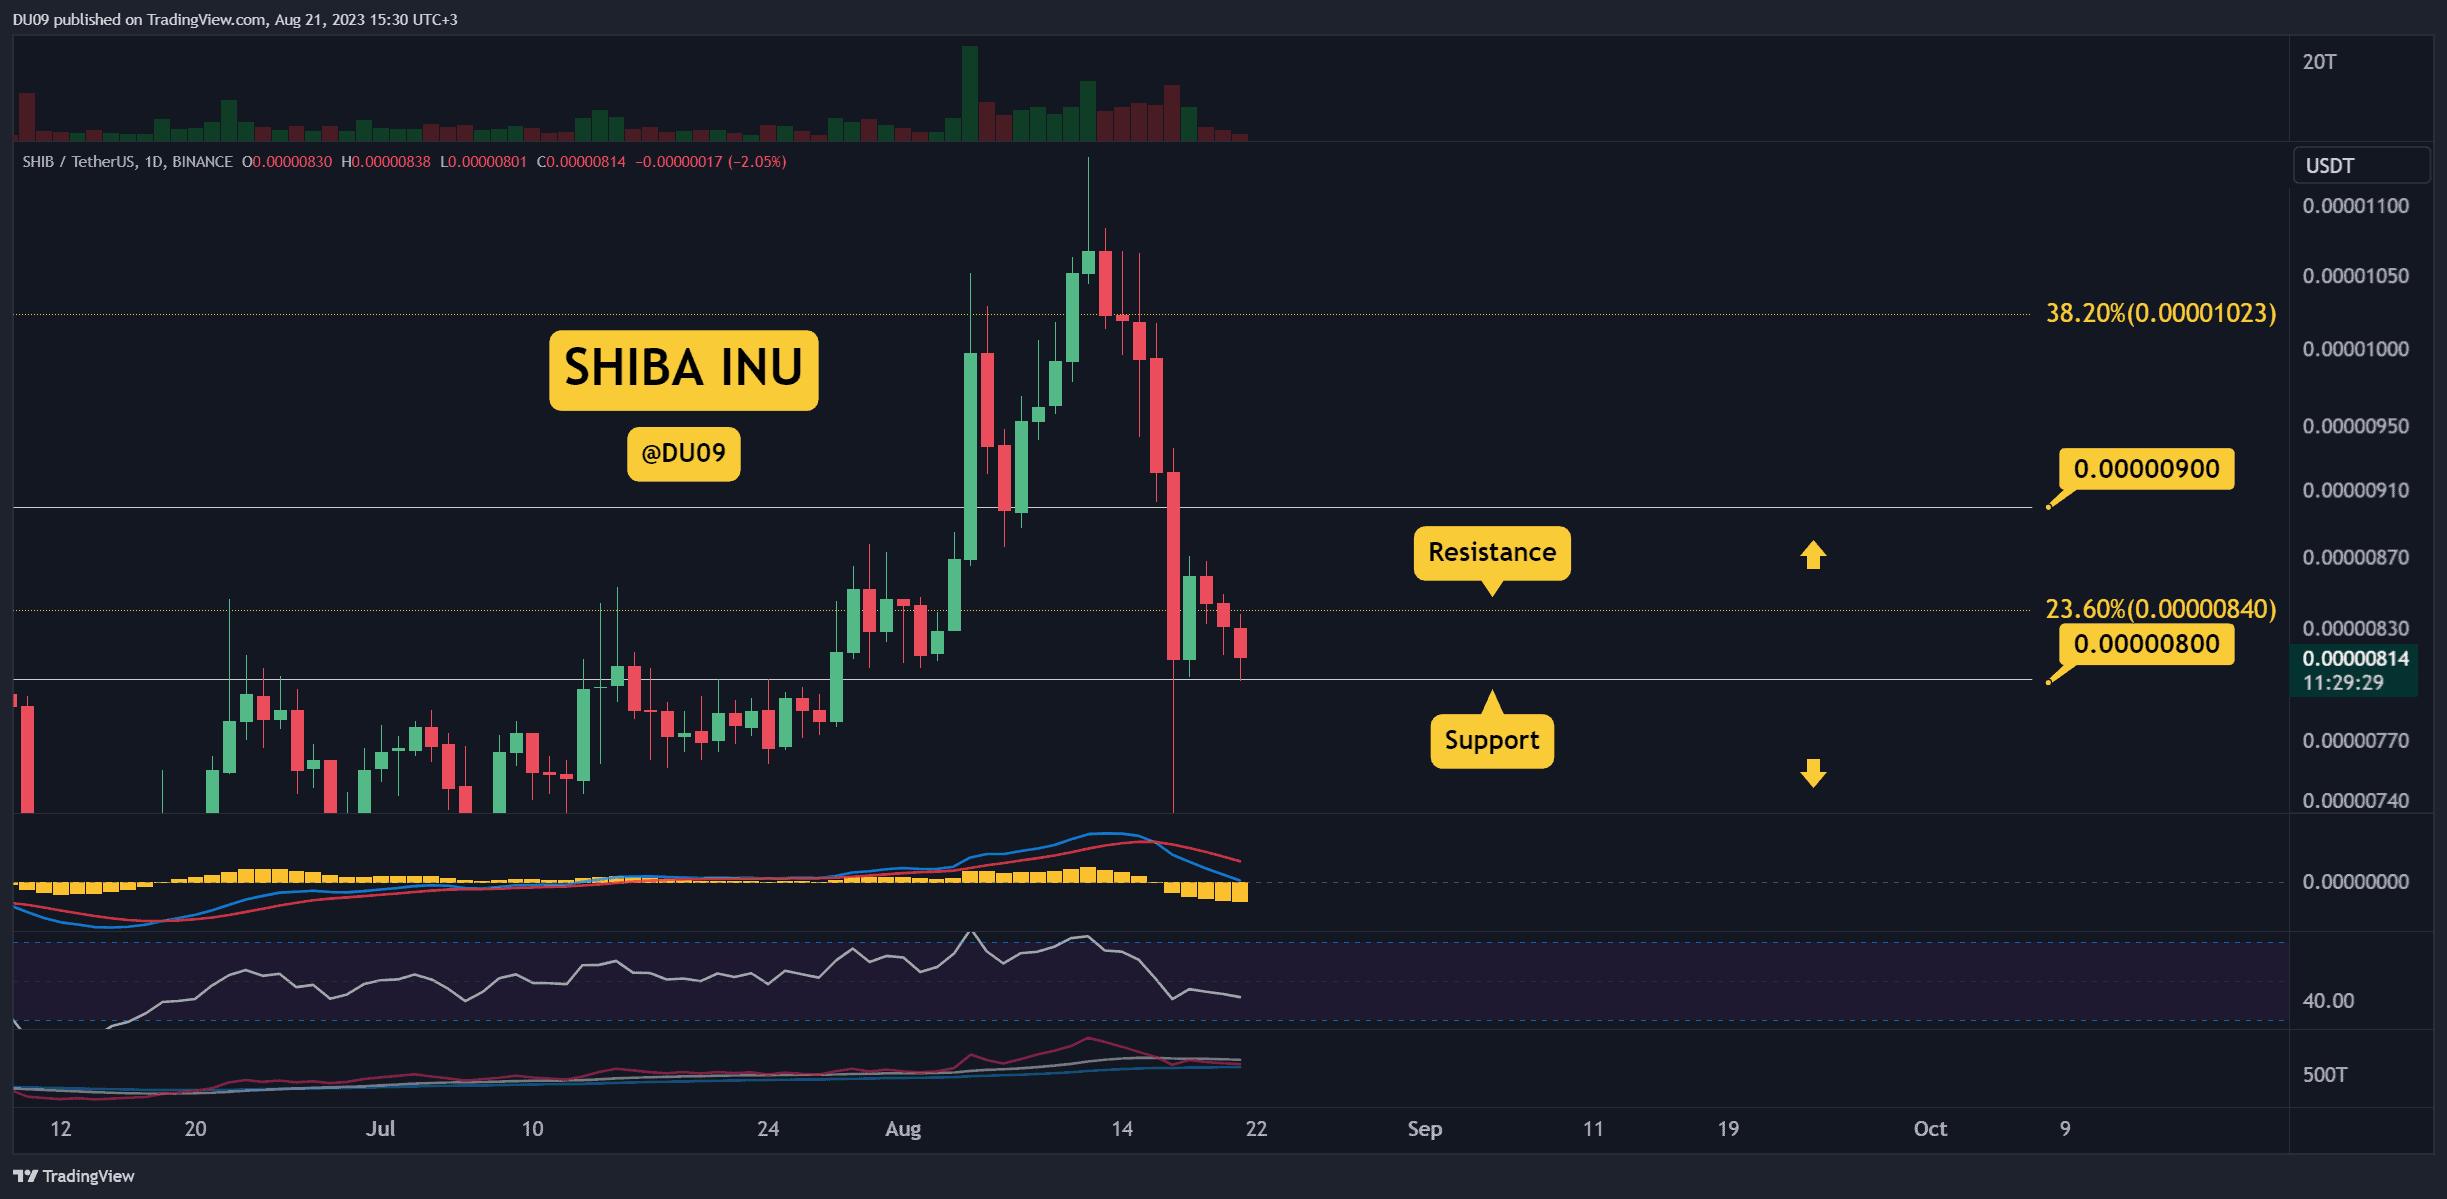
2. Sellers Dominate
In the past nine days, sellers managed to close eight daily candles in red. This shows that bears are dominating the chart right now, but in the past three days, the selling volume has been declining. This could be indicative that SHIB has reached a local bottom.
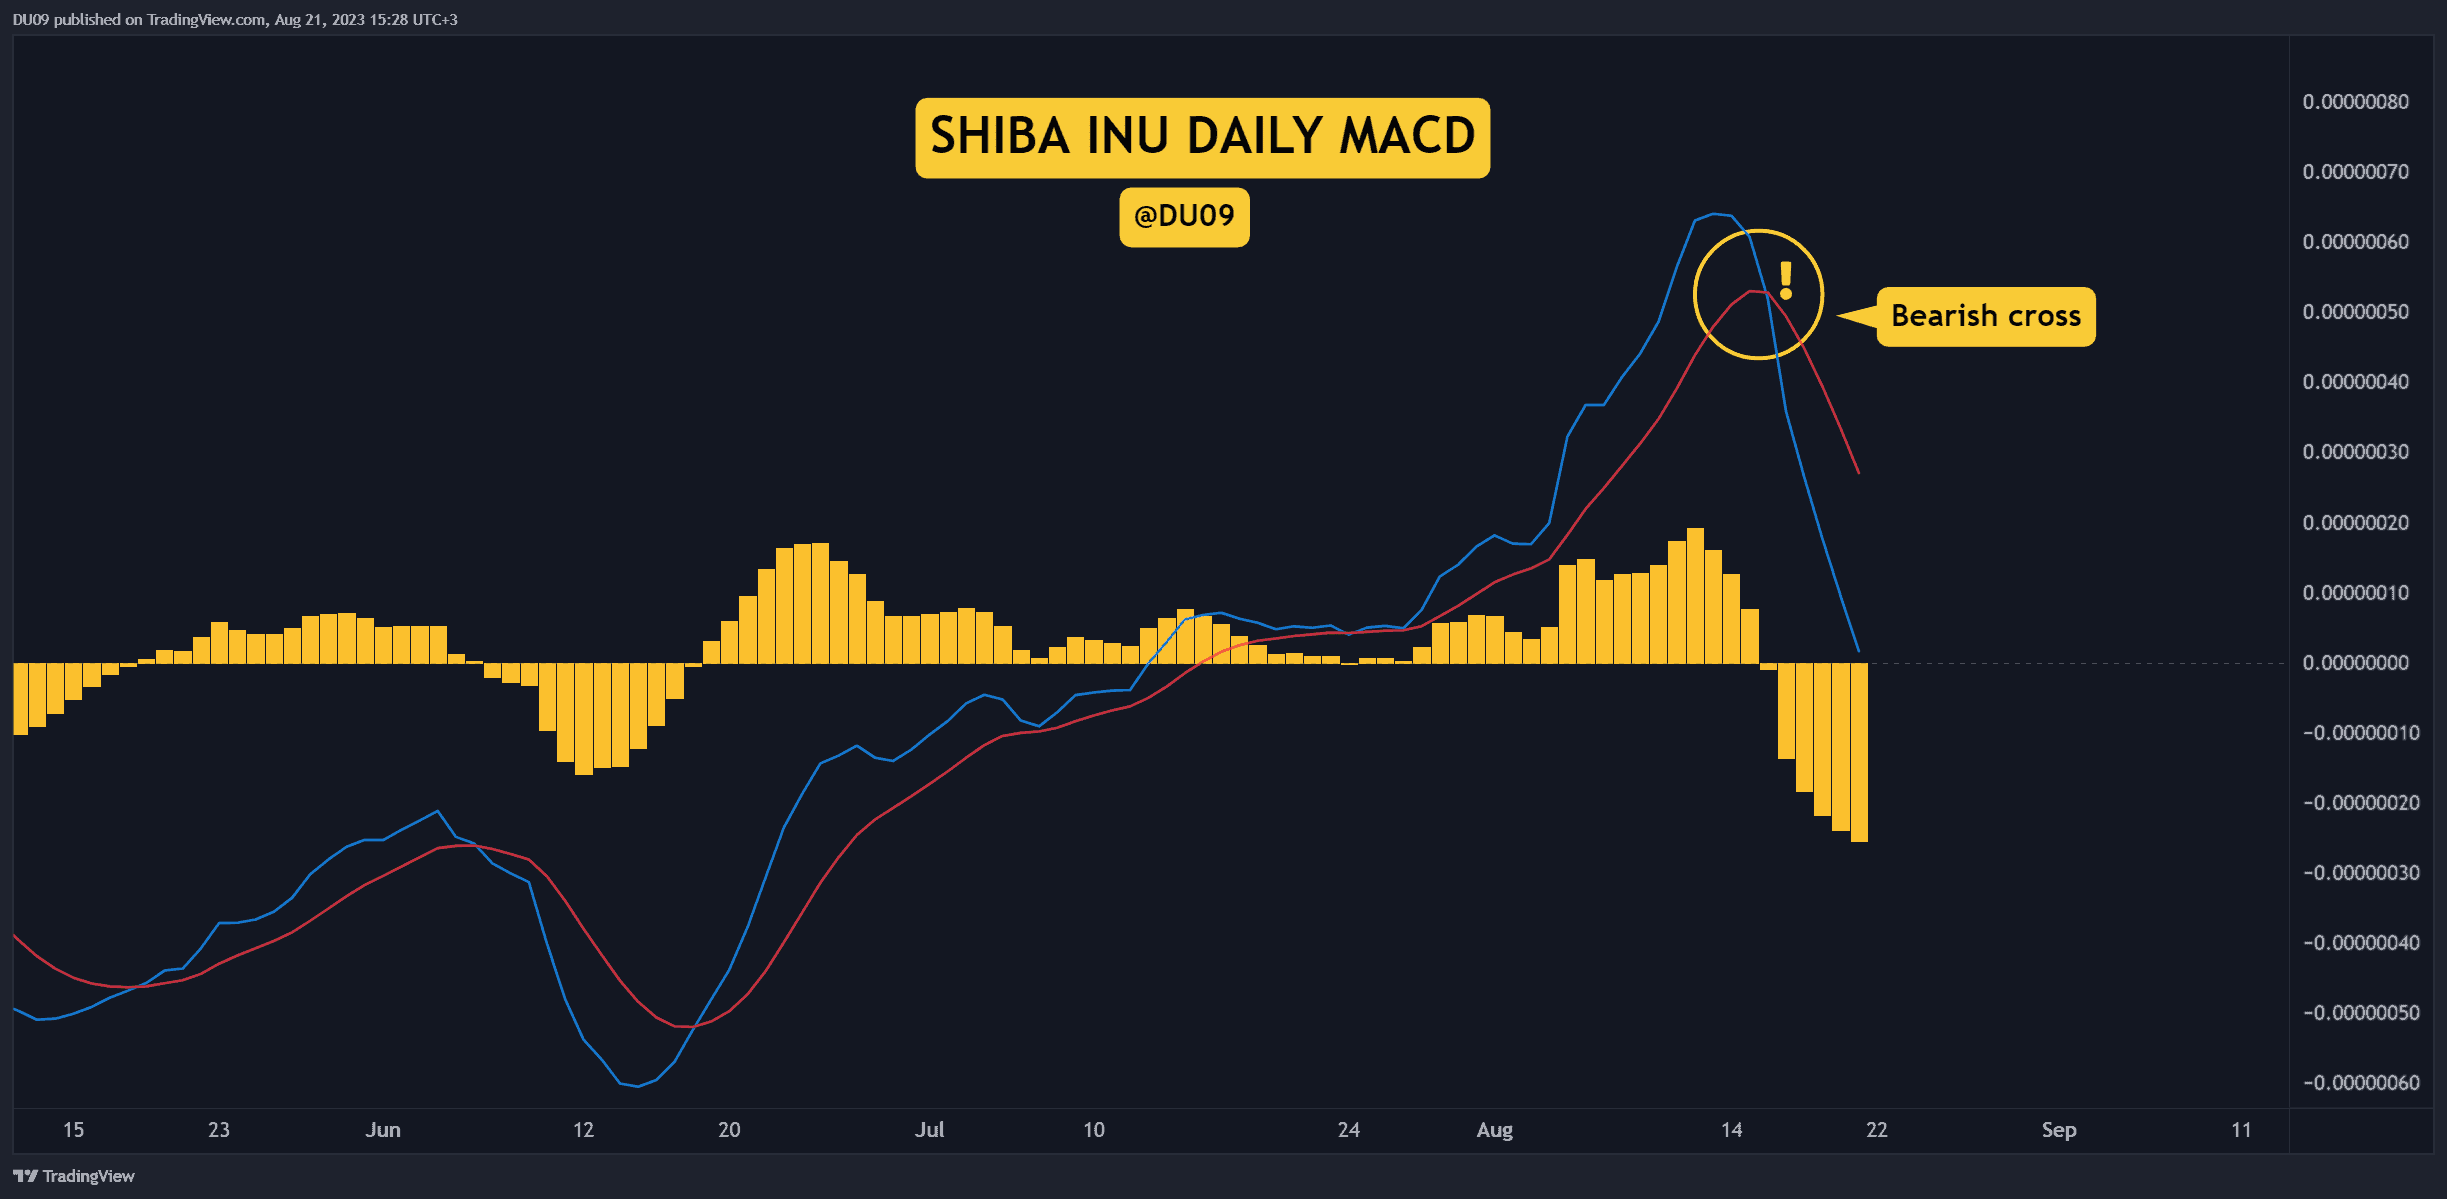
3. Bearish Bias Continues
While the intensity of the selloff has subsided in the past few days, the momentum indicators, such as the daily MACD, still give a bearish signal. The MACD histogram has not yet made a higher low, but this appears likely if sellers start to lose interest. This could be an opportunity for buyers to return.
Bias
The bias for SHIB is bearish.
Short-Term Prediction for SHIB Price
The support at $0.0000080 must hold if SHIB is to stop this downtrend. If broken, the price can quickly fall to $0.0000070 next. The resistance remains at $0.0000085 and has so far stopped any reversal attempts.