SHIB has recently broken below an ascending trendline which maintained the price for the past eight days, since the 23rd of October. Following a 13% daily decrease, Shiba Inu is now more than 25% far below Thursday’s all-time high level and currently facing the %excerpt%.000060 key support. Key Support level: %excerpt%.000060 Key Resistance level: %excerpt%.000066 After Shiba’s massive rally in the past weeks, the price has initiated a deep correction and has managed to find support above the %excerpt%.000060 level. The price action has now formed a large descending triangle (this pattern tends to break down in most cases), as shown in the chart below. The closest resistance is found at %excerpt%.000066. If broken, Shiba will likely attempt to break out of the triangle to the bullish side. Technical
Topics:
Duo Nine considers the following as important: Price Analysis, Shiba Inu (SHIB), SHIBBTC, SHIBUSD
This could be interesting, too:
Dimitar Dzhondzhorov writes This Trader Made Over Million by Selling Shiba Inu (SHIB) Holdings: Details
Dimitar Dzhondzhorov writes Shiba Inu (SHIB) Drops by 15% in 2 Weeks: These Factors Suggest Extended Correction
Jordan Lyanchev writes Meme Coin Bloodbath: BONK, FLOKI, WIF, SHIB, and DOGE Crash by Double Digits
Dimitar Dzhondzhorov writes Shiba Inu’s Shibarium Reaches a New Milestone: Details
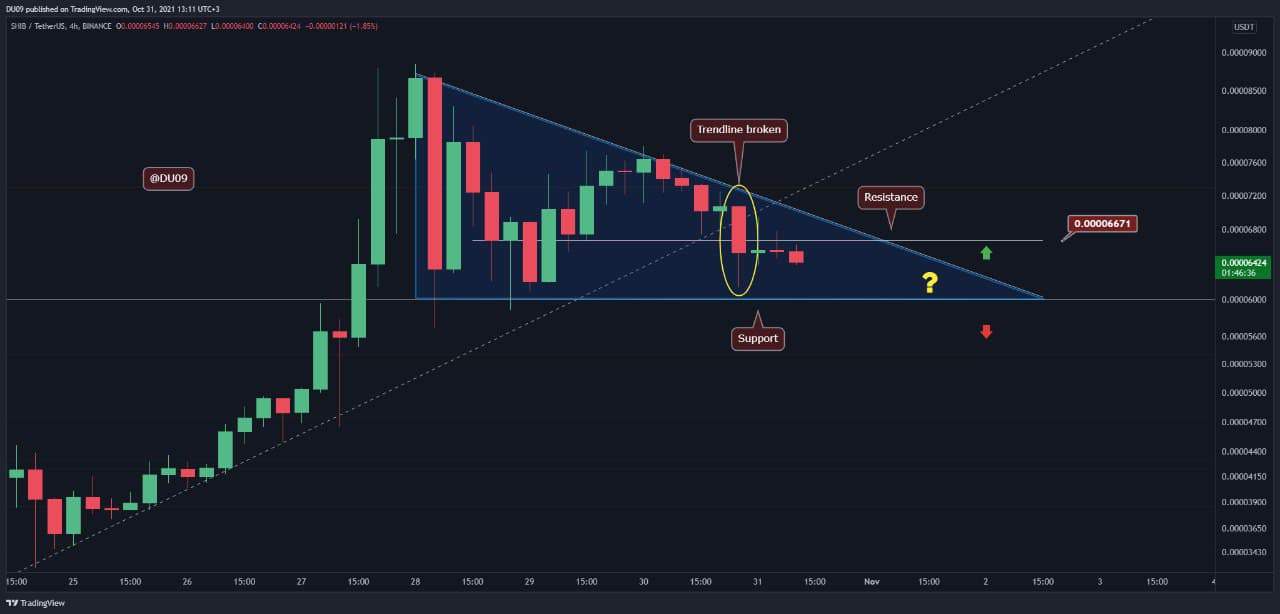
SHIB has recently broken below an ascending trendline which maintained the price for the past eight days, since the 23rd of October. Following a 13% daily decrease, Shiba Inu is now more than 25% far below Thursday’s all-time high level and currently facing the $0.000060 key support.
Key Support level: $0.000060
Key Resistance level: $0.000066
After Shiba’s massive rally in the past weeks, the price has initiated a deep correction and has managed to find support above the $0.000060 level. The price action has now formed a large descending triangle (this pattern tends to break down in most cases), as shown in the chart below.
The closest resistance is found at $0.000066. If broken, Shiba will likely attempt to break out of the triangle to the bullish side.
Technical Indicators of SHIB Price
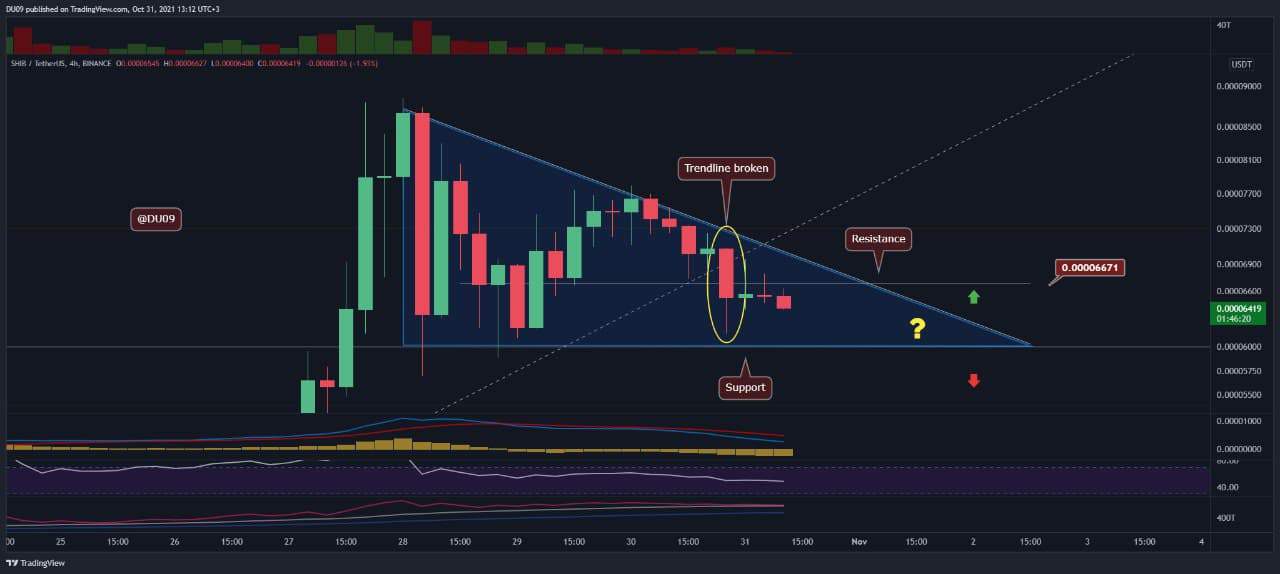
Trading Volume: Volume has decreased during the descending triangle formation after recording massive amounts of daily volume over the past days. This is definitely not bullish, nor it is too bearish. Volume needs to pick up to give strength to any price direction.
RSI: On the 4-hour timeframe, the RSI is decreasing and it is likely for the price to retest the mentioned support level before a possible reversal is likely to occur.
MACD: The MACD is bearish on the 4-hour timeframe, and the MACD histogram is making lower highs on the daily timeframe. This is not a positive sign for the bulls and further consolidation can take place before any breakout from this formation.
Bias
After extreme euphoria, as mentioned in our previous SHIB analysis, the bias on Shiba has changed to neutral. The critical level is the next major support at $0.000060 needs to break.
Short-Term Prediction for SHIB Price
Expect to see Shiba at $0.000060 for some consolidation before any chance to resume the uptrend. This may present some interesting buy opportunities for Shiba, mainly if the price drops to lower levels. It is best to wait for the triangle to break before taking any position. Such a break can lead to high volatility upon breakout.