BNB/USD – Bulls Eye Triangle Breakout Key Support Levels: 0, 7, 0.Key Resistance Levels: 0, 8, 0. BNB is performing well this week as it climbs back into the 0 resistance today. The cryptocurrency had been at this level last week but failed to close a daily candle above it. As a result, BNB headed lower until finding support at 7 (.382 Fib & 20-days MA) over the weekend. It rebounded from the 20-days MA on Monday and started to climb higher to reach 0 today. This is the highest daily closing price on record and it has formed an ascending triangle pattern. A closing candle today above 0 would signal a breakout of this triangle and could push BNB toward 0. BNB/USD Daily Chart. Source: TradingViewBNB-USD Short Term Price Prediction Moving
Topics:
Yaz Sheikh considers the following as important: BNBBTC, bnbusd, Price Analysis
This could be interesting, too:
Chayanika Deka writes Osprey Funds Launches First US Publicly Quoted BNB Trust
Chayanika Deka writes BNB Overtakes Solana to Secure 5th Spot by Market Cap After Historic Rally
CryptoVizArt writes ETH’s Path to K Involves Maintaining This Critical Support (Ethereum Price Analysis)
Dimitar Dzhondzhorov writes Binance to Temporarily Suspend Deposits and Withdrawals on BNB Smart Chain Soon: Here’s Why
BNB/USD – Bulls Eye Triangle Breakout
Key Support Levels: $180, $157, $150.
Key Resistance Levels: $200, $218, $240.
BNB is performing well this week as it climbs back into the $600 resistance today. The cryptocurrency had been at this level last week but failed to close a daily candle above it. As a result, BNB headed lower until finding support at $477 (.382 Fib & 20-days MA) over the weekend.
It rebounded from the 20-days MA on Monday and started to climb higher to reach $600 today. This is the highest daily closing price on record and it has formed an ascending triangle pattern. A closing candle today above $600 would signal a breakout of this triangle and could push BNB toward $700.
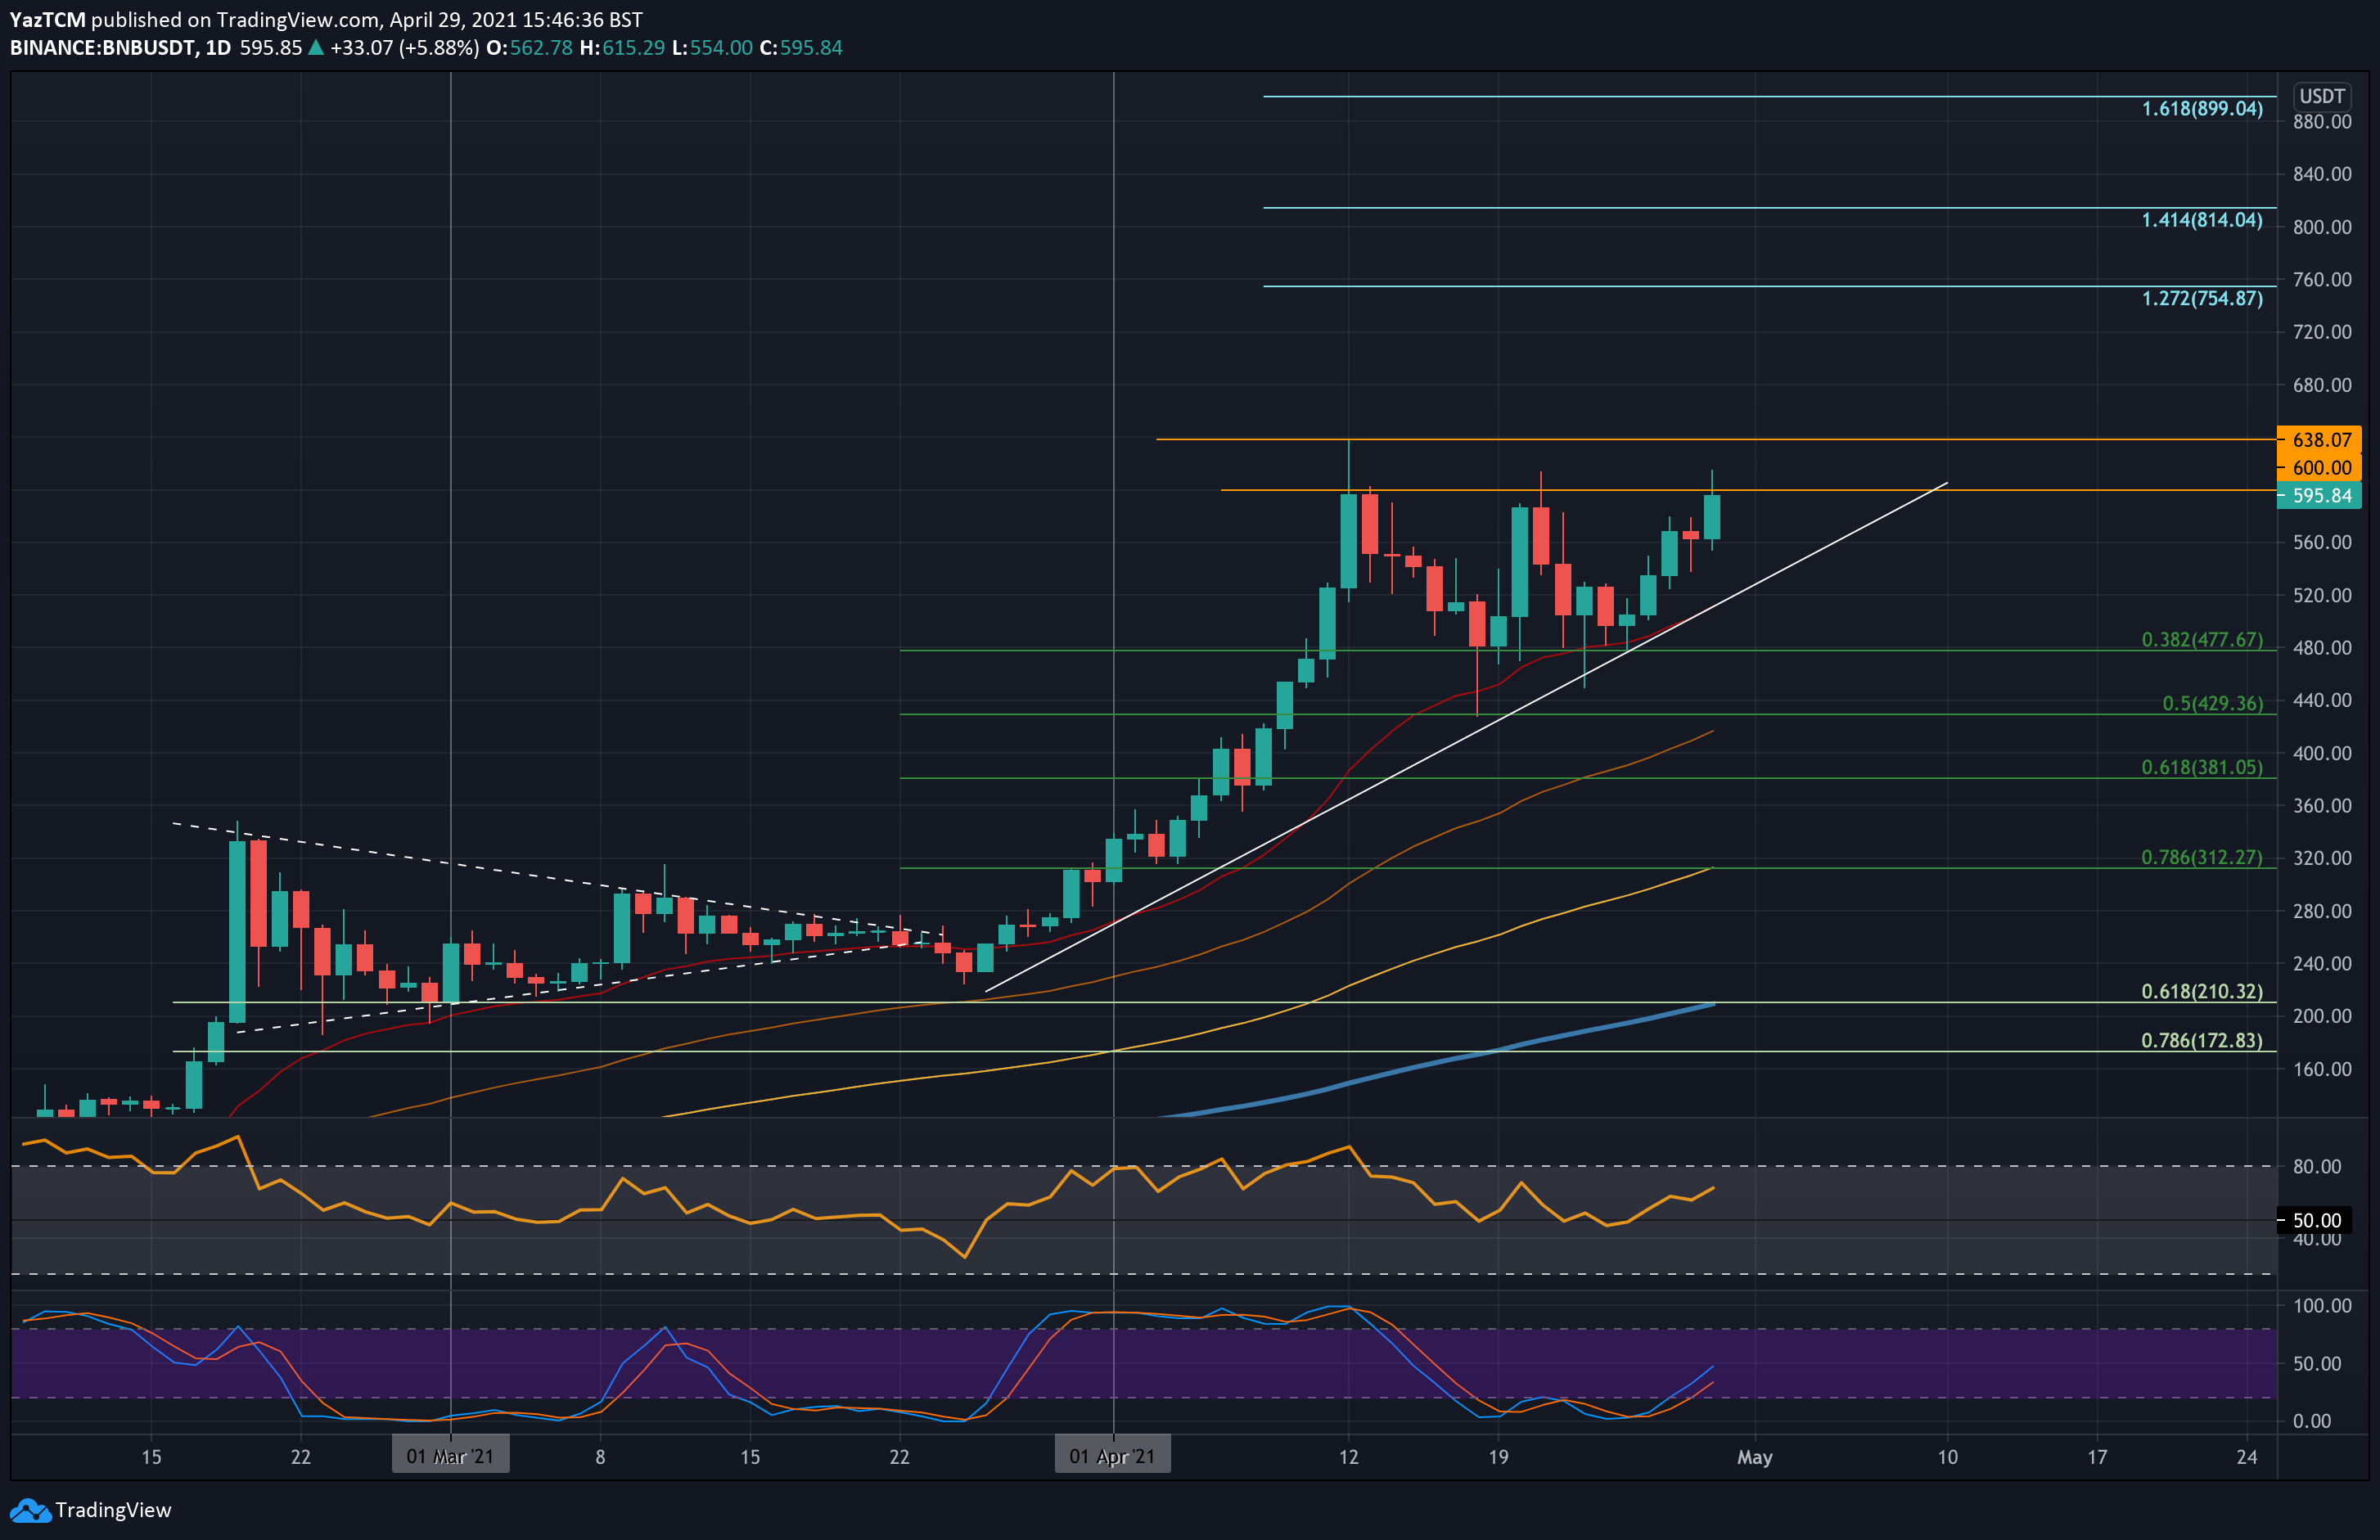
BNB-USD Short Term Price Prediction
Moving forward, the first resistance lies at $600. Beyond this, resistance lies at $638 (ATH price), $680, and $700. Additional resistance is found at $755 (1.272 Fib Extension) and $780.
On the other side, the first support lies at $560. This is followed by the lower boundary of the triangle pattern. Beneath the triangle, support lies at $520, $500, $477 (.382 Fib), and $430 (.5 Fib).
The RSI is above the midline, indicating the bulls control the market momentum. Additionally, the Stochastic RSI also produced a bullish crossover signal.
BNB/BTC – Bulls Break Above Triangle and Set New Highs
Key Support Levels: 0.0034 BTC, 0.00316 BTC, 0.003 BTC.
Key Resistance Levels: 0.00371 BTC, 0.00386 BTC, 0.00401 BTC.
Against bitcoin, BNB managed to break above its ascending triangle pattern after pushing above the roof of the pattern at 0.0105 BTC today. The cryptocurrency had been trading in a narrow range between 0.0105 BTC and support at 0.00988 BTC for the past week.
The latest breakout signals the next move for BNB/BTC and shows the bulls are ready for another bullish push higher as it sets new ATH prices today at 0.0113 BTC.
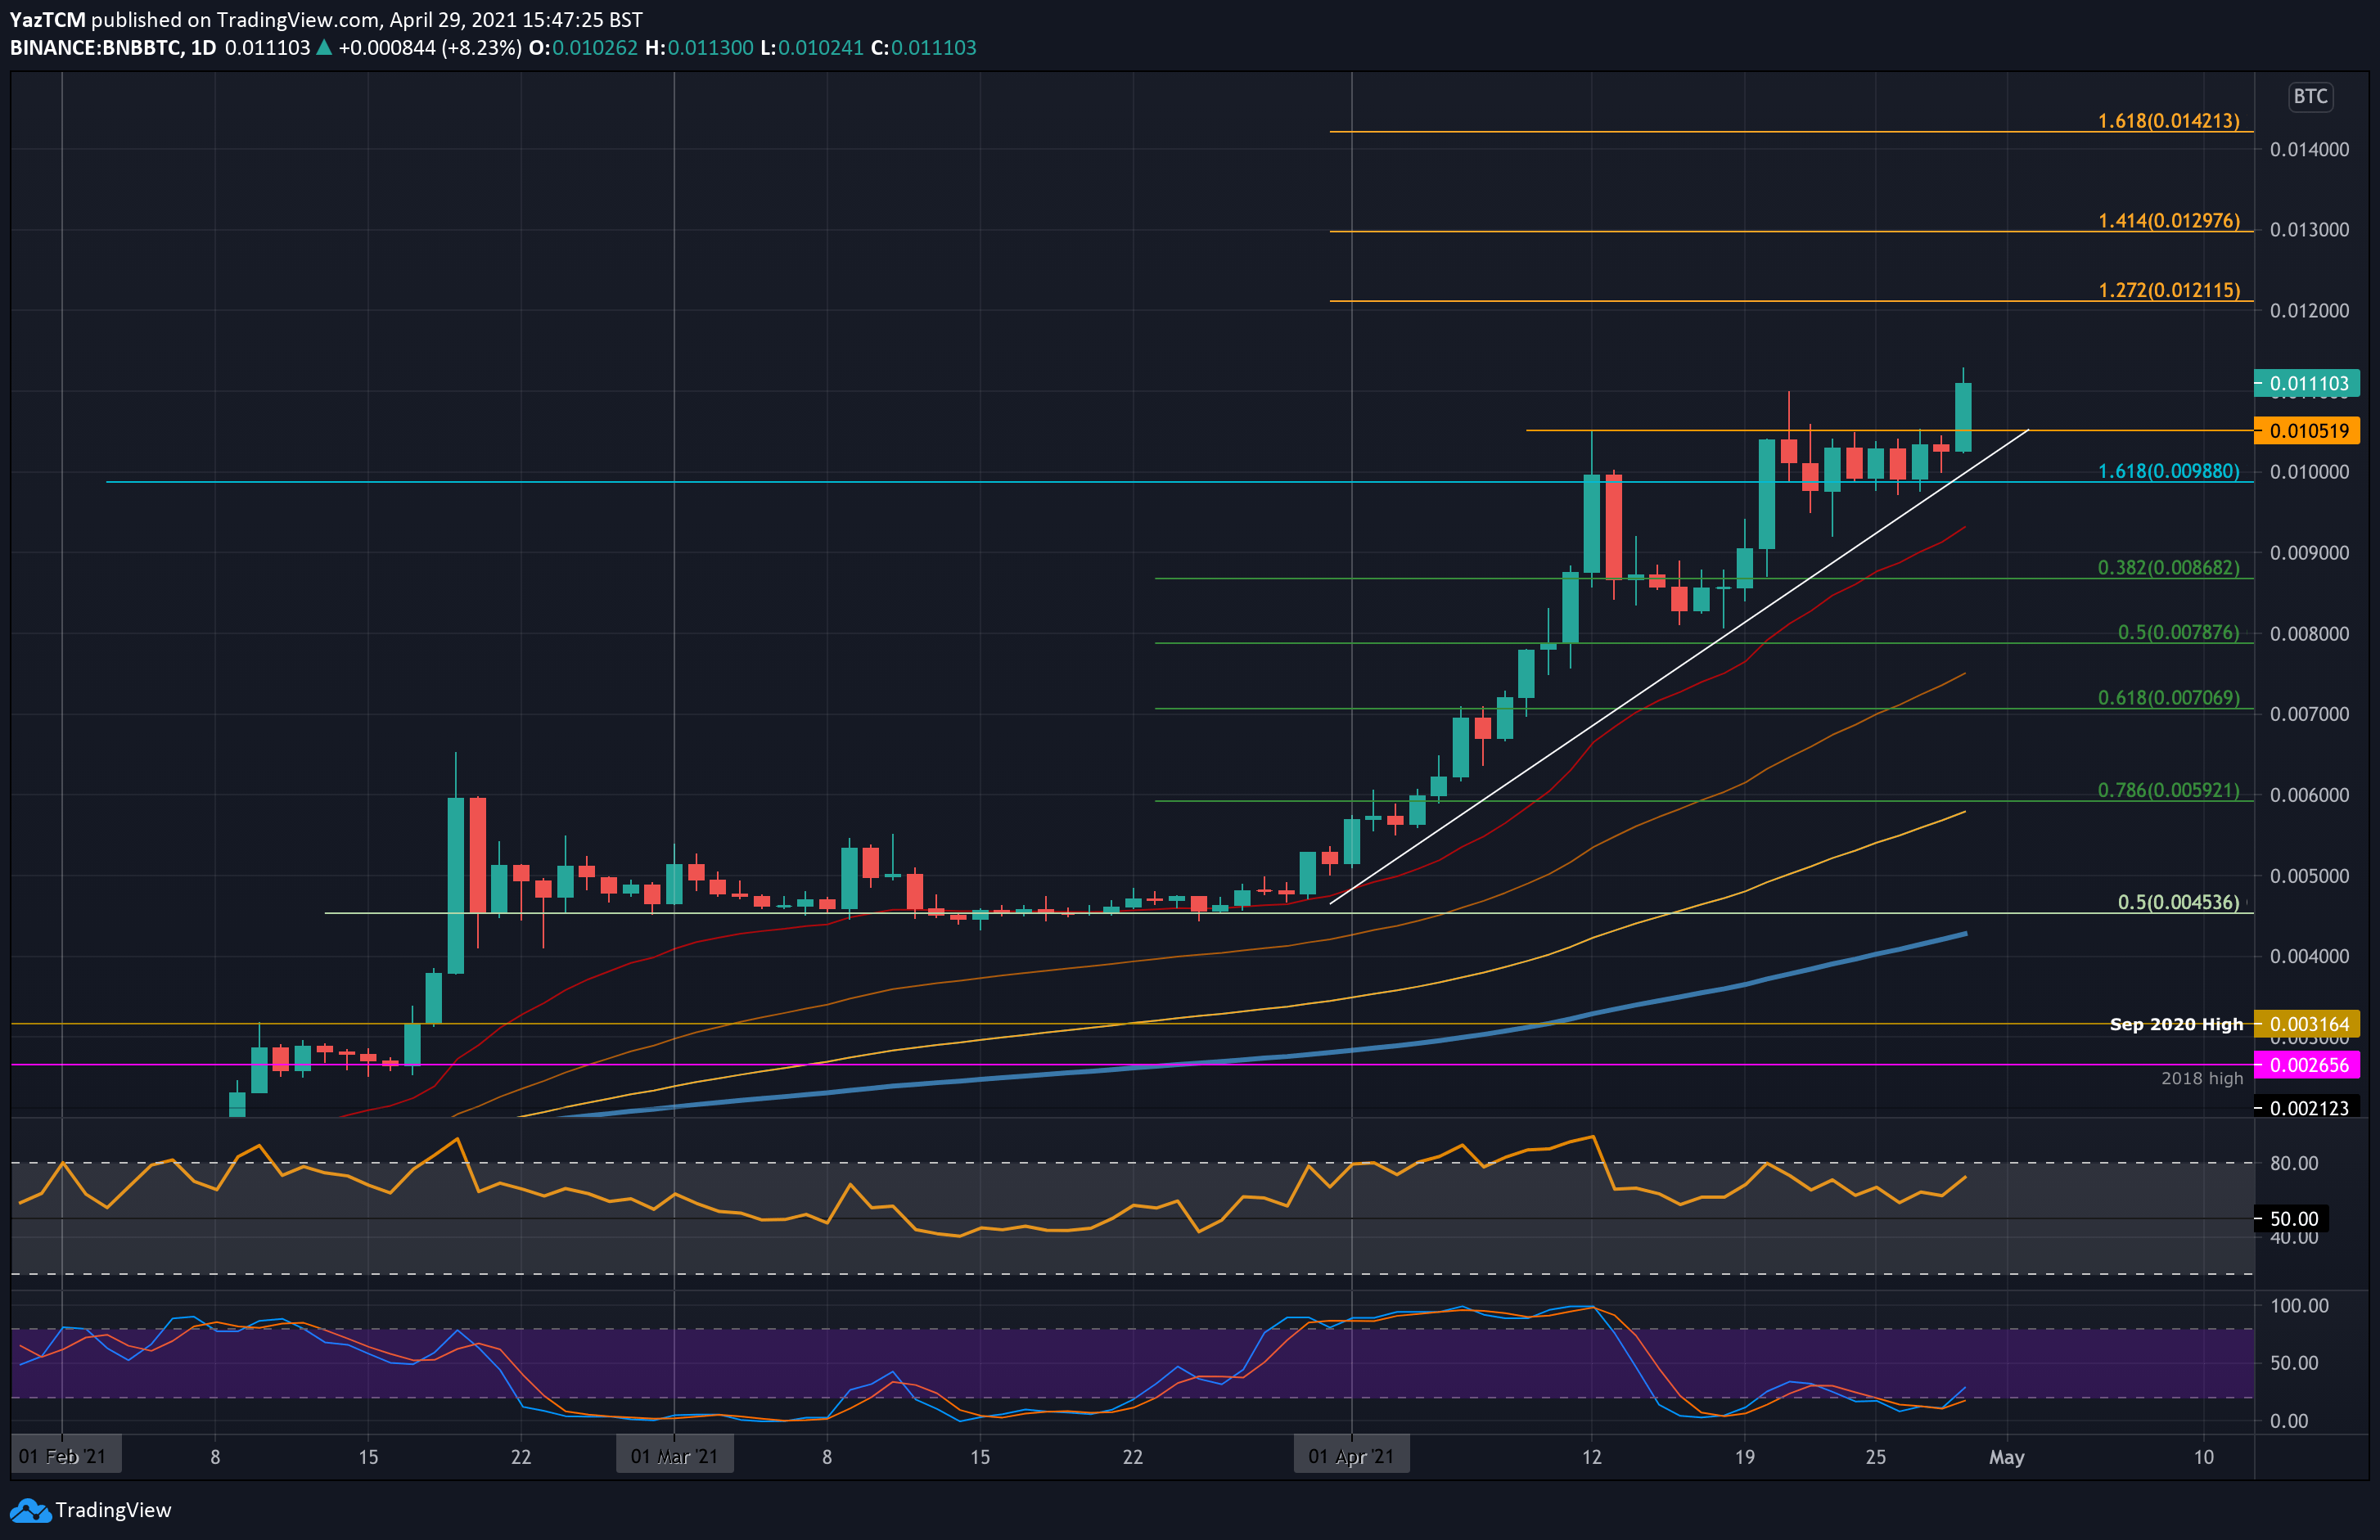
BNB-BTC Short Term Price Prediction
Looking ahead, the first resistance lies at 0.0121 BTC (1.272 Fib Extension). This is followed by 0.0129 BTC (1.414 Fib Extension), 0.0135 BTC, and 0.0142 BTC (1.618 Fib Extension).
On the other side, the first support lies at 0.0105 BTC (triangle roof – now support). This is followed by 0.0098 BTC (this week’s support), 0.0905 BTC (20-days MA), and 0.00862 BTC (.382 Fib).
The RSI remains above the midline as the bulls maintained control of the momentum since the end of March. The Stochastic RSI also produced a bullish crossover signal.