BNB/USD – Bulls See 332% Price ExplosionKey Support Levels: 0, 7, 0.Key Resistance Levels: 0, 8, 0.Binance Coin is up by an extraordinary 332% over the past two weeks. The cryptocurrency was trading at just at the beginning of February.Yesterday, the BNB bulls managed to push past 0 as they continued higher today to reach 6. It has since dropped slightly.BNB/USD Daily Chart. Source: TradingViewBNB-USD Short Term Price PredictionMoving forward, the first resistance lies at 0 (1.618 Fib Extension – orange). This is followed by 8 (1.618 Fib Extension – red), 0, and 1 (1.414 Fib Extension – blue).On the other side, the first support lies at 0. This is followed by 7 (.236 Fib), 0, and 2.10 (.382 Fib).The RSI is overbought but still can move
Topics:
Yaz Sheikh considers the following as important: Binance Coin (BNB) Price, BNBBTC, bnbusd, Price Analysis
This could be interesting, too:
Chayanika Deka writes Osprey Funds Launches First US Publicly Quoted BNB Trust
Chayanika Deka writes BNB Overtakes Solana to Secure 5th Spot by Market Cap After Historic Rally
CryptoVizArt writes ETH’s Path to K Involves Maintaining This Critical Support (Ethereum Price Analysis)
Dimitar Dzhondzhorov writes Binance to Temporarily Suspend Deposits and Withdrawals on BNB Smart Chain Soon: Here’s Why
BNB/USD – Bulls See 332% Price Explosion
Key Support Levels: $180, $157, $150.
Key Resistance Levels: $200, $218, $240.
Binance Coin is up by an extraordinary 332% over the past two weeks. The cryptocurrency was trading at just $50 at the beginning of February.
Yesterday, the BNB bulls managed to push past $150 as they continued higher today to reach $196. It has since dropped slightly.
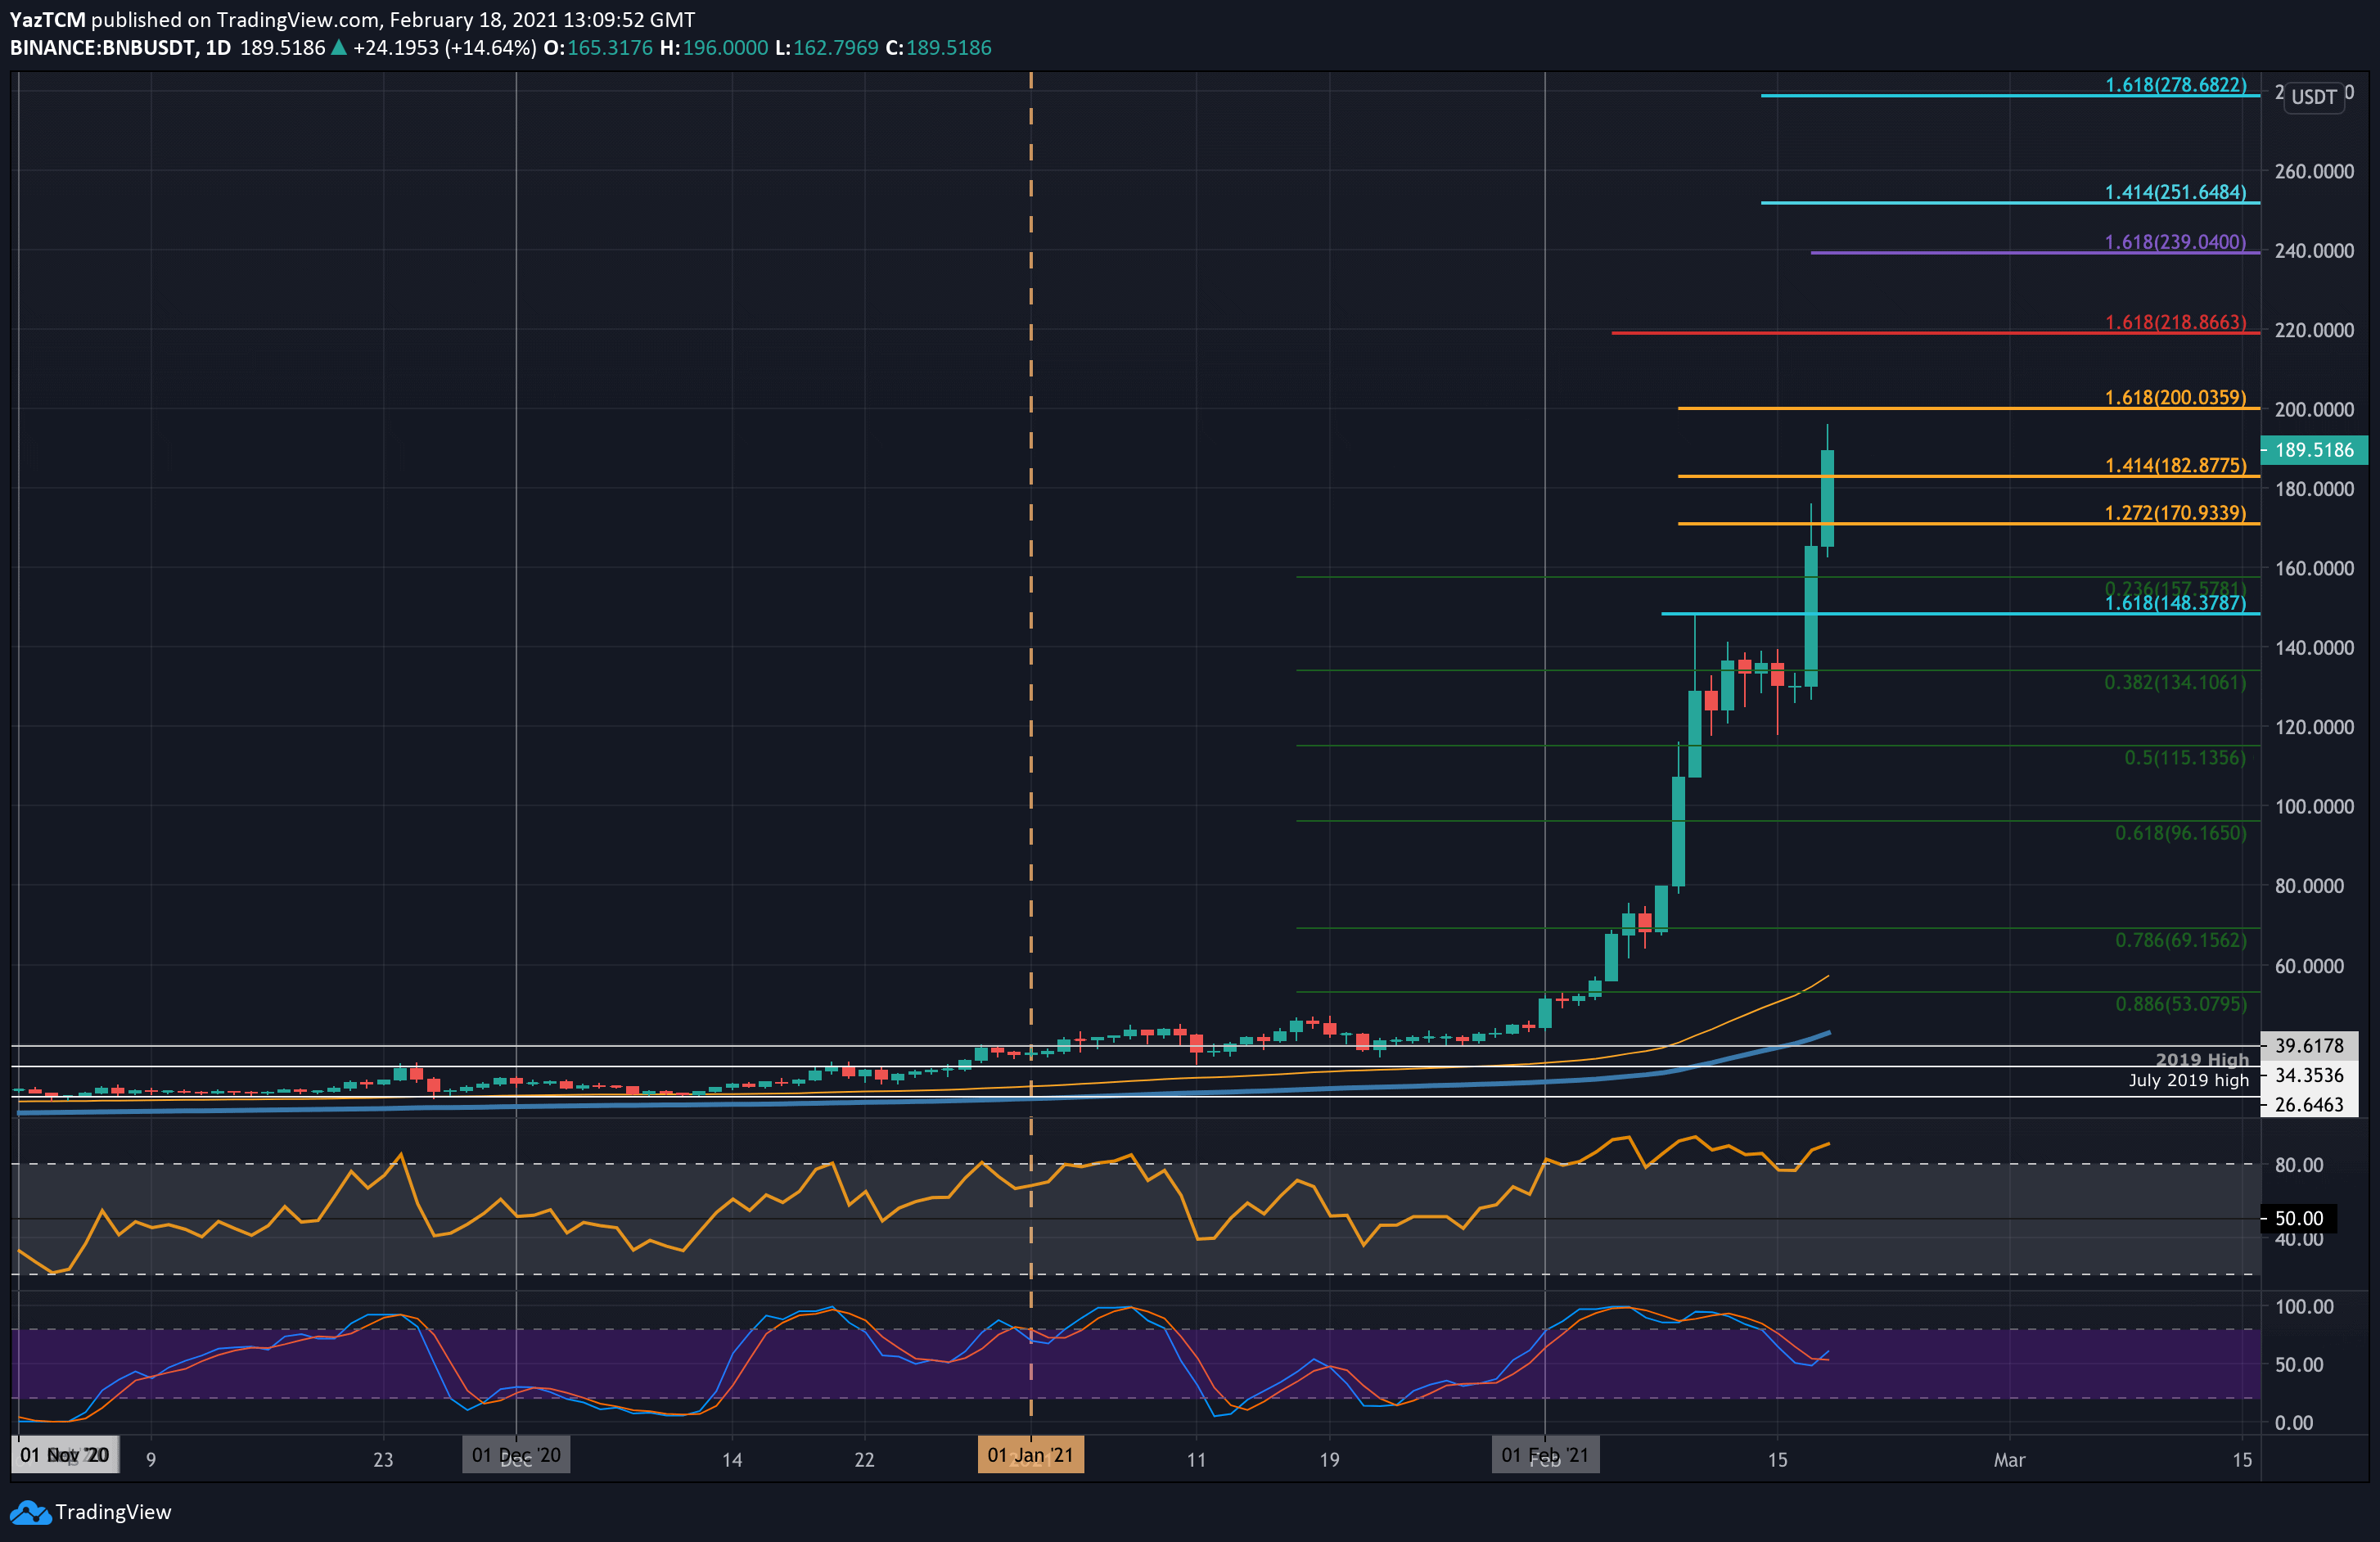
BNB-USD Short Term Price Prediction
Moving forward, the first resistance lies at $200 (1.618 Fib Extension – orange). This is followed by $218 (1.618 Fib Extension – red), $240, and $251 (1.414 Fib Extension – blue).
On the other side, the first support lies at $180. This is followed by $157 (.236 Fib), $150, and $132.10 (.382 Fib).
The RSI is overbought but still can move upward to push the market higher before becoming extremely overbought. The Stochastic RSI is far from being overbought right now.
BNB/BTC – Bulls Break 2020 Highs
Key Support Levels: 0.0034 BTC, 0.00316 BTC, 0.003 BTC.
Key Resistance Levels: 0.00371 BTC, 0.00386 BTC, 0.00401 BTC.
Binance Coin is also performing phenomenally well against Bitcoin. The coin broke the 200-days EMA at around 0.0017 BTC at the start of February as it started to surge. Initially, it found resistance at 0.00292 (bearish .5 Fib), which caused the market to drop back into the 0.0026 BTC support.
It rebounded from 0.00265 BTC (2018 Highs) yesterday and continued to explode beyond 0.003 BTC. The buyers managed to break the 2020 highs of 0.00316 BTC today as they pished as high as 0.0038 BTC.
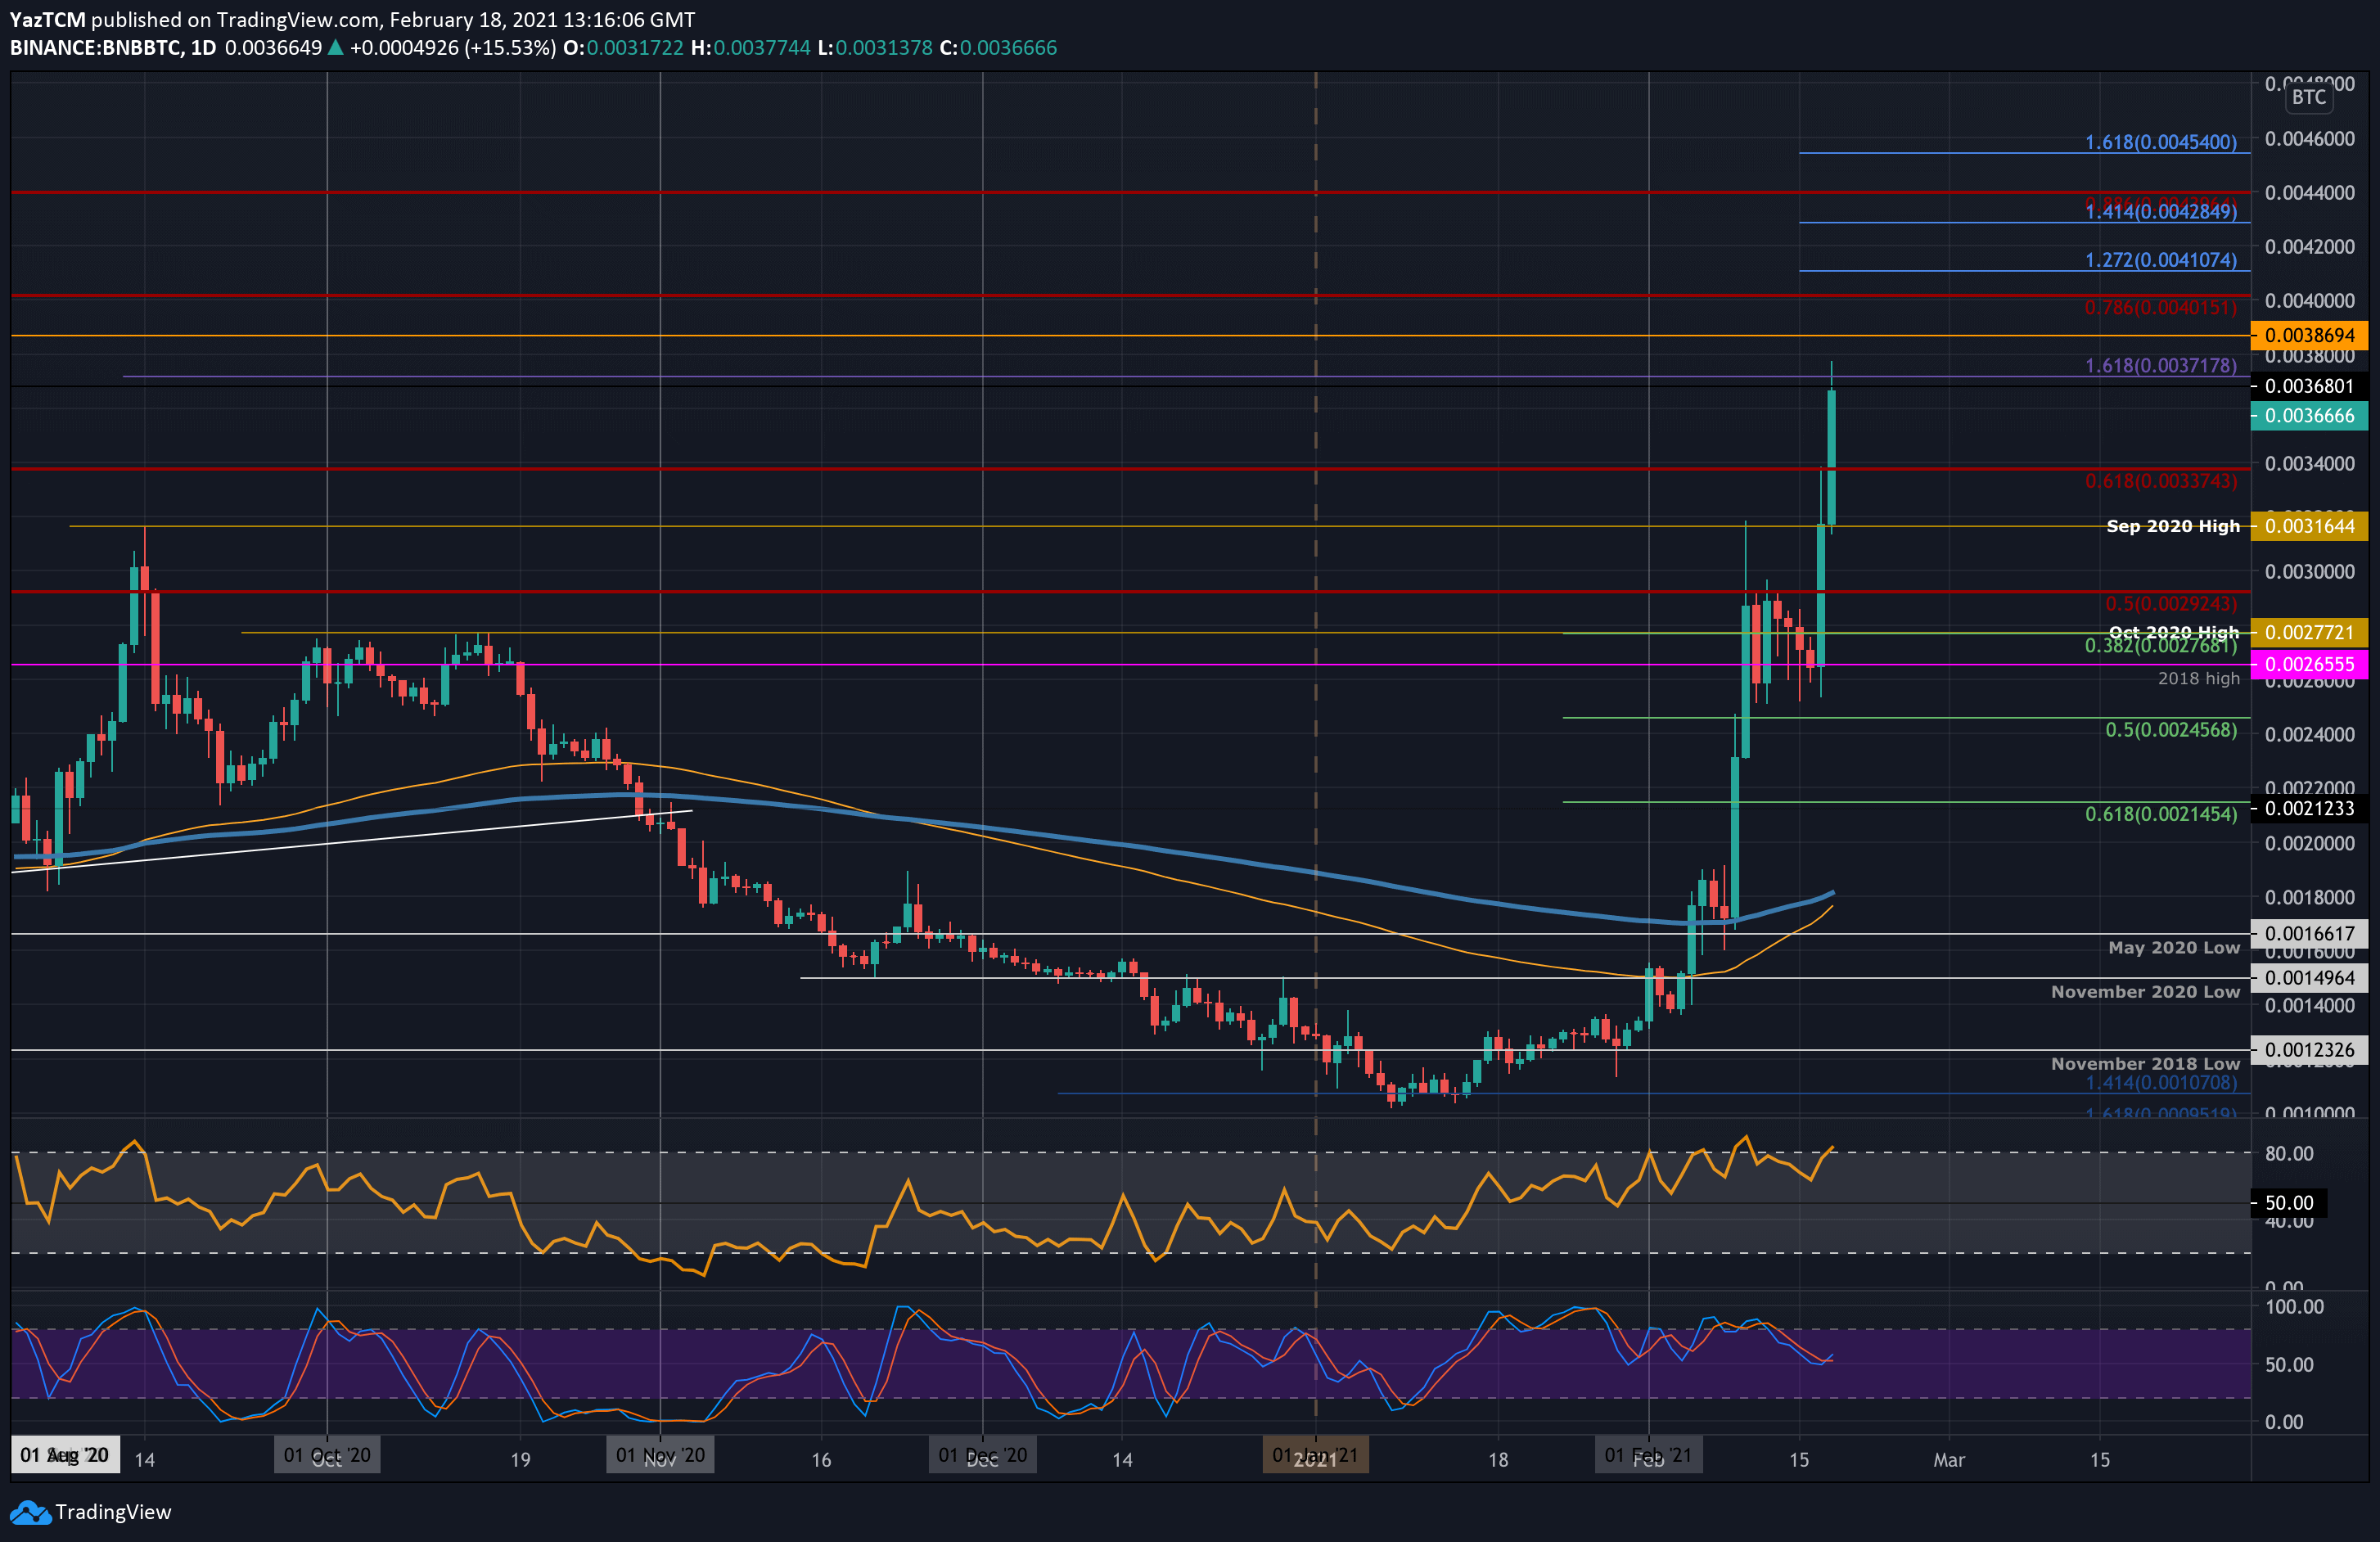
BNB-BTC Short Term Price Prediction
Looking ahead, the first level of resistance lies at 0.00371 BTC. This is followed by 0.00386 BTC, 0.00401 BTC (bearish .786 Fib), and 0.0041 BTC (1.272 Fib Extension).
On the other side, the first support lies at 0.0034 BTC. This is followed by 0.00316 BTC (2020 High), 0.003 BTC, and 0.00277 (October 2020 High).
Likewise, the RSI is overbought but still has room to push higher before becoming extremely overbought.