ADA/USD – Bulls Approach ATH PricesKey Support Levels: .37, .30, .22.Key Resistance Levels: .48, .52, .62.Cardano has surged by a whopping 45% over the past three days as it reaches resistance at .46 (1.618 Fib Retracement). The cryptocurrency had dropped into the .00 support at the end of last week and rebounded from there on Tuesday.After the bounce, ADA went on to climb higher as it reached the resistance at .37 (1.272 Fib Extension) yesterday. Today, the 16.5% price hike allowed ADA to push near the previous ATH price at .48.ADA/USD Daily Chart. Source: TradingViewADA-USD Short Term Price PredictionLooking ahead, the first level of resistance lies at the ATH price of .48. Above this, resistance lies at .52, .56, and .62 (1.272 fib Extension – red). Added
Topics:
Yaz Sheikh considers the following as important: ADABTC, ADAUSD, Cardano (ADA) Price, Price Analysis
This could be interesting, too:
Dimitar Dzhondzhorov writes Millions of ADA Sold by Cardano Whales During Market Crash – Will the Decline Continue?
Jordan Lyanchev writes Here’s How Cardano’s 17% Weekly Correction Can Help ADA Hit This Cycle: Analyst
Jordan Lyanchev writes ADA, DOGE, SOL Dump Hard Again as BTC Slides Below K (Market Watch)
Dimitar Dzhondzhorov writes Cardano (ADA) Jumps by 15% Daily: These 3 Bullish Factors Suggest a Further Rally
ADA/USD – Bulls Approach ATH Prices
Key Support Levels: $1.37, $1.30, $1.22.
Key Resistance Levels: $1.48, $1.52, $1.62.
Cardano has surged by a whopping 45% over the past three days as it reaches resistance at $1.46 (1.618 Fib Retracement). The cryptocurrency had dropped into the $1.00 support at the end of last week and rebounded from there on Tuesday.
After the bounce, ADA went on to climb higher as it reached the resistance at $1.37 (1.272 Fib Extension) yesterday. Today, the 16.5% price hike allowed ADA to push near the previous ATH price at $1.48.
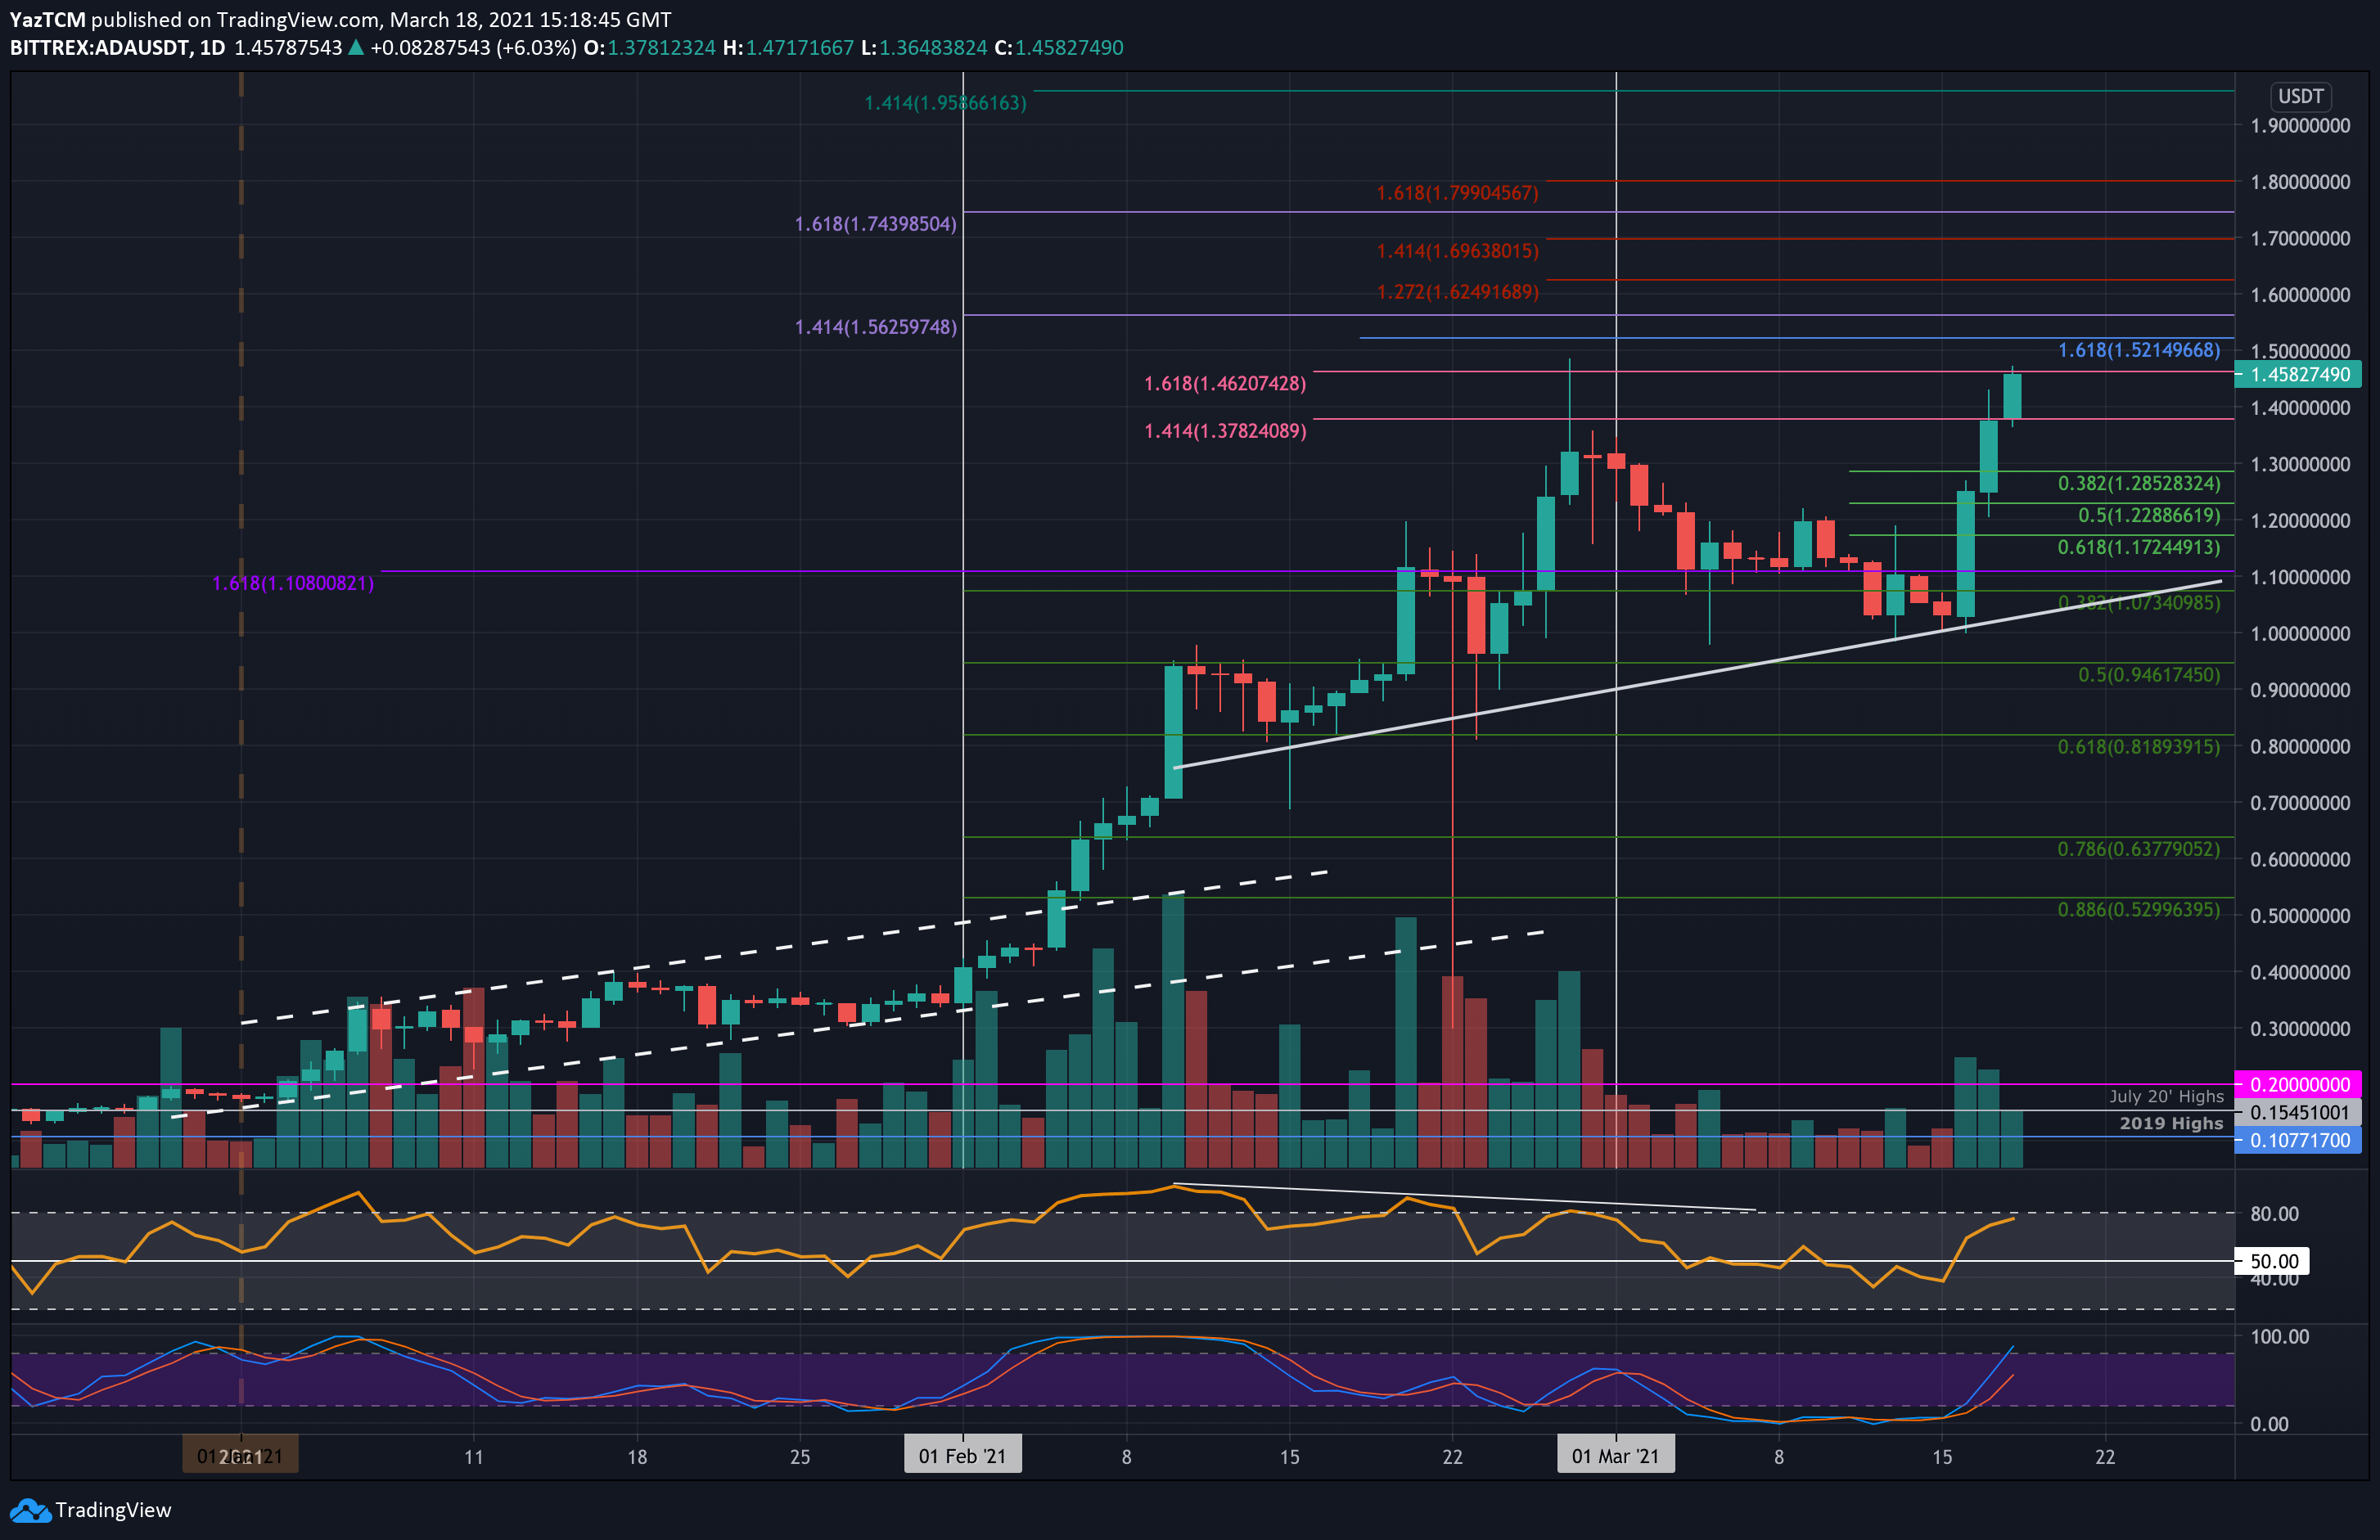
ADA-USD Short Term Price Prediction
Looking ahead, the first level of resistance lies at the ATH price of $1.48. Above this, resistance lies at $1.52, $1.56, and $1.62 (1.272 fib Extension – red). Added resistance lies at $1.70 (1.414 Fib Extension – red), $1.75, and $1.80 (1.618 Fib Extension – red).
On the other side, the first level of support lies at $1.37 (yesterday’s closing price). This is followed by $1.30 (.382 Fib), $1.22 (.5 Fib), $1.17 (.618 Fib), and $1.10.
The RSI is now approaching overbought conditions but still has much room to continue higher before the momentum becomes extremely overbought.
ADA/BTC – ADA Pushes Above July 2018 Highs Again
Key Support Levels: 2455 SAT, 2300 SAT, 2200 SAT.
Key Resistance Levels: 2645 SAT, 2800 SAT, 2888 SAT.
Against Bitcoin, ADA is starting to recover from the early March losses. It had dropped from 2900 SAT at the start of the month as it collapsed beneath 2000 SAT until support was met around 1800 SAT (.618 Fib Retracement).
ADA rebounded from 1800 SAT at the start of this week as it started to grind higher. It broke back above 2000 SAT on Tuesday and has continued upward over the past two days to break the July 2018 high-day closing price at 2455 SAT to reach as high as 2510 SAT today.
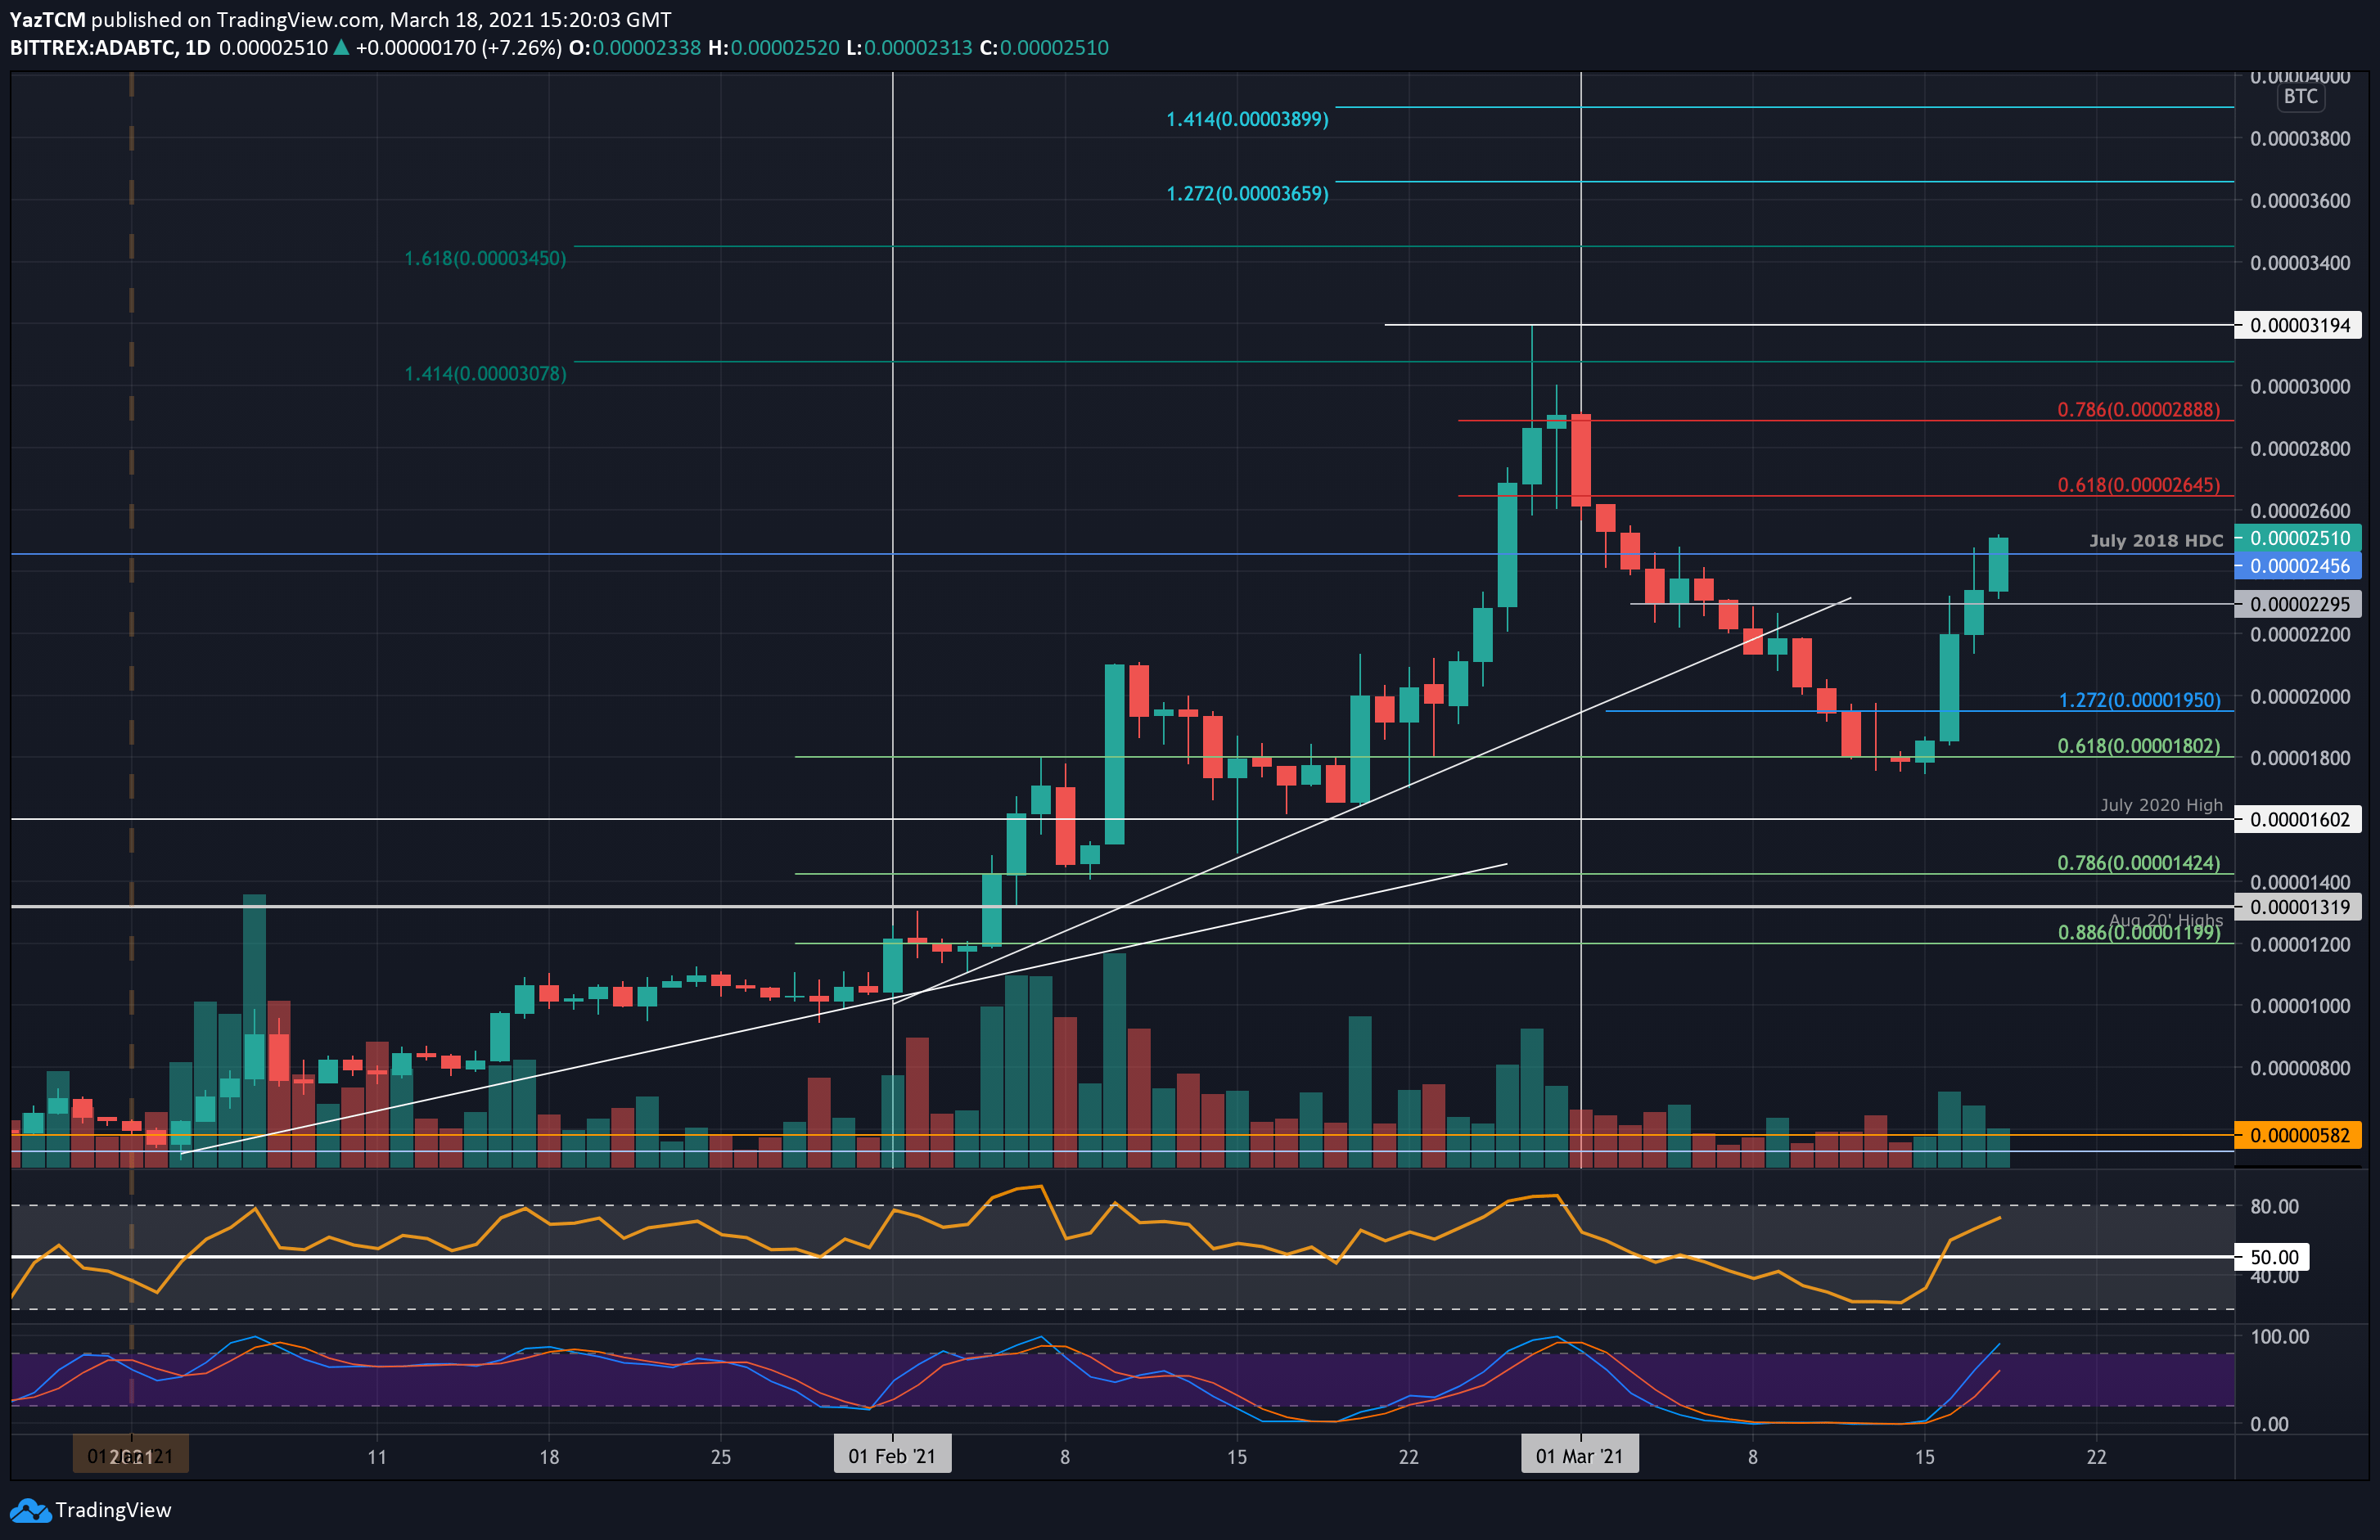
ADA-BTC Short Term Price Prediction
Looking ahead, the first level of higher resistance lies at 2645 SAT (bearish .618 Fib). This is followed by 2800 SAT, 2888 SAT (bearish .786 Fib), 3000 SAT, and 3195 SAT (Feb 2021 highs).
On the other side, the first level of support lies at 2455 SAT (July 18 HDC). This is followed by 2300 SAT, 2200 SAT, 2000 SAT, and 1800 SAT (.618 Fib).
Likewise, the RSI is in the bullish favor and still has room to continue higher before the momentum becomes overbought.