ADA/USD – Market Falls Into .618 Fib SupportKey Support Levels: .17, .10, .00.Key Resistance Levels: .30, .47, .46.ADA is up by a total of 10.5% since rebounding from support at an ascending trend line at .00 last week. After the rebound, ADA went on to surge as high as .46. The price surge was driven by the fact that ADA had been added to the Coinbase Pro platform.Unfortunately, it was unable to close a daily candle above resistance at .37 (1.414 Fib Extension level) and rolled over from there. Since rolling over, ADA has dropped over the previous four days until support was found today at .17(short term .618 Fib), bringing the total loss to about 20% in this time frame.ADA/USD Daily Chart. Source: TradingViewADA-USD Short Term Price PredictionLooking ahead, the first
Topics:
Yaz Sheikh considers the following as important: ADABTC, ADAUSD, Cardano (ADA) Price, Price Analysis
This could be interesting, too:
Dimitar Dzhondzhorov writes Millions of ADA Sold by Cardano Whales During Market Crash – Will the Decline Continue?
Jordan Lyanchev writes Here’s How Cardano’s 17% Weekly Correction Can Help ADA Hit This Cycle: Analyst
Jordan Lyanchev writes ADA, DOGE, SOL Dump Hard Again as BTC Slides Below K (Market Watch)
Dimitar Dzhondzhorov writes Cardano (ADA) Jumps by 15% Daily: These 3 Bullish Factors Suggest a Further Rally
ADA/USD – Market Falls Into .618 Fib Support
Key Support Levels: $1.17, $1.10, $1.00.
Key Resistance Levels: $1.30, $1.47, $1.46.
ADA is up by a total of 10.5% since rebounding from support at an ascending trend line at $1.00 last week. After the rebound, ADA went on to surge as high as $1.46. The price surge was driven by the fact that ADA had been added to the Coinbase Pro platform.
Unfortunately, it was unable to close a daily candle above resistance at $1.37 (1.414 Fib Extension level) and rolled over from there. Since rolling over, ADA has dropped over the previous four days until support was found today at $1.17(short term .618 Fib), bringing the total loss to about 20% in this time frame.
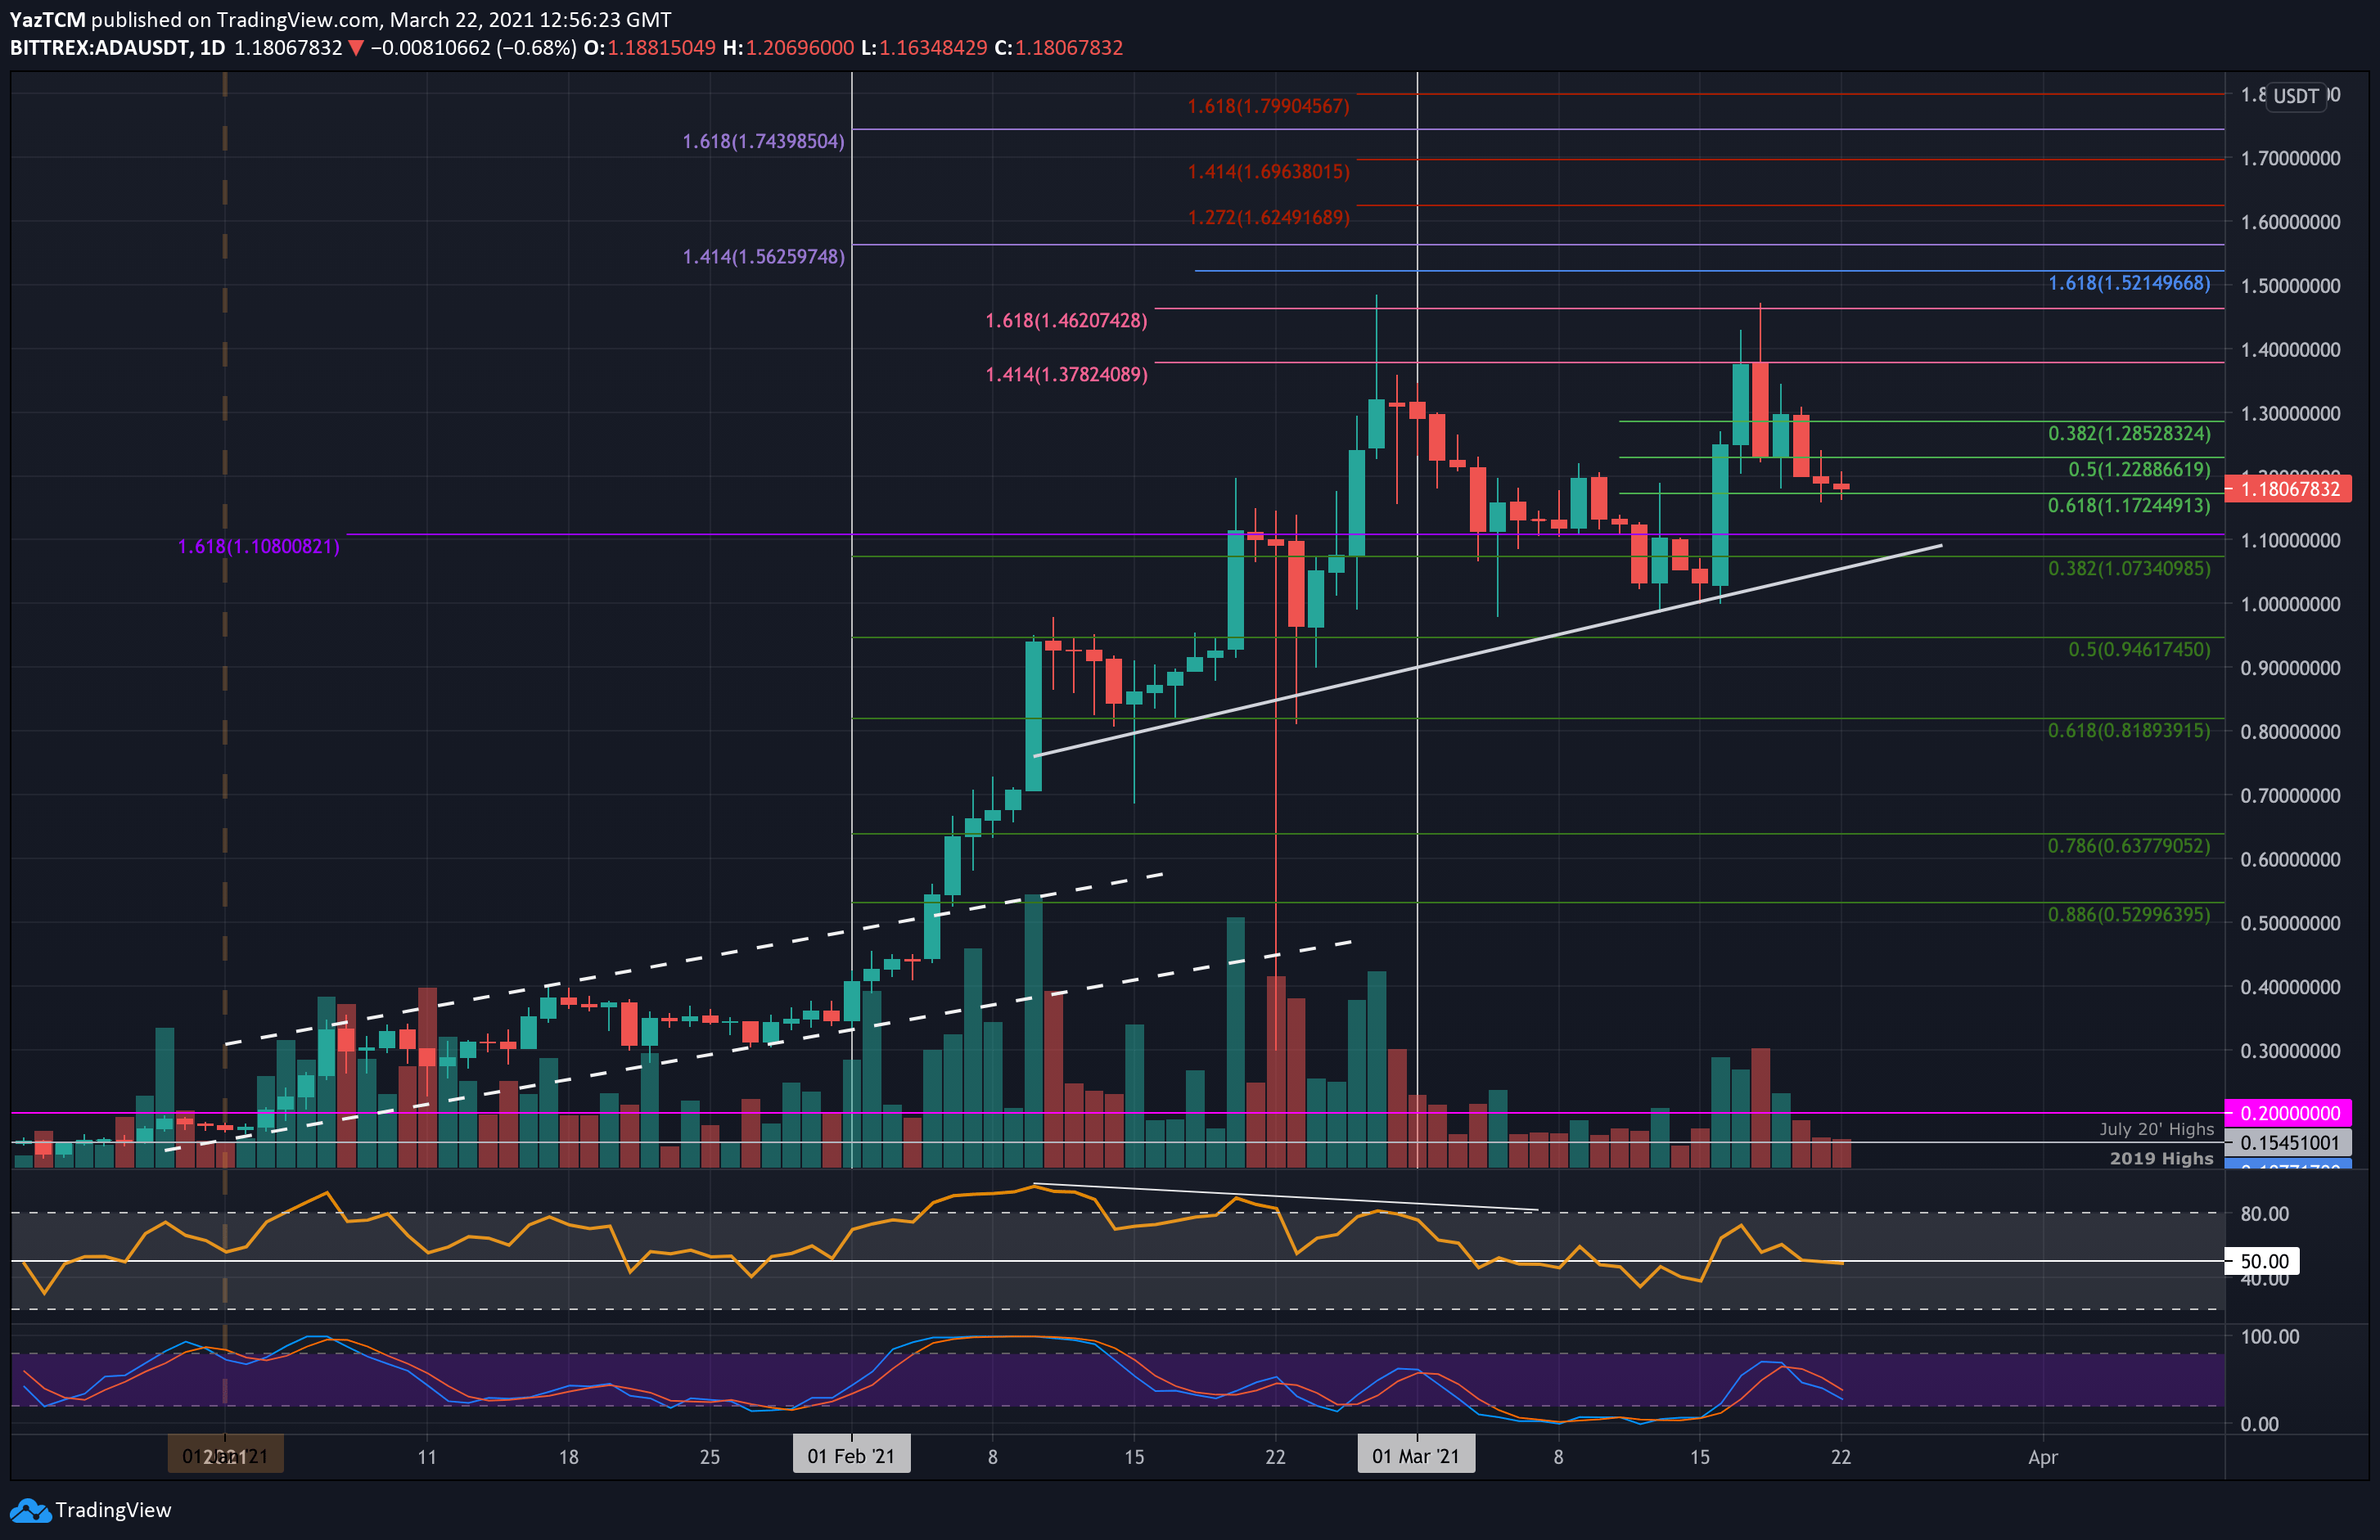
ADA-USD Short Term Price Prediction
Looking ahead, the first level of support lies at $1.17 (.618 Fib). This is followed by $1.10, the ascending trend line, $1.00, and $0.95 (.5 Fib).
On the other side, the first resistance lies at $1.30. This is followed by $1.37 (1.414 Fib Extension), $1.46 (1.618 Fib Extension), and $1.50. Additional resistance lies at $1.625 and $1.70.
The RSI is trading along the midline, indicating indecision within the market. If it drops beneath 50, the bearish momentum will pick up and is likely to drive ADA back toward $1.00.
ADA/BTC – Buyers Battle To Defend 2000 SAT.
Key Support Levels: 2000 SAT, 1950 SAT, 1800 SAT.
Key Resistance Levels: 2300 SAT, 2455 SAT, 2645 SAT.
Against Bitcoin, ADA also rebounded from 1800 SAT last week to push high as 2500 SAT. It was struggling in March after falling from 2900 SAT to reach the support at 1800 SAT, provided by a longer-term .618 Fib Retracement.
From 2500 SAT, it started to head lower until reaching the support at 2000 SAT today, provided by a .618 Fib Retracement.
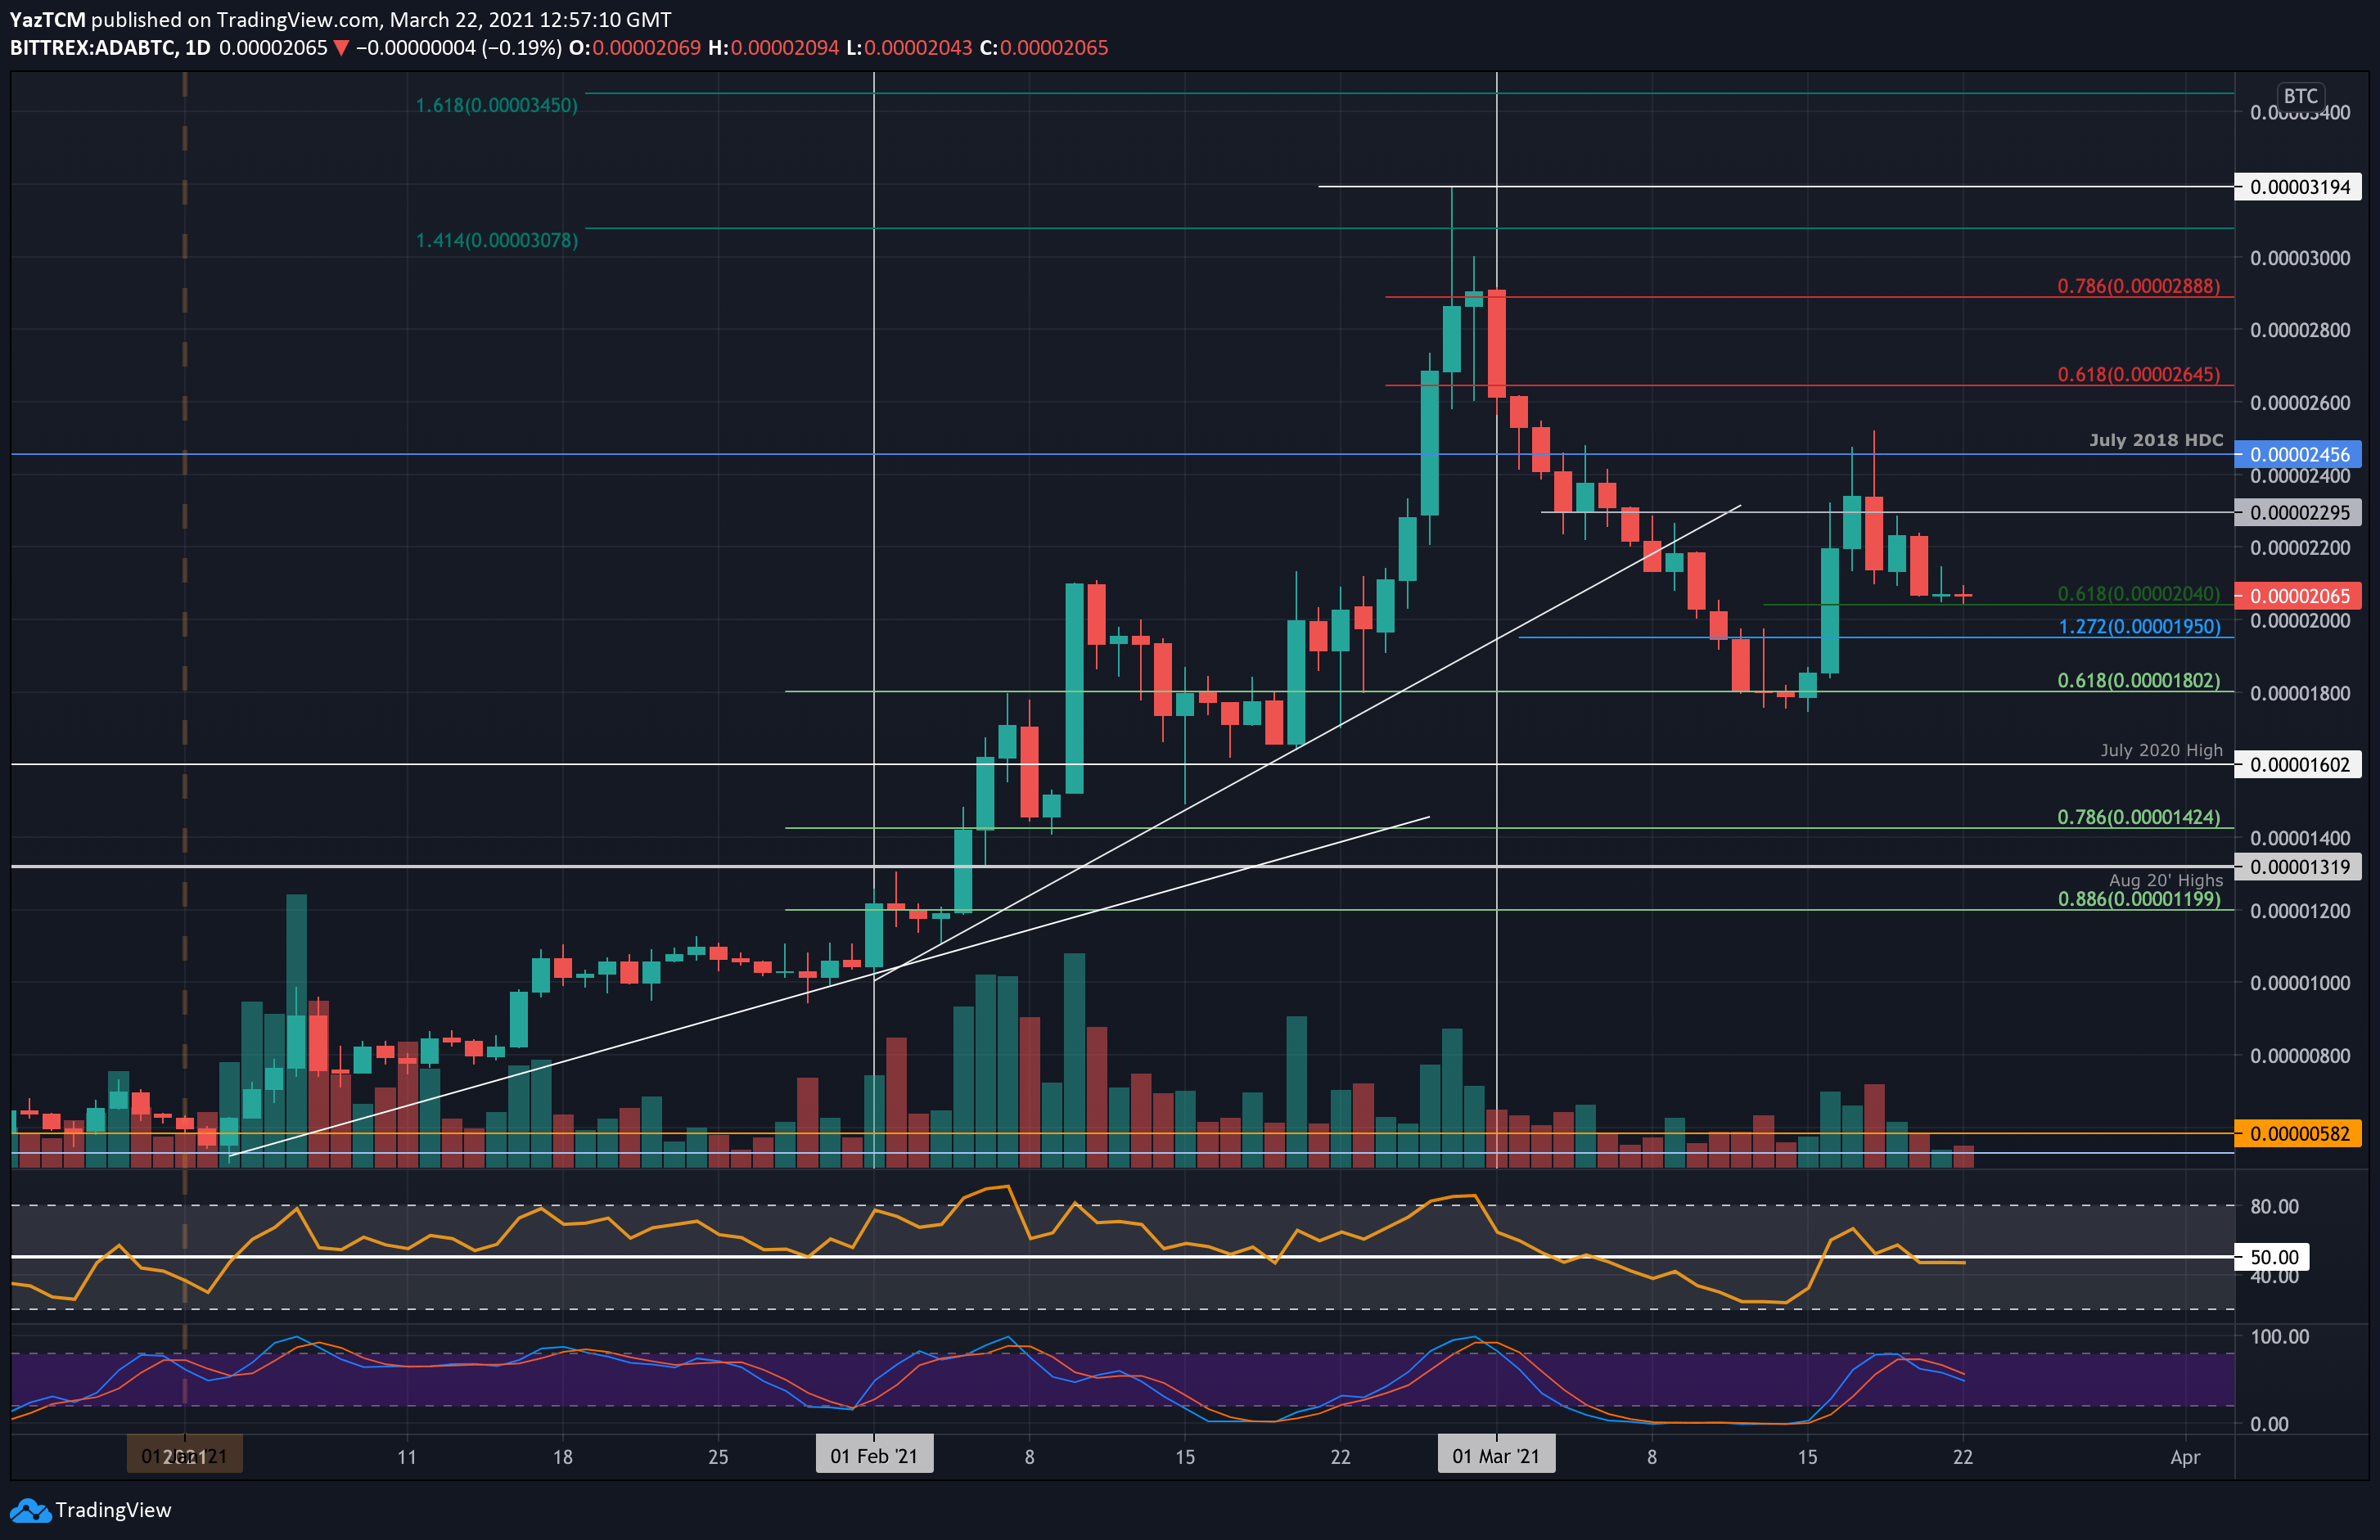
ADA-BTC Short Term Price Prediction
Looking ahead, if the sellers break beneath 2040 SAT, the first support lies at 1950 SAT (downside 1.272 Fib Extension). This is followed by 1800 SAT (.618 Fib Retracement), 1600 SAT (July 2020 Highs), and 1425 SAT (.786 Fib Retracement).
On the other side, the first resistance lies at 2300 SAT. This is followed by 2455 SAT, 2645 SAT (bearish .618 Fib), 2800 SAT, and 2888 SAT (bearish .786 Fib).
Likewise, the RSI is trading along the midline, indicating indecision within the market. If it pushes further beneath 50, the bearish momentum will increase and is likely to cause ADA to fall beneath 2000 SAT.