XRP/USD – Buyers Encountered Resistance Around .74 (bearish 0.786 Fib) Key Support Levels: .40, .25, .10. Key Resistance Levels: .74, .98, .10. XRP performed well this week after being able to surge by 48% according to CoinGecko. The coin bounced from support at .00 to reach as high as .74 on Friday. There, it found resistance at a bearish .786 Fib Retracement and a massive correction started towards .5. This aligns with the crypto market correction which started on Sunday. The rebound from .00 allowed XRP to attempt a recovery toward the mid-April highs where it managed to surge to .98, a level not seen since January 2018. The latter, together with the mark, becomes the first major resistance in XRP’s path to registering a new all-time high.
Topics:
Yaz Sheikh considers the following as important: Ripple (XRP) Price, XRP Analysis, xrpbtc, xrpusd
This could be interesting, too:
Dimitar Dzhondzhorov writes Is a Major Ripple v. SEC Lawsuit Development Expected This Week? Here’s Why
Mandy Williams writes Ripple Releases Institutional DeFi Roadmap for XRP Ledger in 2025
Dimitar Dzhondzhorov writes Ripple Whales Go on a Selling Spree: Is XRP Headed for a Further Correction?
Jordan Lyanchev writes ChatGPT and DeepSeek Analyze Ripple’s (XRP) Price Potential for 2025
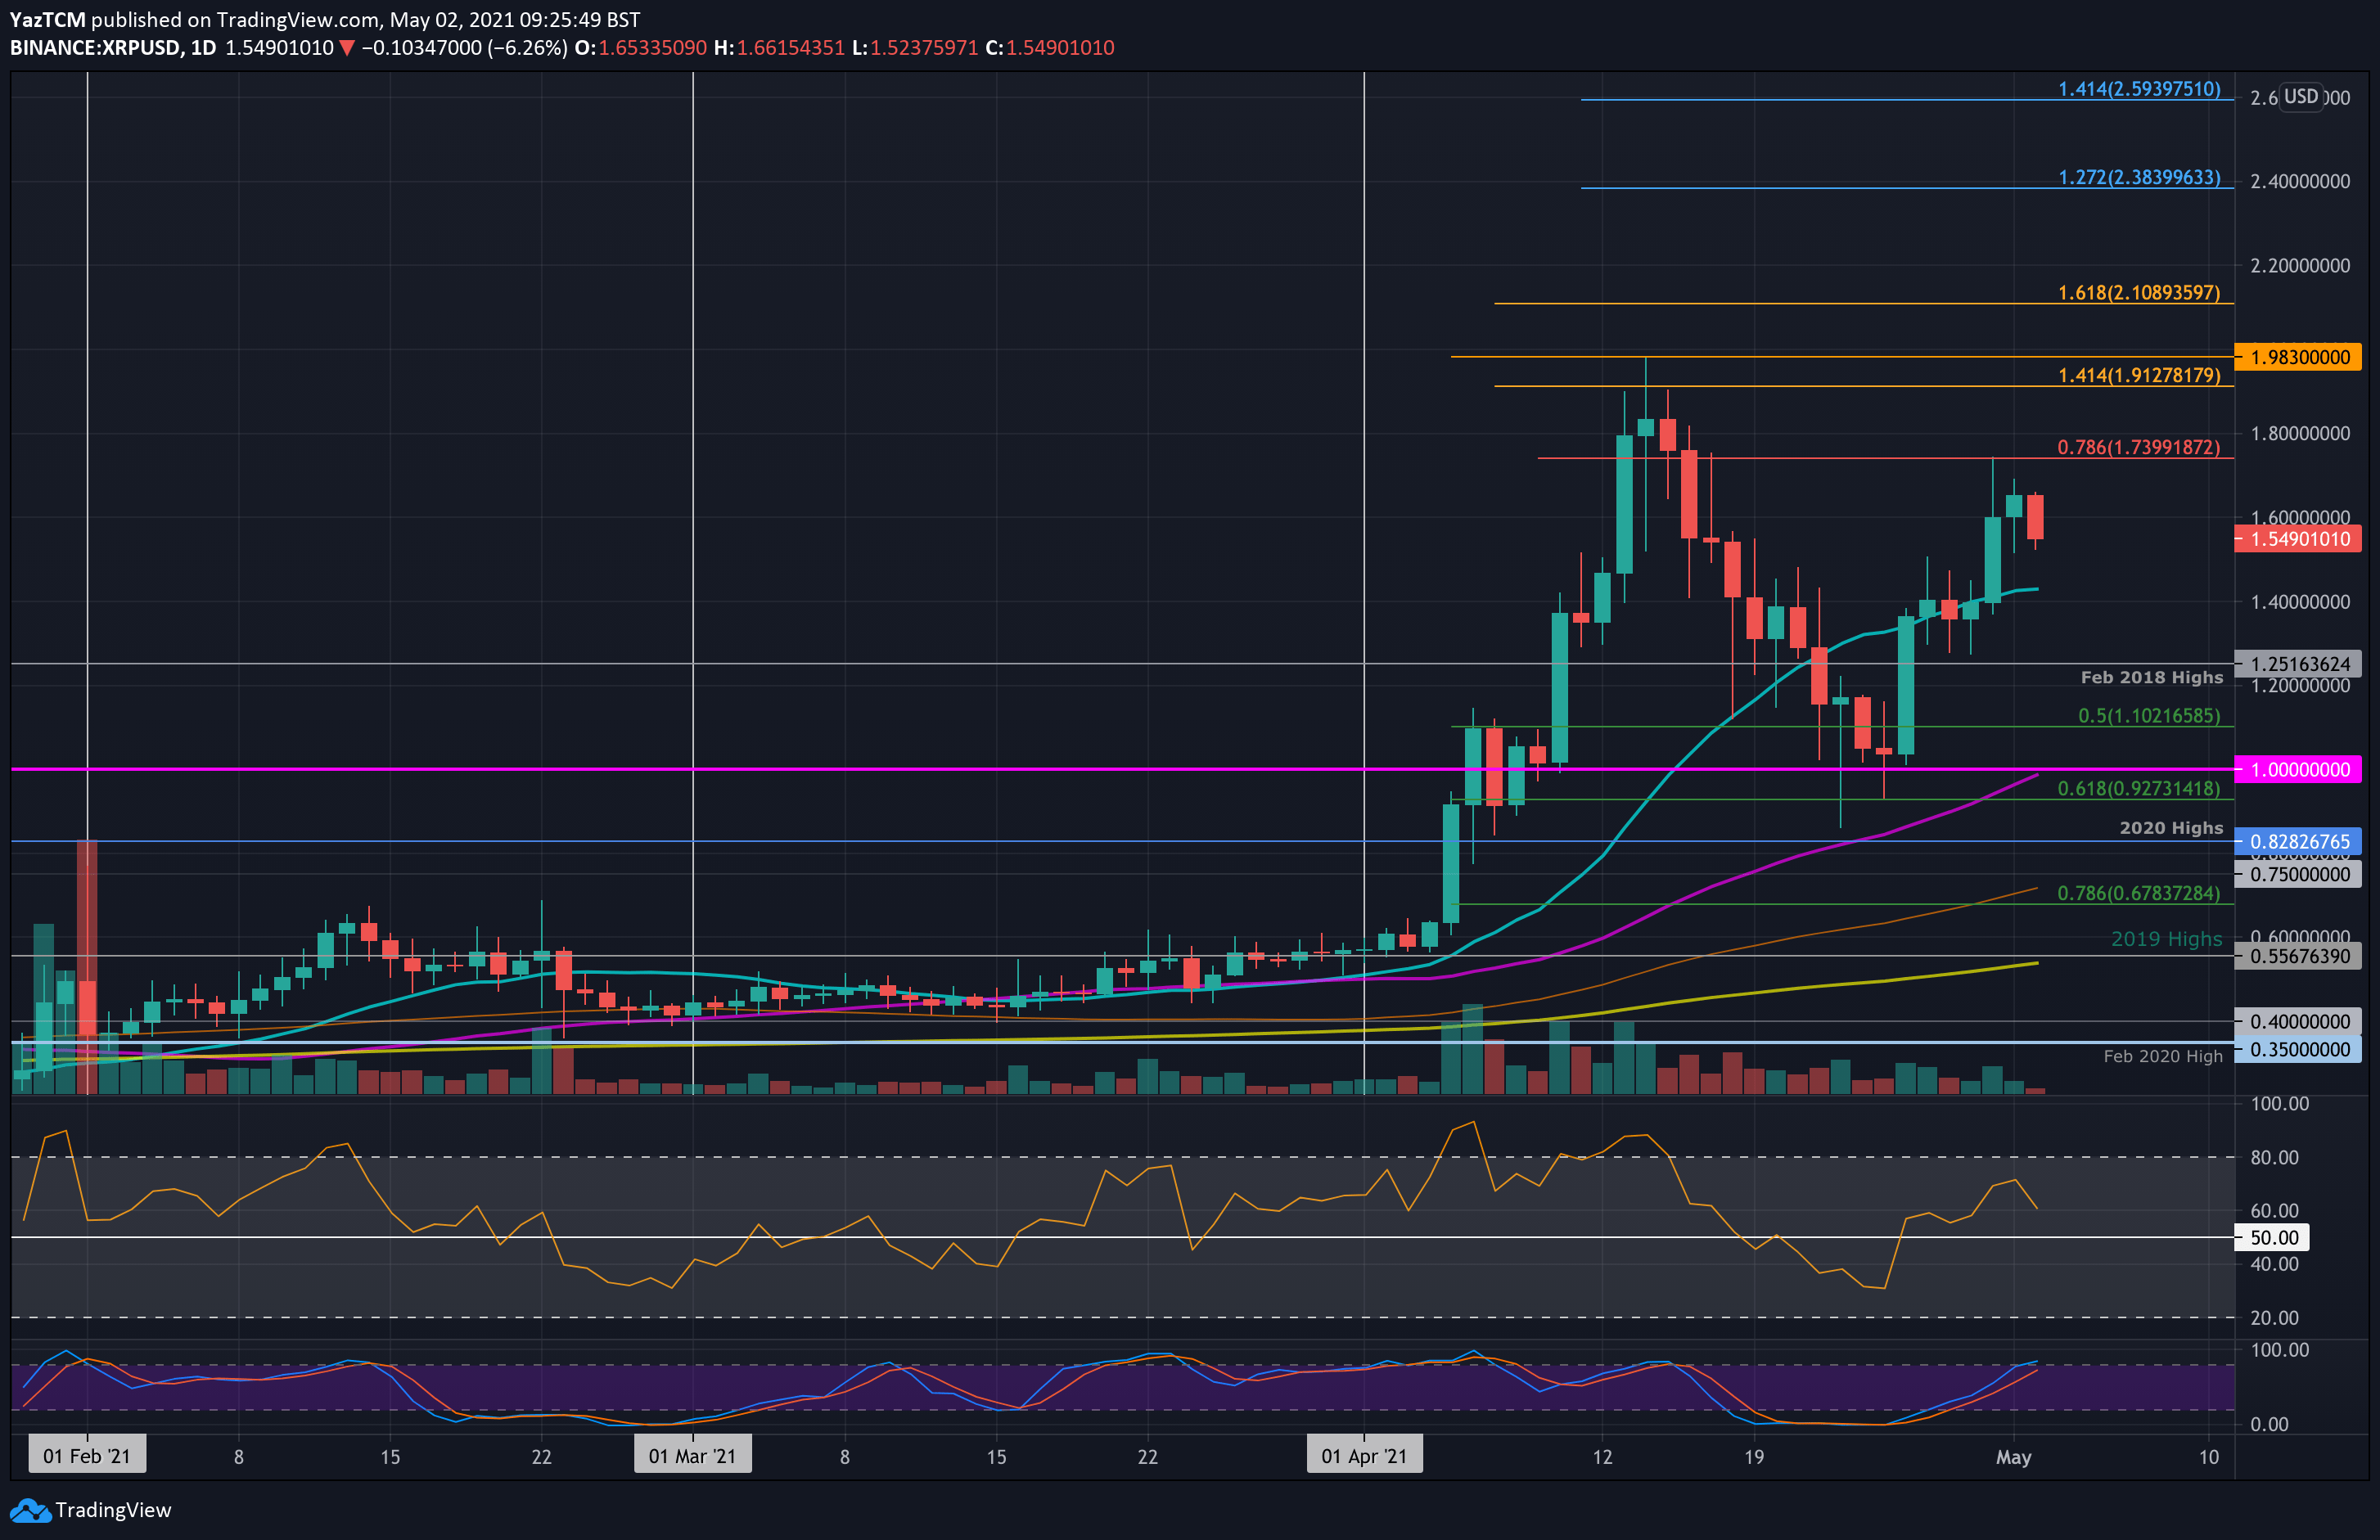
XRP/USD – Buyers Encountered Resistance Around $1.74 (bearish 0.786 Fib)
Key Support Levels: $1.40, $1.25, $1.10.
Key Resistance Levels: $1.74, $1.98, $2.10.
XRP performed well this week after being able to surge by 48% according to CoinGecko. The coin bounced from support at $1.00 to reach as high as $1.74 on Friday. There, it found resistance at a bearish .786 Fib Retracement and a massive correction started towards $1.5. This aligns with the crypto market correction which started on Sunday.
The rebound from $1.00 allowed XRP to attempt a recovery toward the mid-April highs where it managed to surge to $1.98, a level not seen since January 2018. The latter, together with the $2 mark, becomes the first major resistance in XRP’s path to registering a new all-time high.
XRP-USD Short Term Price Prediction
Looking ahead, the first level of support lies at $1.40 (20-days MA). This is followed by $1.25 (Feb 2018 Highs), $1.10 (.5 Fib), and $1.00.
On the other side, the first significant resistance lies at $1.74 (bearish .786 Fib). This is followed by $1.98 / $2, $2.10 (1.618 Fib Extension), and $2.39 (1.272 Fib Extension – blue).
The RSI indicator remains above the 60 level but is starting to show weakness as it is beginning to dip. Despite this, the bulls will remain in control of the momentum until the RSI drops beneath the midline.
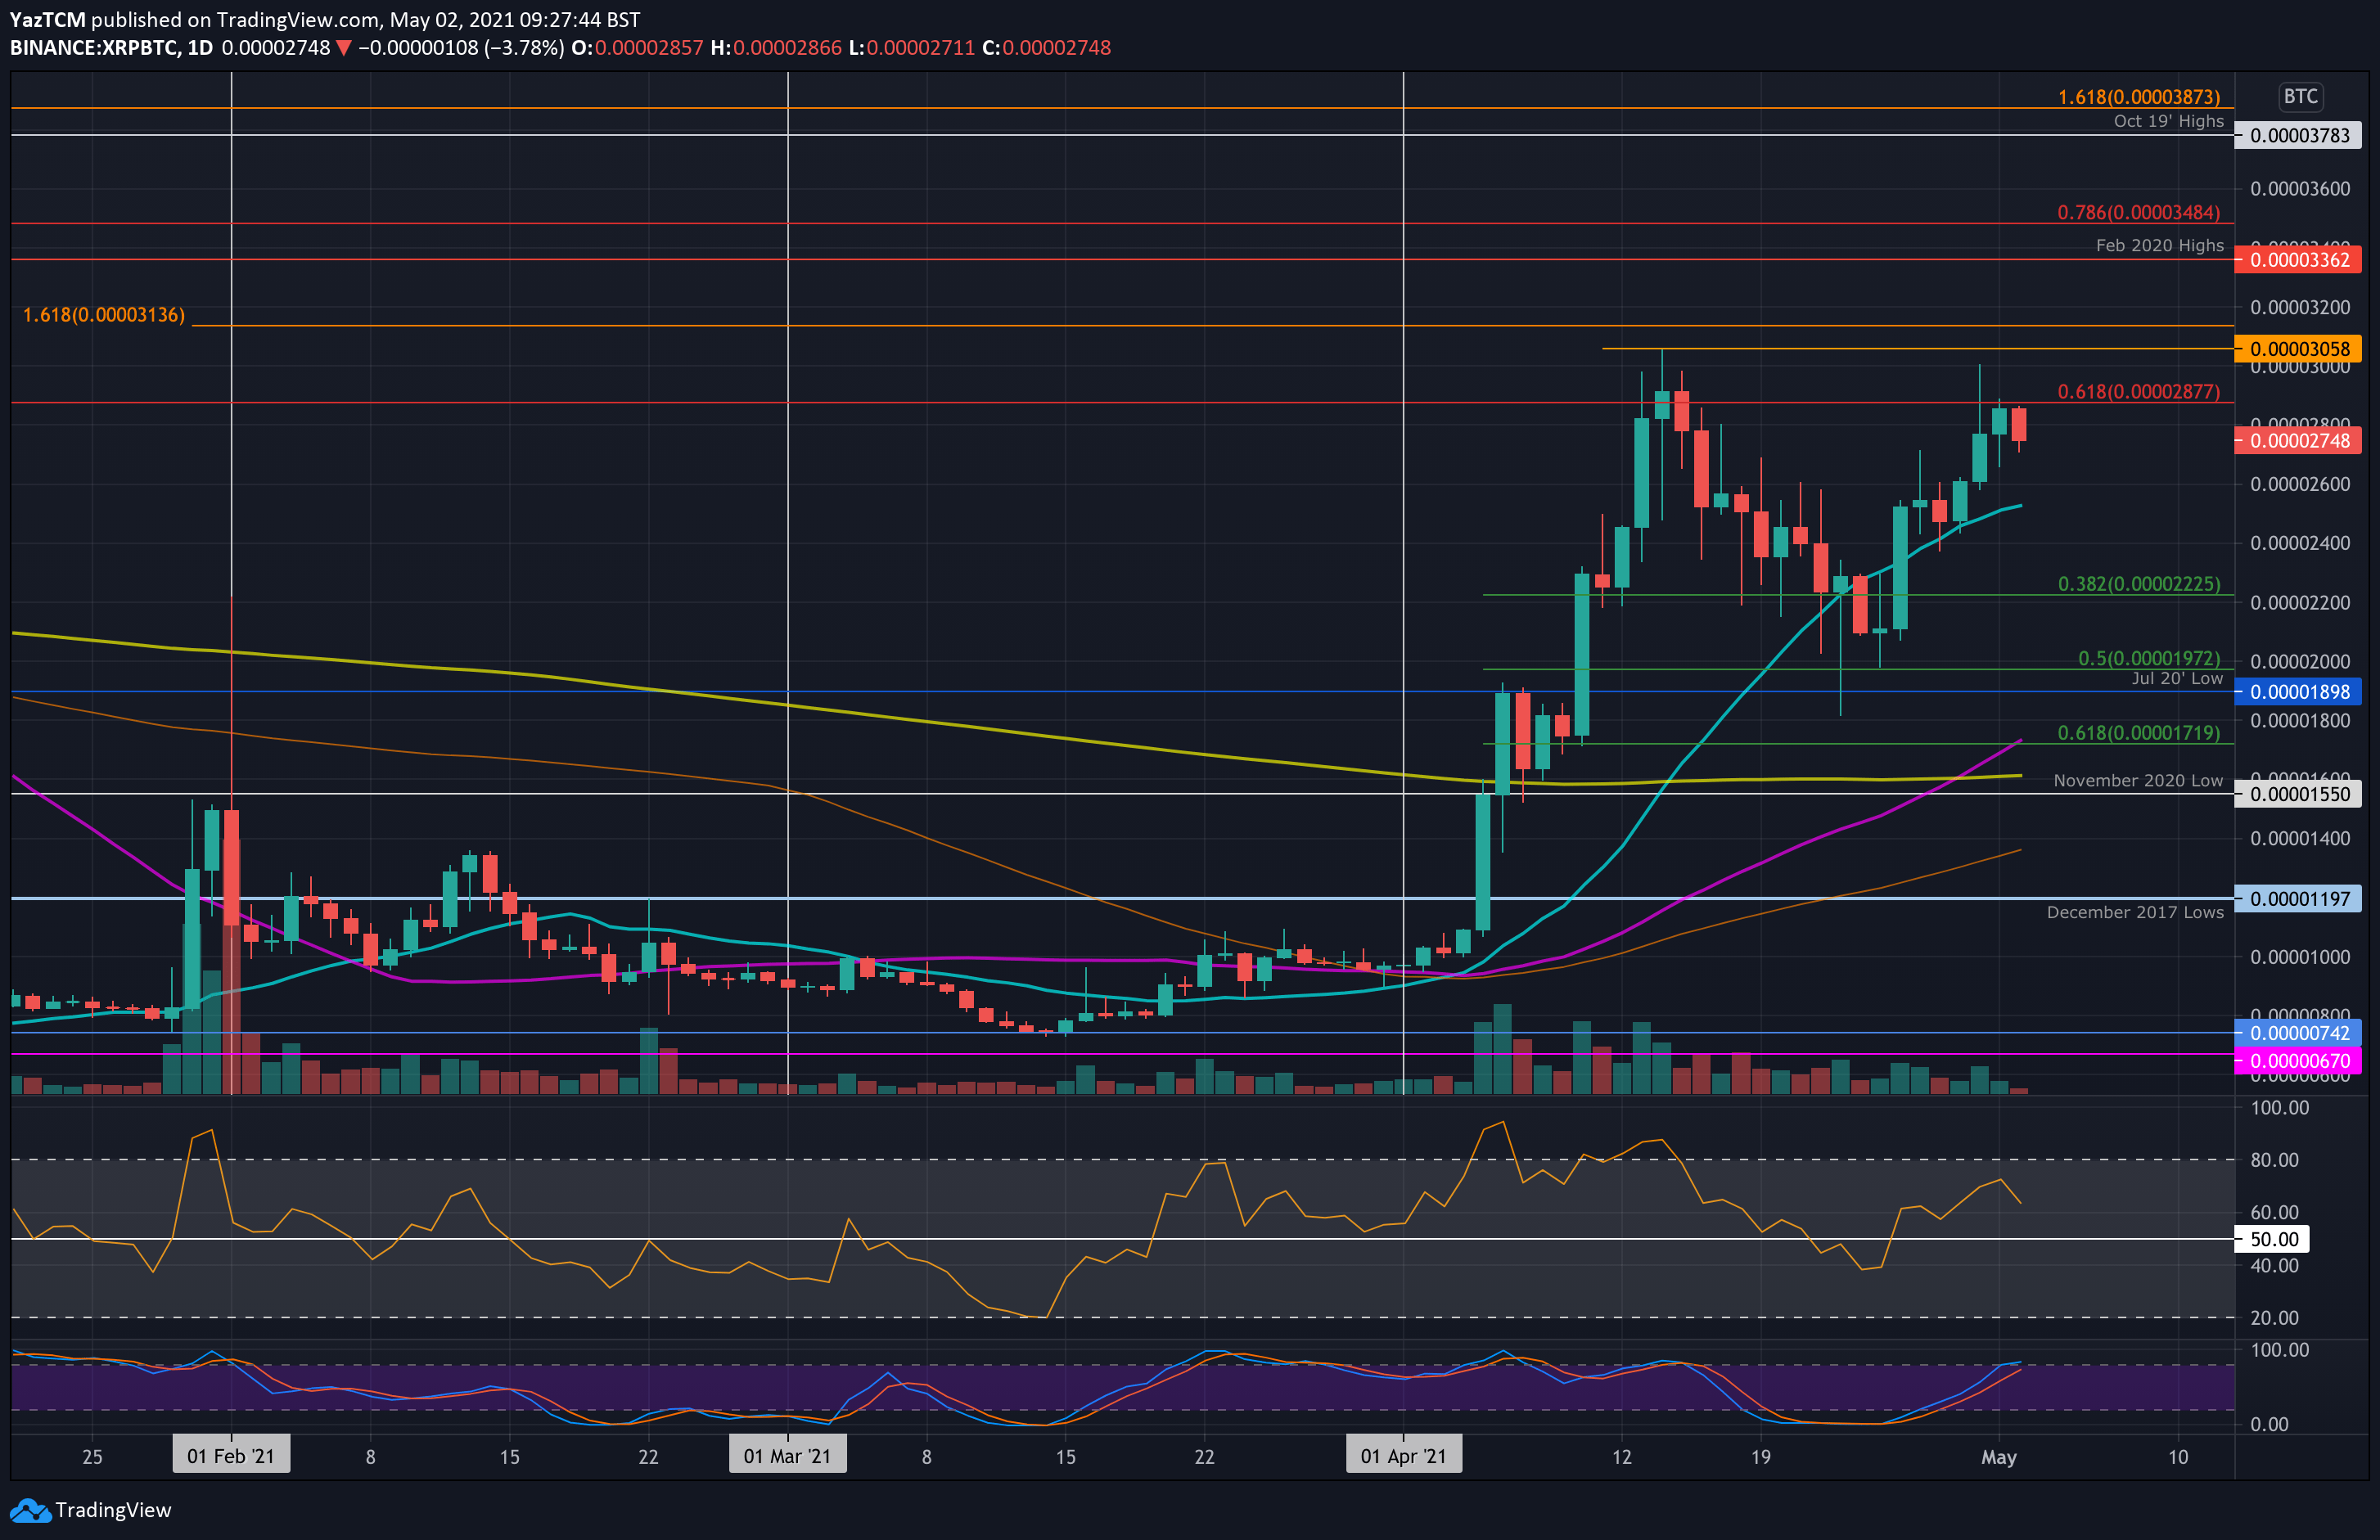
XRP/BTC – Bulls Fail To Overcome Bearish 0.618 Fib
Key Support Levels: 2450 SAT, 2225 SAT, 2000 SAT.
Key Resistance Levels: 2877 SAT, 3000 SAT – 3058 SAT, 3360 SAT.
XRP is also performing well against bitcoin. The coin rebounded from 2000 SAT at the start of the week as it broke above the 20-days MA and started to move higher.
The price surge continued throughout the week and even allowed XRP to spike as high as 3000 SAT on Friday. However, XRP failed to close a daily candle above resistance at 2875 SAT (bearish .618 Fib) yesterday and has since rolled over to the current 2750 SAT level (as of writing these lines).
XRP-BTC Short Term Price Prediction
Looking ahead, the first support lies at 2530 SAT (20-days MA). This is followed by 2225 SAT (.382 Fib), 2000 SAT, 1900 SAT (July 2020 low), and 1720 SAT (.618 Fib and 50-days MA).
On the other side, the first resistance lies at 2877 SAT (bearish .618 Fib). This is closely followed by 3000 SAT and 3058 SAT (April High). Beyond the April highs, resistance lies at 3360 SAT (Feb 2020 Highs) and 3485 SAT (bearish .786 Fib).
The RSI is also in the bullish favor right now as it sits above 60. However, it is also pointing lower indicating that the bullish momentum might be starting to fade in the short term.