XLM/USD – Epic 100% Surge Shocks Market As XLM Hits 31-Month HighKey Support Levels: %excerpt%.3, %excerpt%.289, %excerpt%.257.Key Resistance Levels: %excerpt%.373, %excerpt%.4, %excerpt%.418.XLM was pretty quiet during December. The coin was trading beneath a falling trend line for the entire month as it dropped into the %excerpt%.12 region. XLM would rebound from %excerpt%.12 at the start of 2021 and eventually break the falling trend line to reach %excerpt%.2 yesterday.Today, XLM continued higher from %excerpt%.2 and exploded by over 100% to reach as high as %excerpt%.4 – taking the bulls in the market by surprise and pushing it to a new 31-month high. It has since dropped slightly from this high as is now trading near %excerpt%.32.XLM/USD Daily Chart. Source: TradingViewXLM-USD Short Term Price PredictionLooking ahead, if the buyers push higher again, the first level
Topics:
Yaz Sheikh considers the following as important: Price Analysis, Stellar (XLM) Price, XLMBTC, XLMUSD
This could be interesting, too:
CryptoVizArt writes ETH’s Path to K Involves Maintaining This Critical Support (Ethereum Price Analysis)
Duo Nine writes Crypto Price Analysis June-29: ETH, XRP, ADA, DOGE, and DOT
Duo Nine writes Crypto Price Analysis June-15: ETH, XRP, ADA, DOGE, and DOT
Duo Nine writes Why is the Shiba Inu (SHIB) Price Down Today?
XLM/USD – Epic 100% Surge Shocks Market As XLM Hits 31-Month High
Key Support Levels: $0.3, $0.289, $0.257.
Key Resistance Levels: $0.373, $0.4, $0.418.
XLM was pretty quiet during December. The coin was trading beneath a falling trend line for the entire month as it dropped into the $0.12 region. XLM would rebound from $0.12 at the start of 2021 and eventually break the falling trend line to reach $0.2 yesterday.
Today, XLM continued higher from $0.2 and exploded by over 100% to reach as high as $0.4 – taking the bulls in the market by surprise and pushing it to a new 31-month high. It has since dropped slightly from this high as is now trading near $0.32.
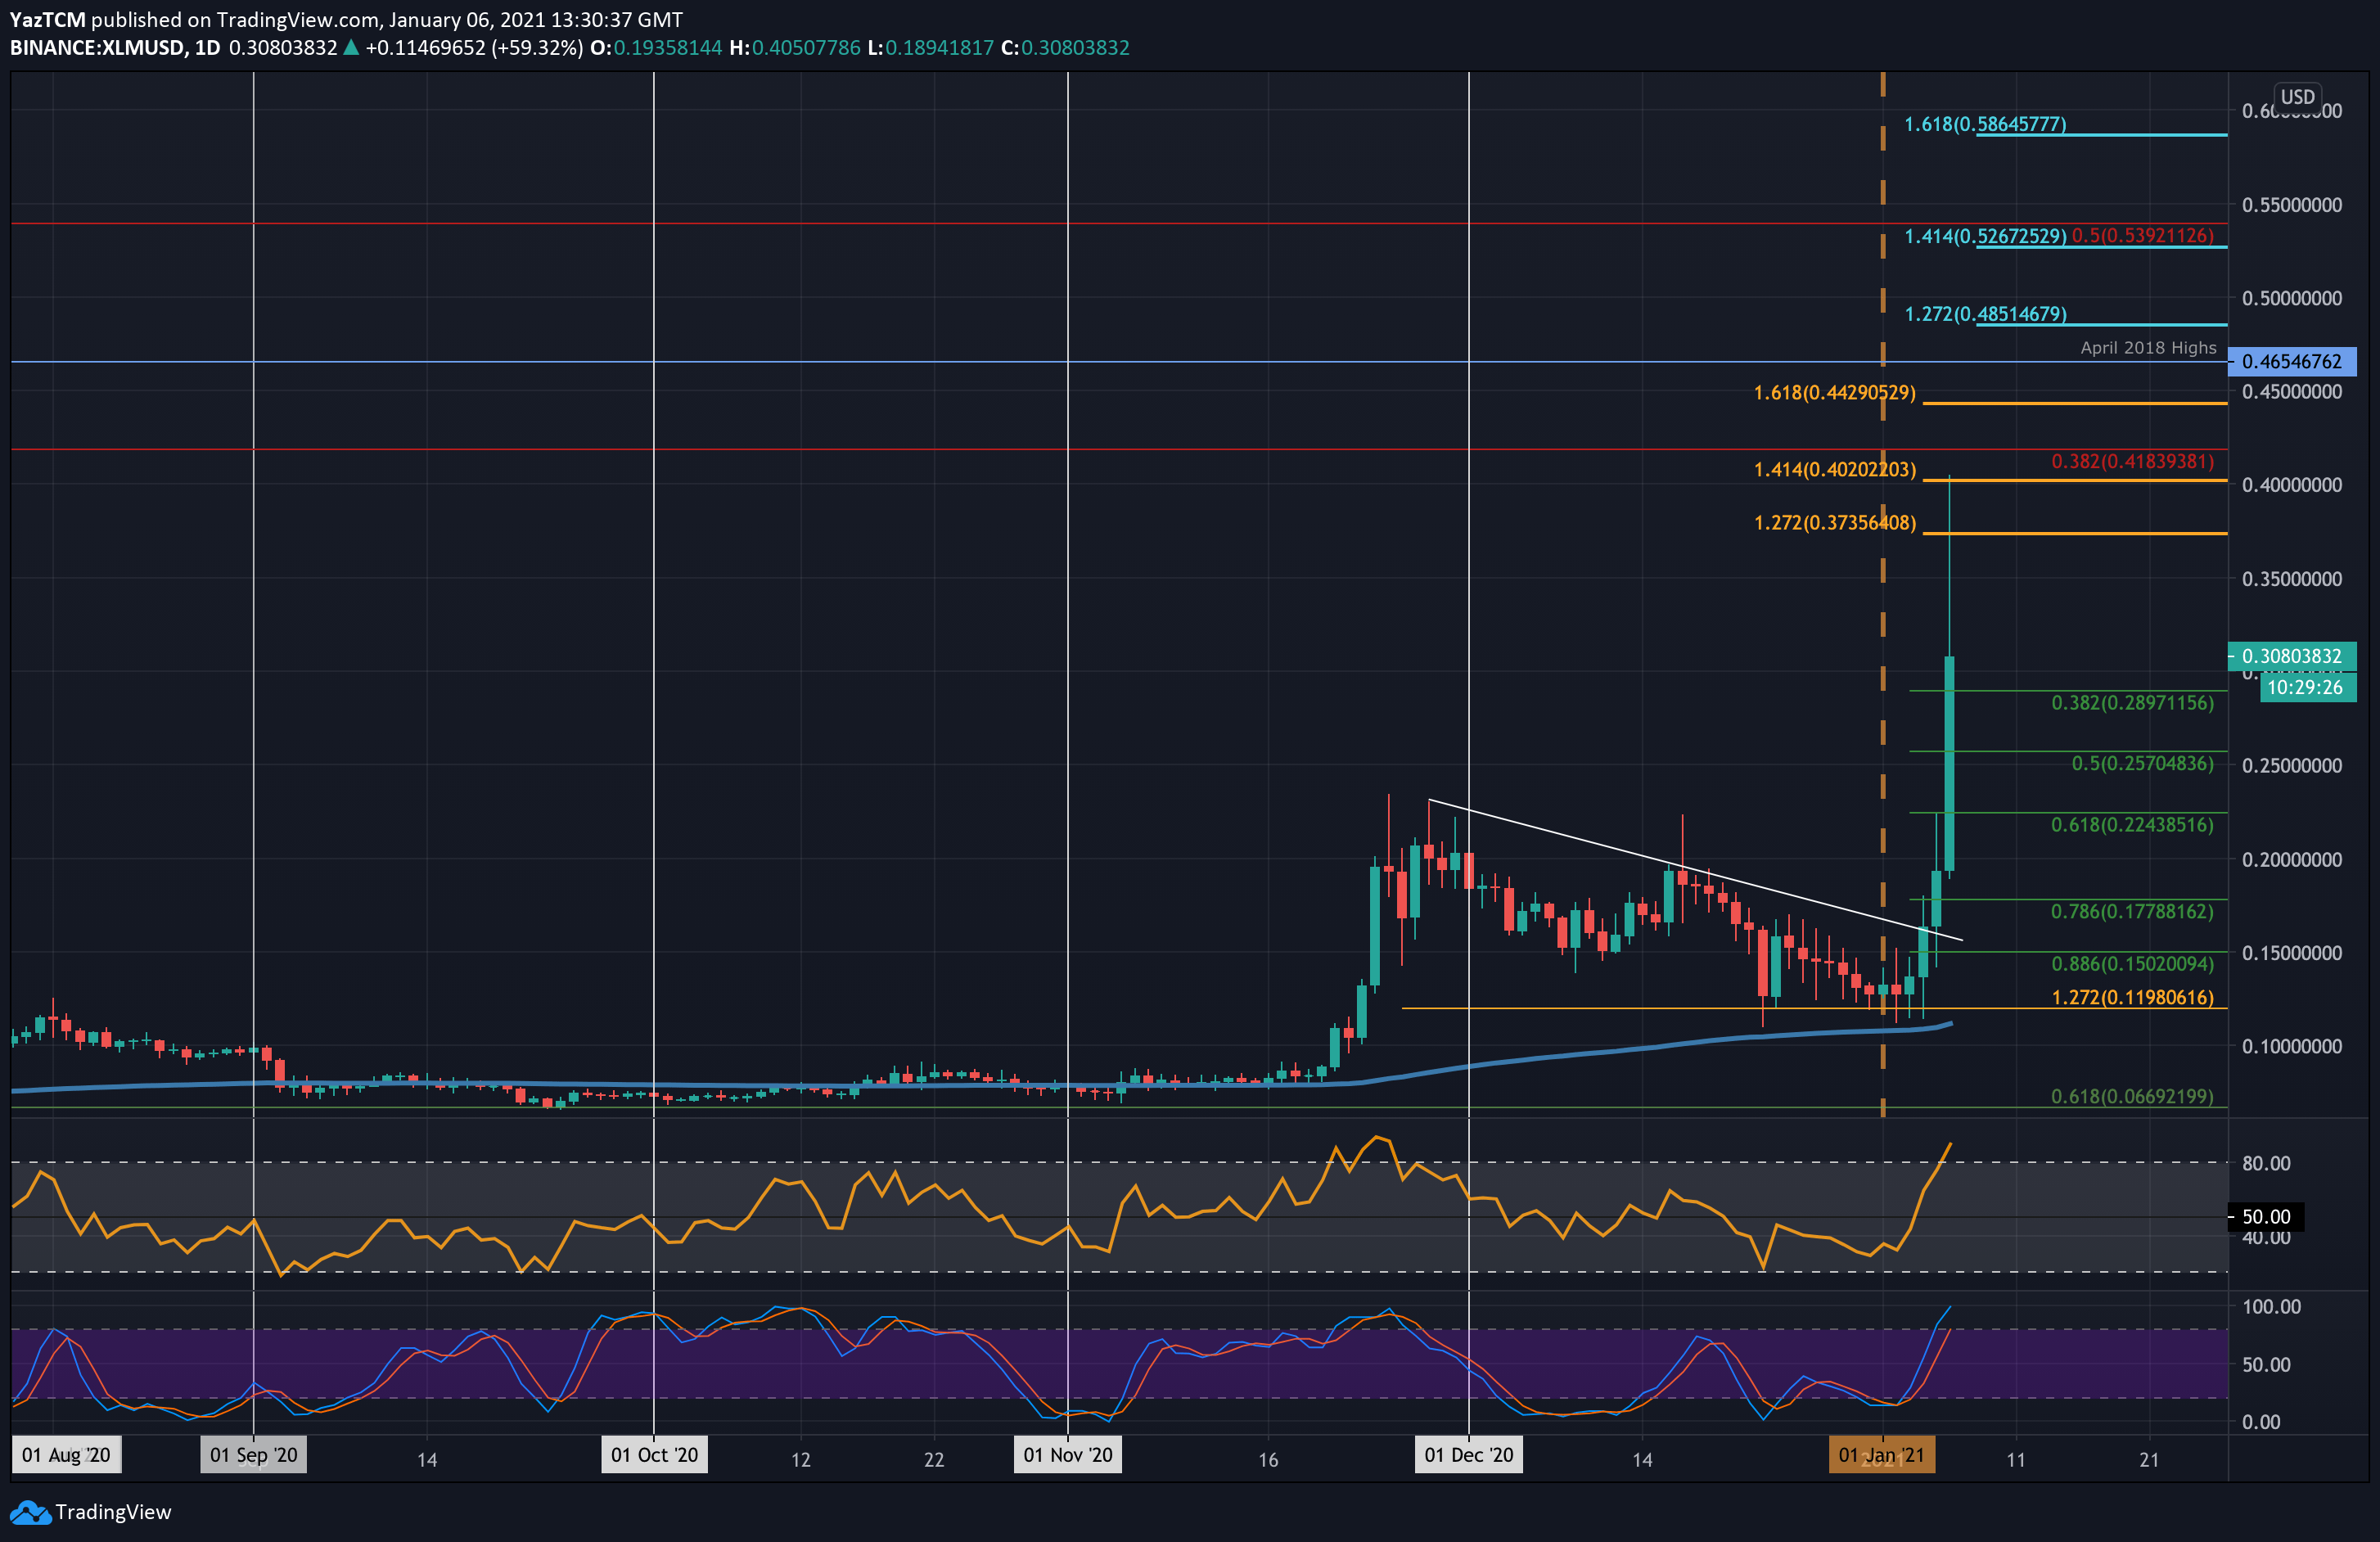
XLM-USD Short Term Price Prediction
Looking ahead, if the buyers push higher again, the first level of resistance lies at $0.35. This is followed by $0.373 (1.272 Fib Extension), $0.4 (1.414 Fib Extension & today’s high), and $0.418 (bearish .382 Fib Retracement).
Beyond $0.42, added resistance is expected at $0.443 (1.618 Fib Extension), $0.465 (April 2018 Highs), and $0.485.
On the other side, the first level of support beneath $0.3 lies at $0.289 (.236 Fib). This is followed by $0.257 (.5 Fib), $0.225 (.618 Fib), and $0.2.
As expected, the RSI is extremely overbought but is still yet to hit the November 2020 peak – suggesting there might be more room to move higher.
XLM/BTC – Bulls Push Beyond December 2020 Highs
Key Support Levels: 830 SAT, 740 SAT, 650 SAT.
Key Resistance Levels: 1000 SAT, 1090 SAT, 1130 SAT.
Against Bitcoin, XLM also surged by 97% to reach as high as 1130 SAT today. The coin dropped to multi-year lows in January 2021 as it hit the 360 SAT support. From there, it rebounded and started to push higher to meet the March 2020 low at 590 SAT yesterday.
Today, XLM continued beyond 590 SAT to break above the 200-days EMA at 730 SAT and break beyond 1000 SAT. It continued above 1000 SAT until reaching 1130 SAT. From there, it dropped back beneath 1000 SAT and is now trading near 900 SAT.
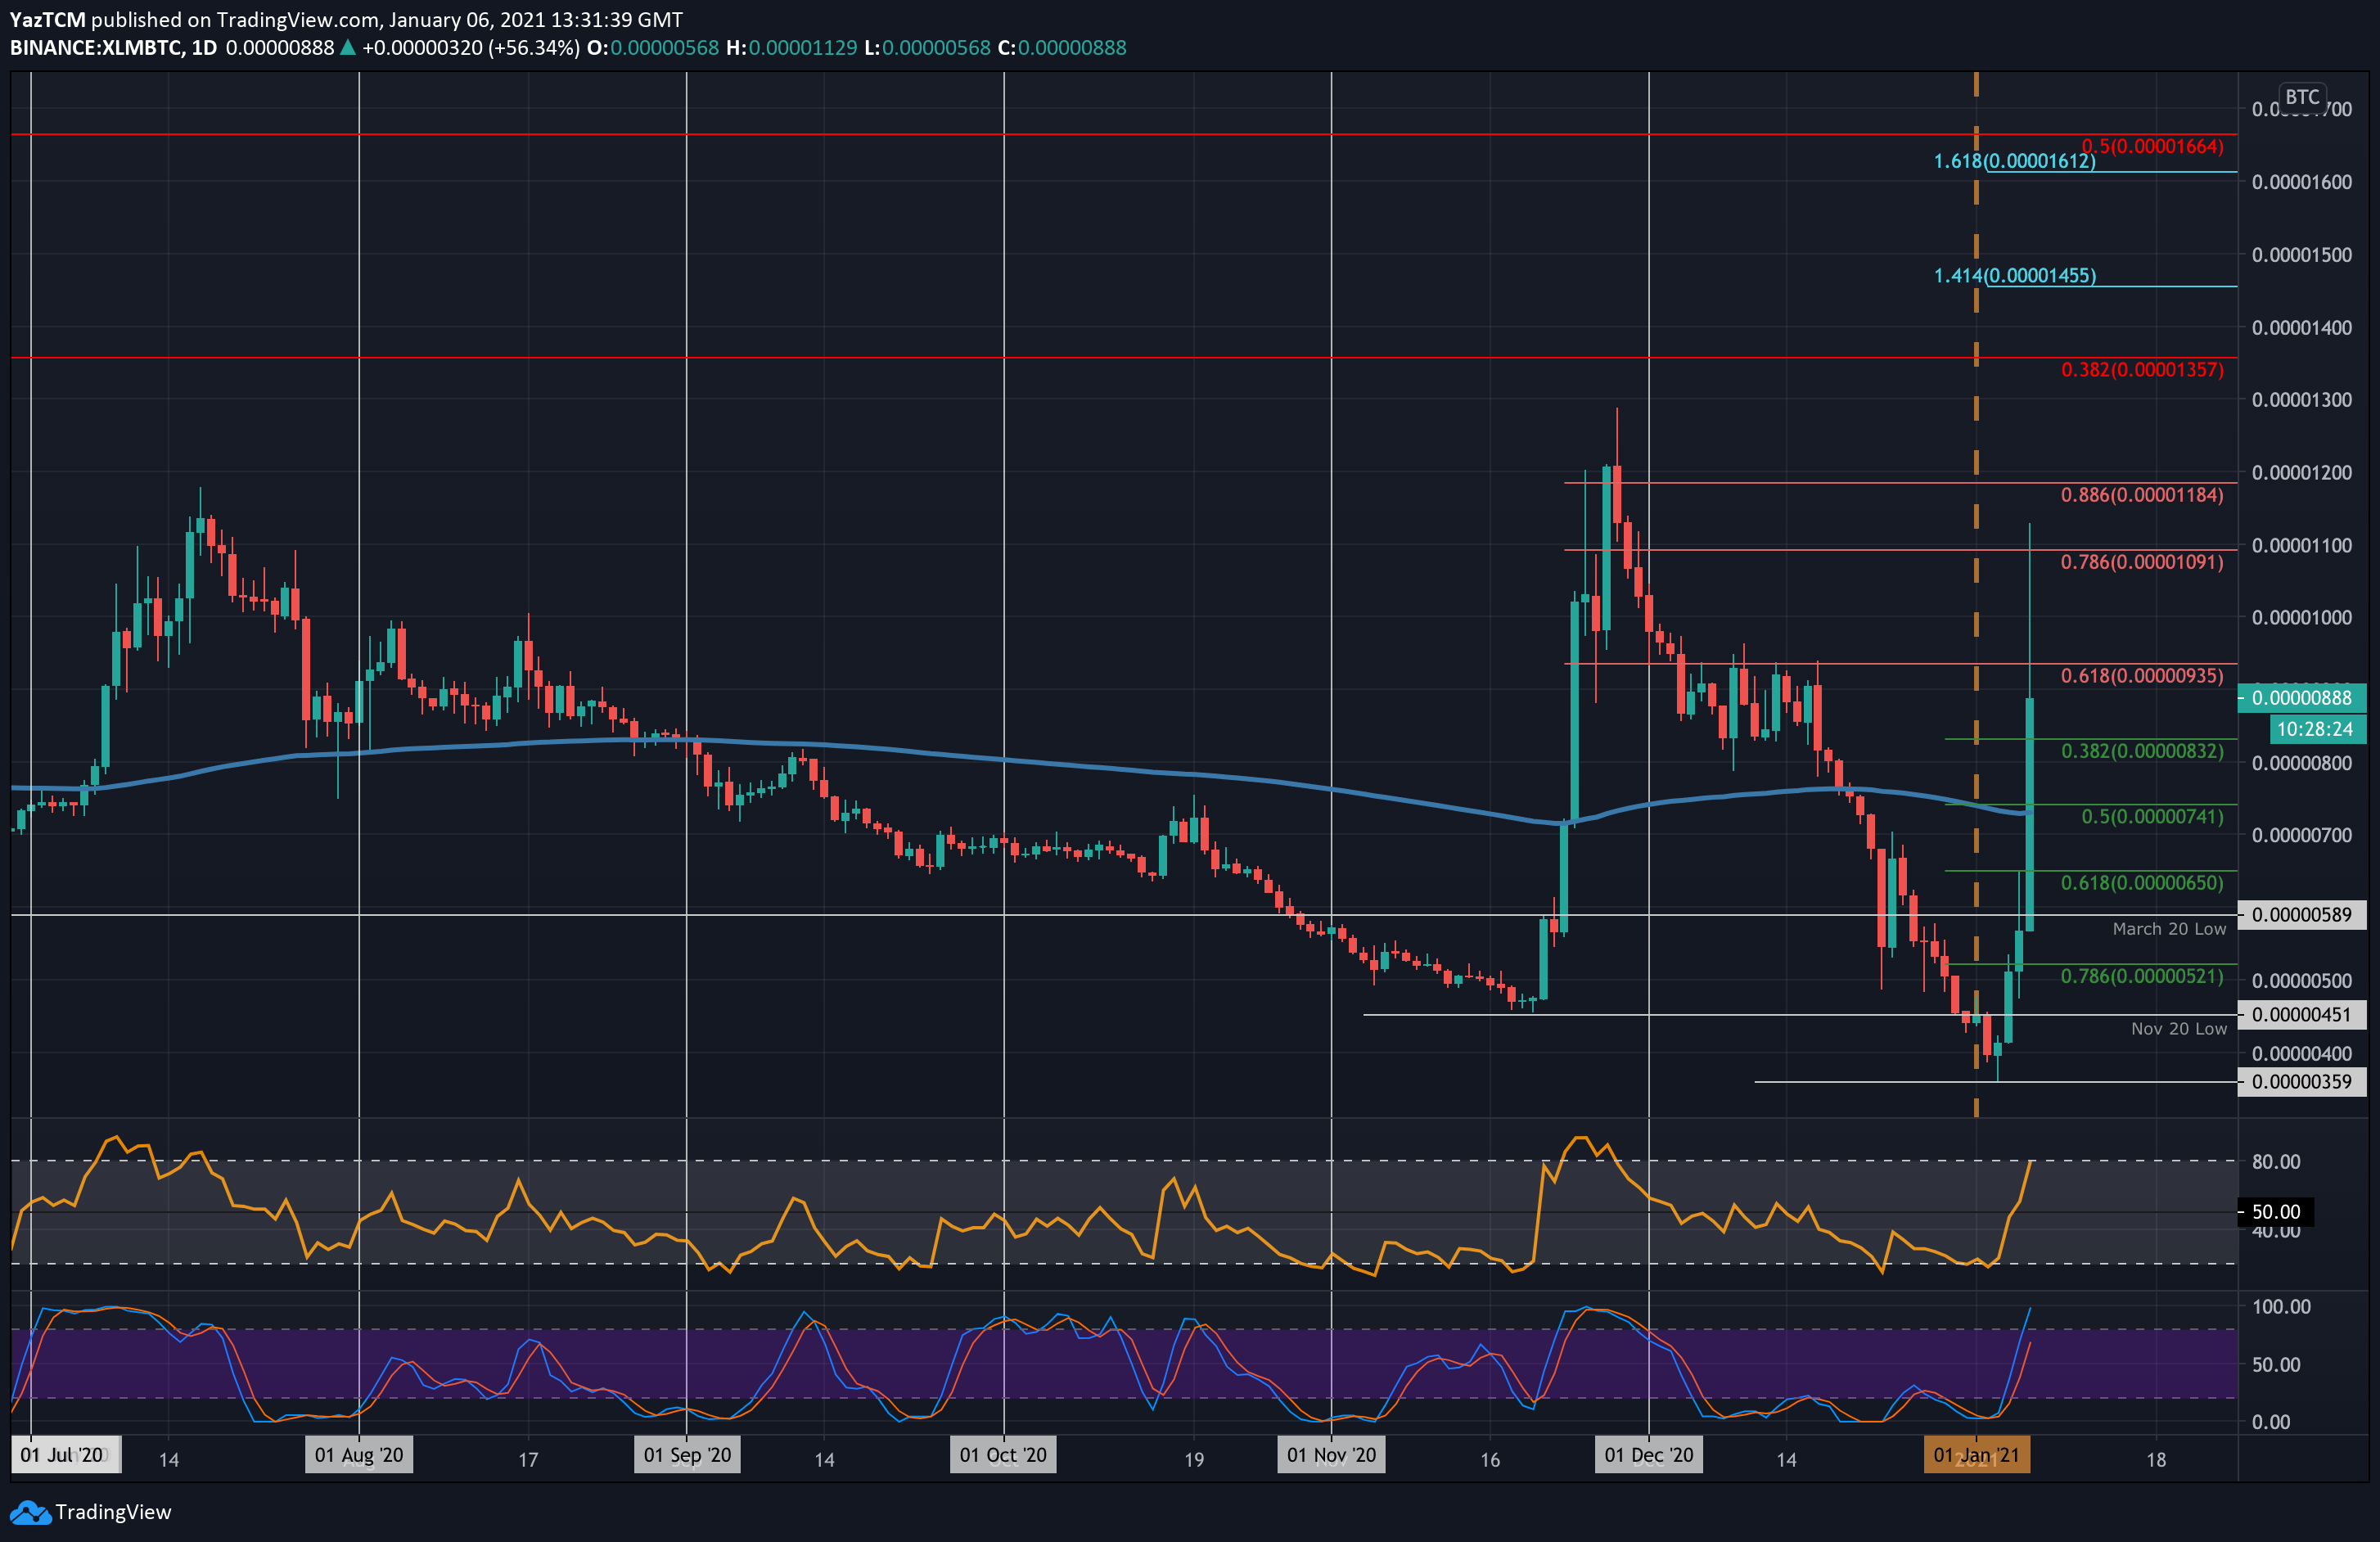
XLM-BTC Short Term Price Prediction
Looking ahead, the first level of resistance lies at 1000 SAT. This is followed by 1090 SAT (short term bearish .786 Fib), 1130 SAT (Today’s high), and 1185 SAT (short term bearish .886 Fib). Beyond 1200 SAT, added resistance lies at 1300 SAT, 1360 SAT (long term bearish .236 Fib), and 1455.
On the other side, the first level of support lies at 830 SAT (.382 Fib). This is followed by 740 SAT (.5 Fib & 200-days EMA), 650 SAT (.618 Fib), and 590 SAT (March 20 low).
Likewise, the RSI is overbought but still not as extreme as in November 2020 – suggesting room to push higher. Additionally, the Stochastic RSI is not yet overbought either.