The announcement that the Ripple vs SEC case would soon be settled led to a significant XRP price boost over the last few days. The below chart shows the highest volume traded in XRP since June 30 as a result of buying pressure. Technical Analysis By Grizzly The Daily Chart After bottoming out in June at roughly %excerpt%.28, the price of XRP surged by more than 30%. This mini-rally resulted in another attempt to break the key horizontal resistance at %excerpt%.4 (in red). However, so far, the critical level had rejected those attempts. In the previous attempt that happened in mid-August, the bears pushed the price to short-term support (in green) around %excerpt%.32. After retesting this level multiple times, making it a local bottom, Ripple bounced back for another retest of the %excerpt%.4 level.
Topics:
CryptoVizArt considers the following as important: Ripple (XRP) Price, XRP Analysis, xrpbtc, xrpusd
This could be interesting, too:
Dimitar Dzhondzhorov writes Is a Major Ripple v. SEC Lawsuit Development Expected This Week? Here’s Why
Mandy Williams writes Ripple Releases Institutional DeFi Roadmap for XRP Ledger in 2025
Dimitar Dzhondzhorov writes Ripple Whales Go on a Selling Spree: Is XRP Headed for a Further Correction?
Jordan Lyanchev writes ChatGPT and DeepSeek Analyze Ripple’s (XRP) Price Potential for 2025
The announcement that the Ripple vs SEC case would soon be settled led to a significant XRP price boost over the last few days. The below chart shows the highest volume traded in XRP since June 30 as a result of buying pressure.
Technical Analysis
By Grizzly
The Daily Chart
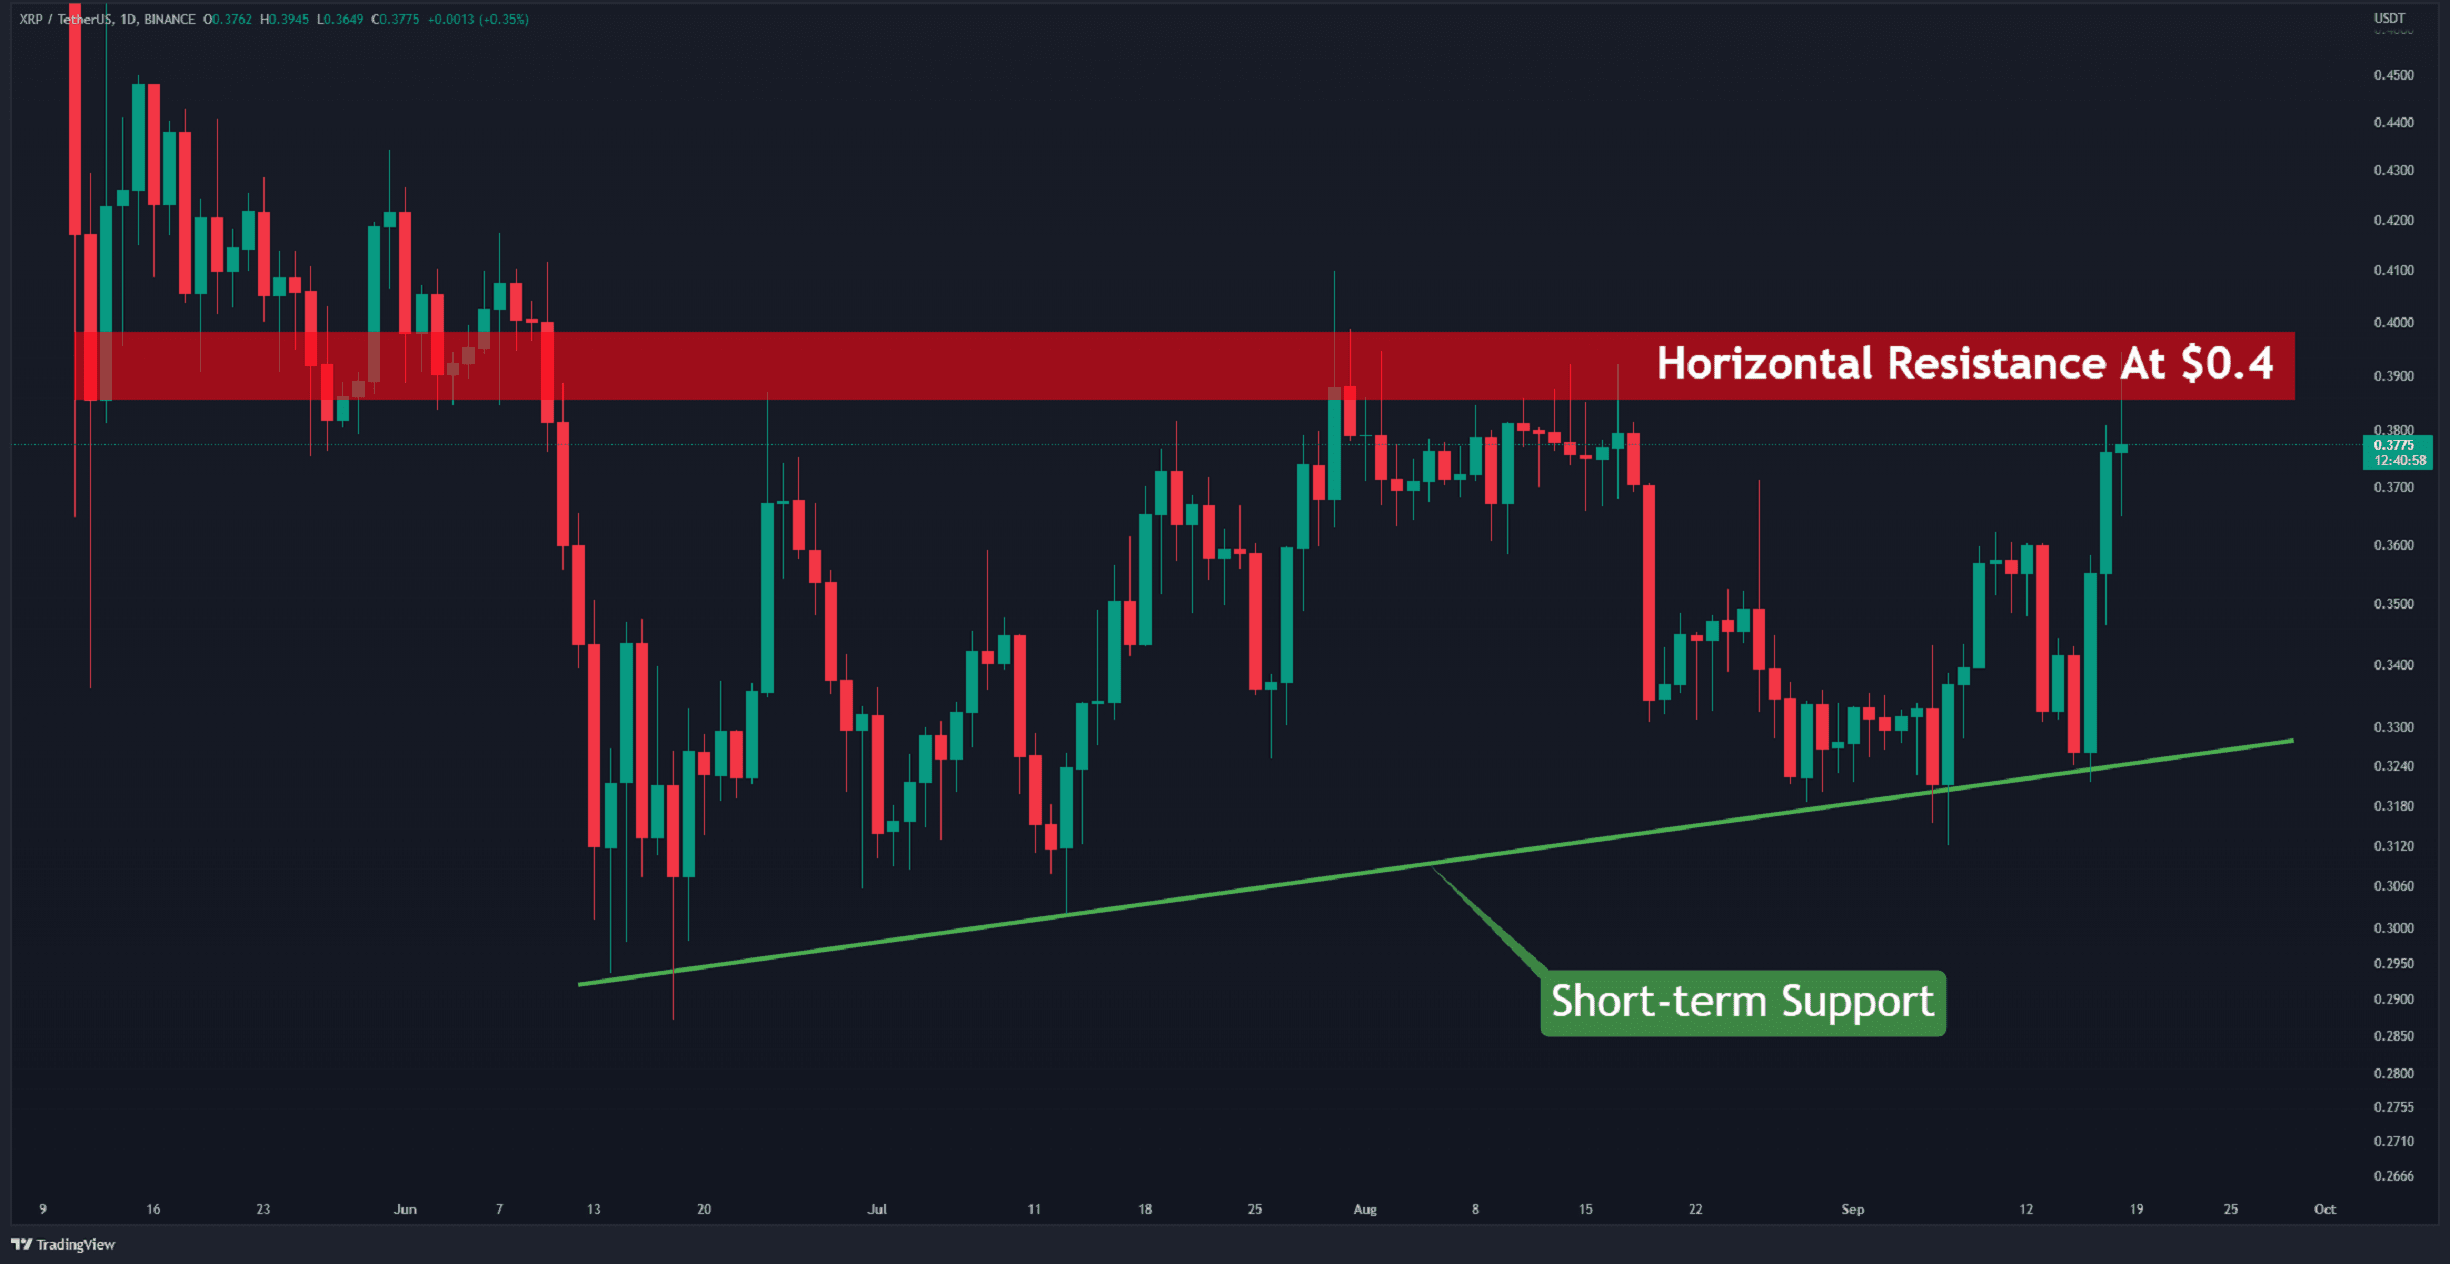
After bottoming out in June at roughly $0.28, the price of XRP surged by more than 30%. This mini-rally resulted in another attempt to break the key horizontal resistance at $0.4 (in red). However, so far, the critical level had rejected those attempts.
In the previous attempt that happened in mid-August, the bears pushed the price to short-term support (in green) around $0.32. After retesting this level multiple times, making it a local bottom, Ripple bounced back for another retest of the $0.4 level. A daily close above the level will be the first sign for the next possible bullish wave.
The asset may break out from the 100-day consolidation period as a result of such a move, though, as of yet, the bears haven’t allowed this to occur. This bullish structure is valid as long as the price sustains support at $0.35.
Key Support Levels: $0.35 & $0.32
Key Resistance Levels: $0.40 & $0.50
Daily Moving Averages:
MA20: $0.34
MA50: $0.35
MA100: $0.34
MA200: $0.49
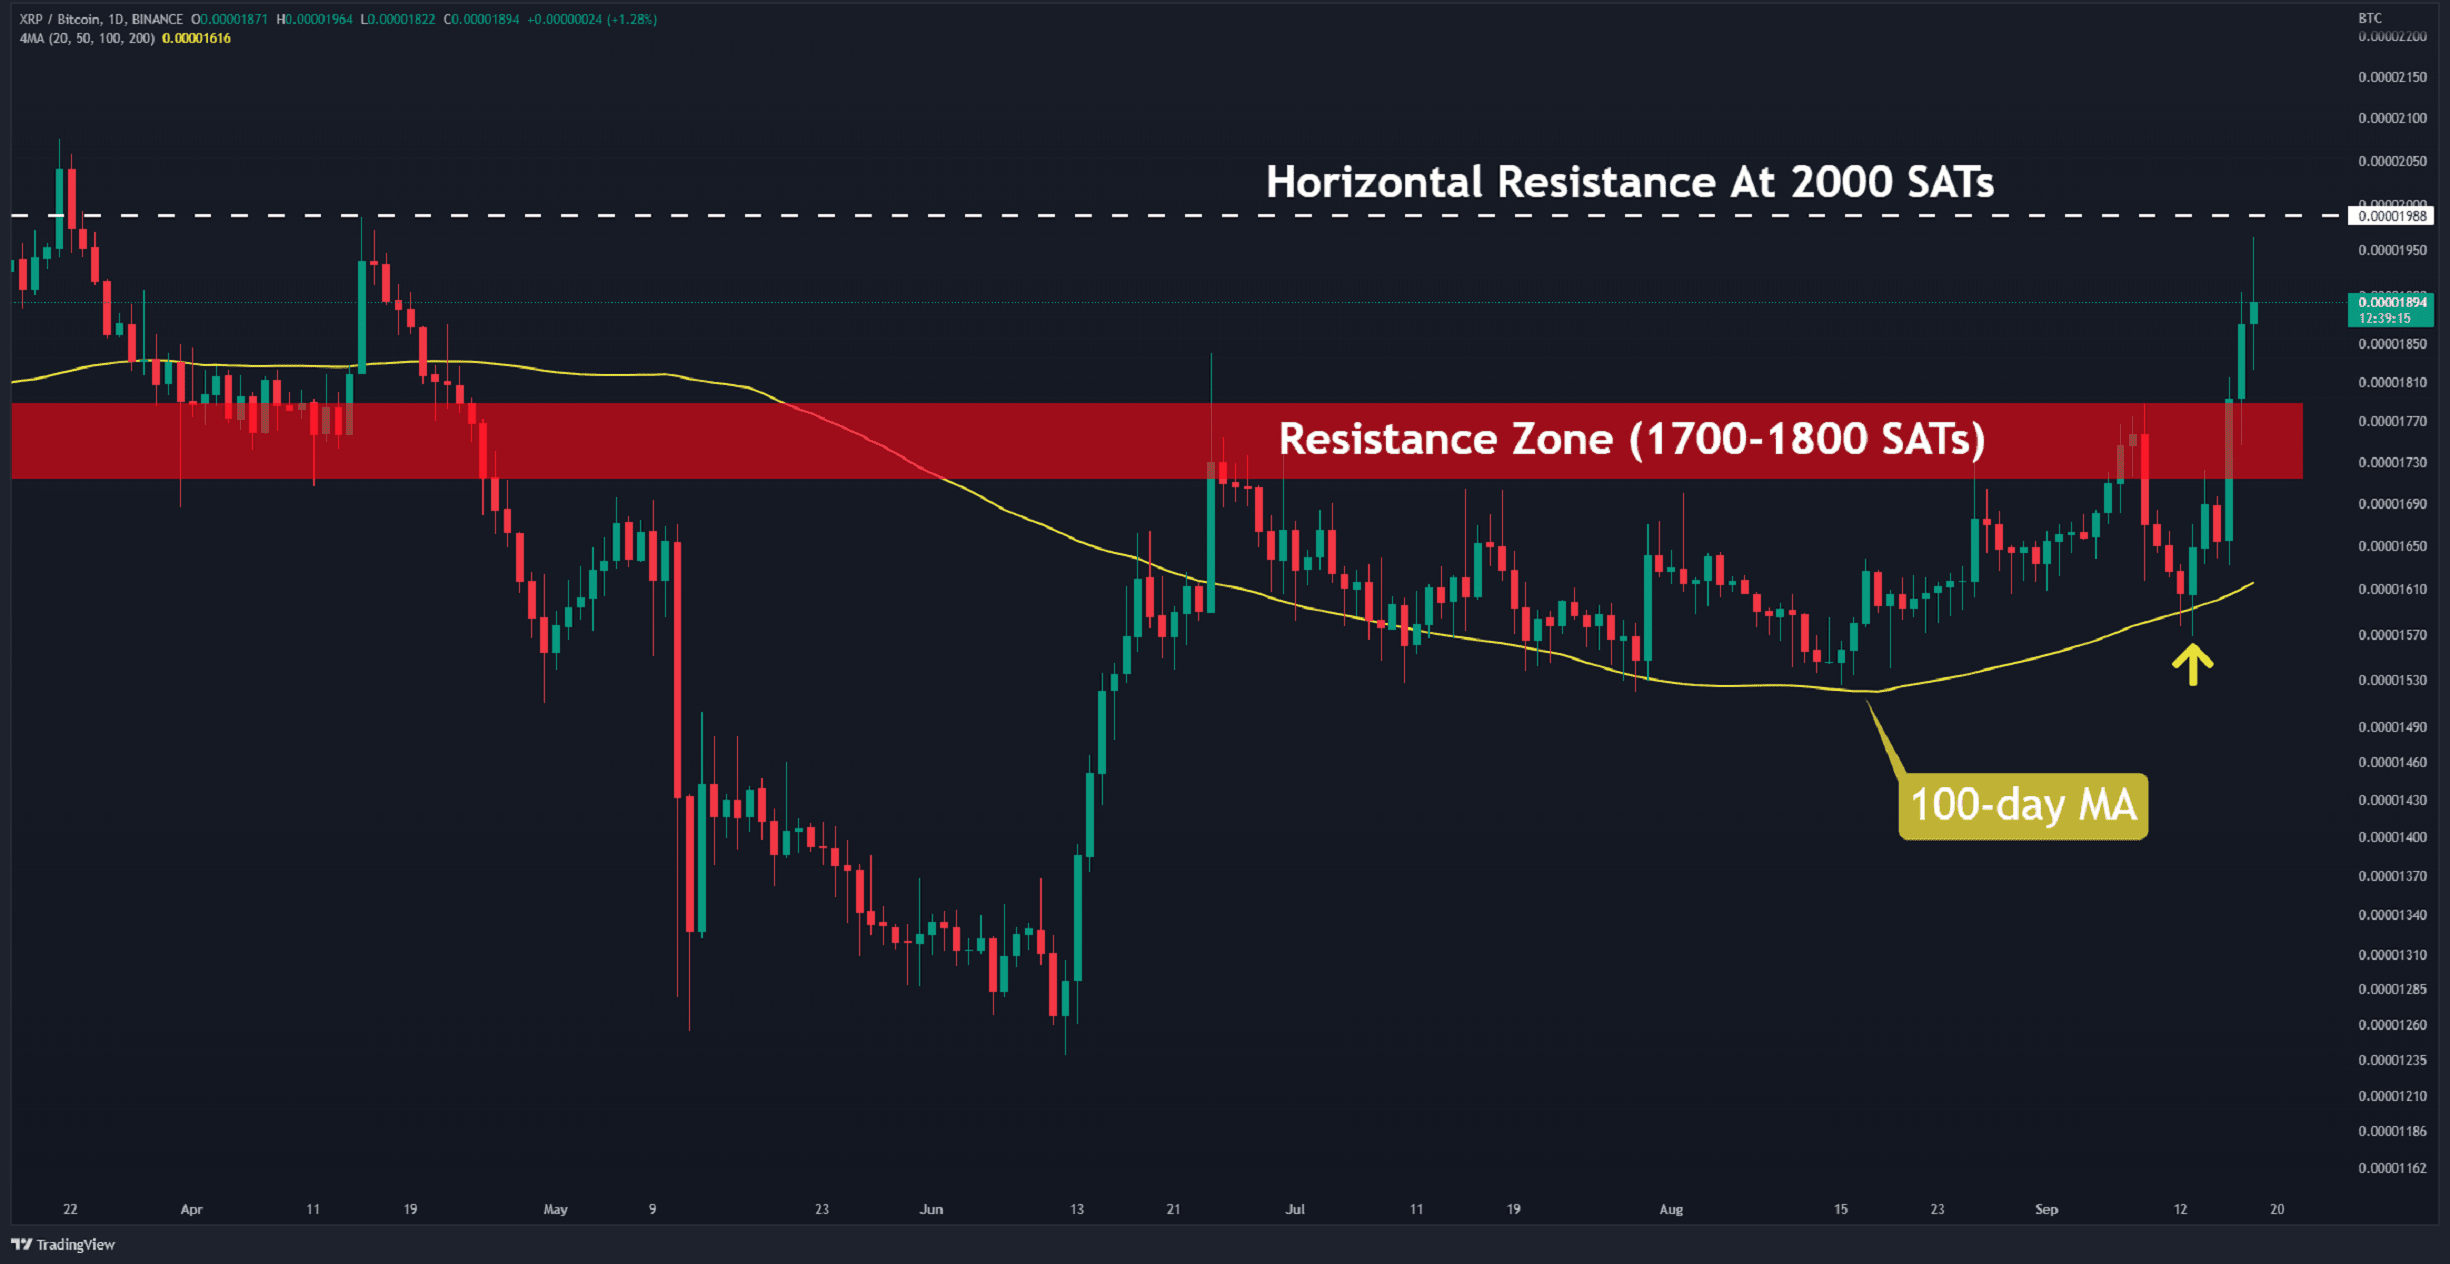
The XRP/BTC Chart
Against Bitcoin, the bulls clearly dominate the market. They have pushed the price above the barrier in the $1,700–1,800 area (in red). If the bullish sentiment continues, the next obstacle will be found at 2000 SATs (in white).
However, a retest of the 1800 SAT zone (to confirm as support) is also likely. If the buyers manage to hold the pair above the red zone, the next bullish target- 2000 SAT – becomes likely.
Key Support Levels: 1800 SATs & 1550 SATs
Key Resistance Levels: 2000 SATs & 2150 SATs