After Ripple ended April with a 34% red candlestick, it is now on the monthly Fibonacci Retracement at 0.786, and many expect the one-year downtrend to end. Technical Analysis By Grizzly The Daily Chart: Chart by TradingViewOn the daily timeframe, after the price could not break the descending line at the end of March, the bears pushed XRP down by 40%. Ripple is currently on the horizontal support in the range of %excerpt%.5-%excerpt%.55, which has so far acted well. The RSI indicator has also entered the oversold zone, which can technically be a bullish signal. Ripple might be on its way to starting an uptrend from current levels, in which case the first resistance is at %excerpt%.68 and then %excerpt%.8. If, for any reason, the bulls can not defend this support, then the price is likely to fall to
Topics:
George Georgiev considers the following as important: Ripple (XRP) Price, XRP Analysis, xrpbtc, xrpusd
This could be interesting, too:
Dimitar Dzhondzhorov writes Is a Major Ripple v. SEC Lawsuit Development Expected This Week? Here’s Why
Mandy Williams writes Ripple Releases Institutional DeFi Roadmap for XRP Ledger in 2025
Dimitar Dzhondzhorov writes Ripple Whales Go on a Selling Spree: Is XRP Headed for a Further Correction?
Jordan Lyanchev writes ChatGPT and DeepSeek Analyze Ripple’s (XRP) Price Potential for 2025
After Ripple ended April with a 34% red candlestick, it is now on the monthly Fibonacci Retracement at 0.786, and many expect the one-year downtrend to end.
Technical Analysis
By Grizzly
The Daily Chart:
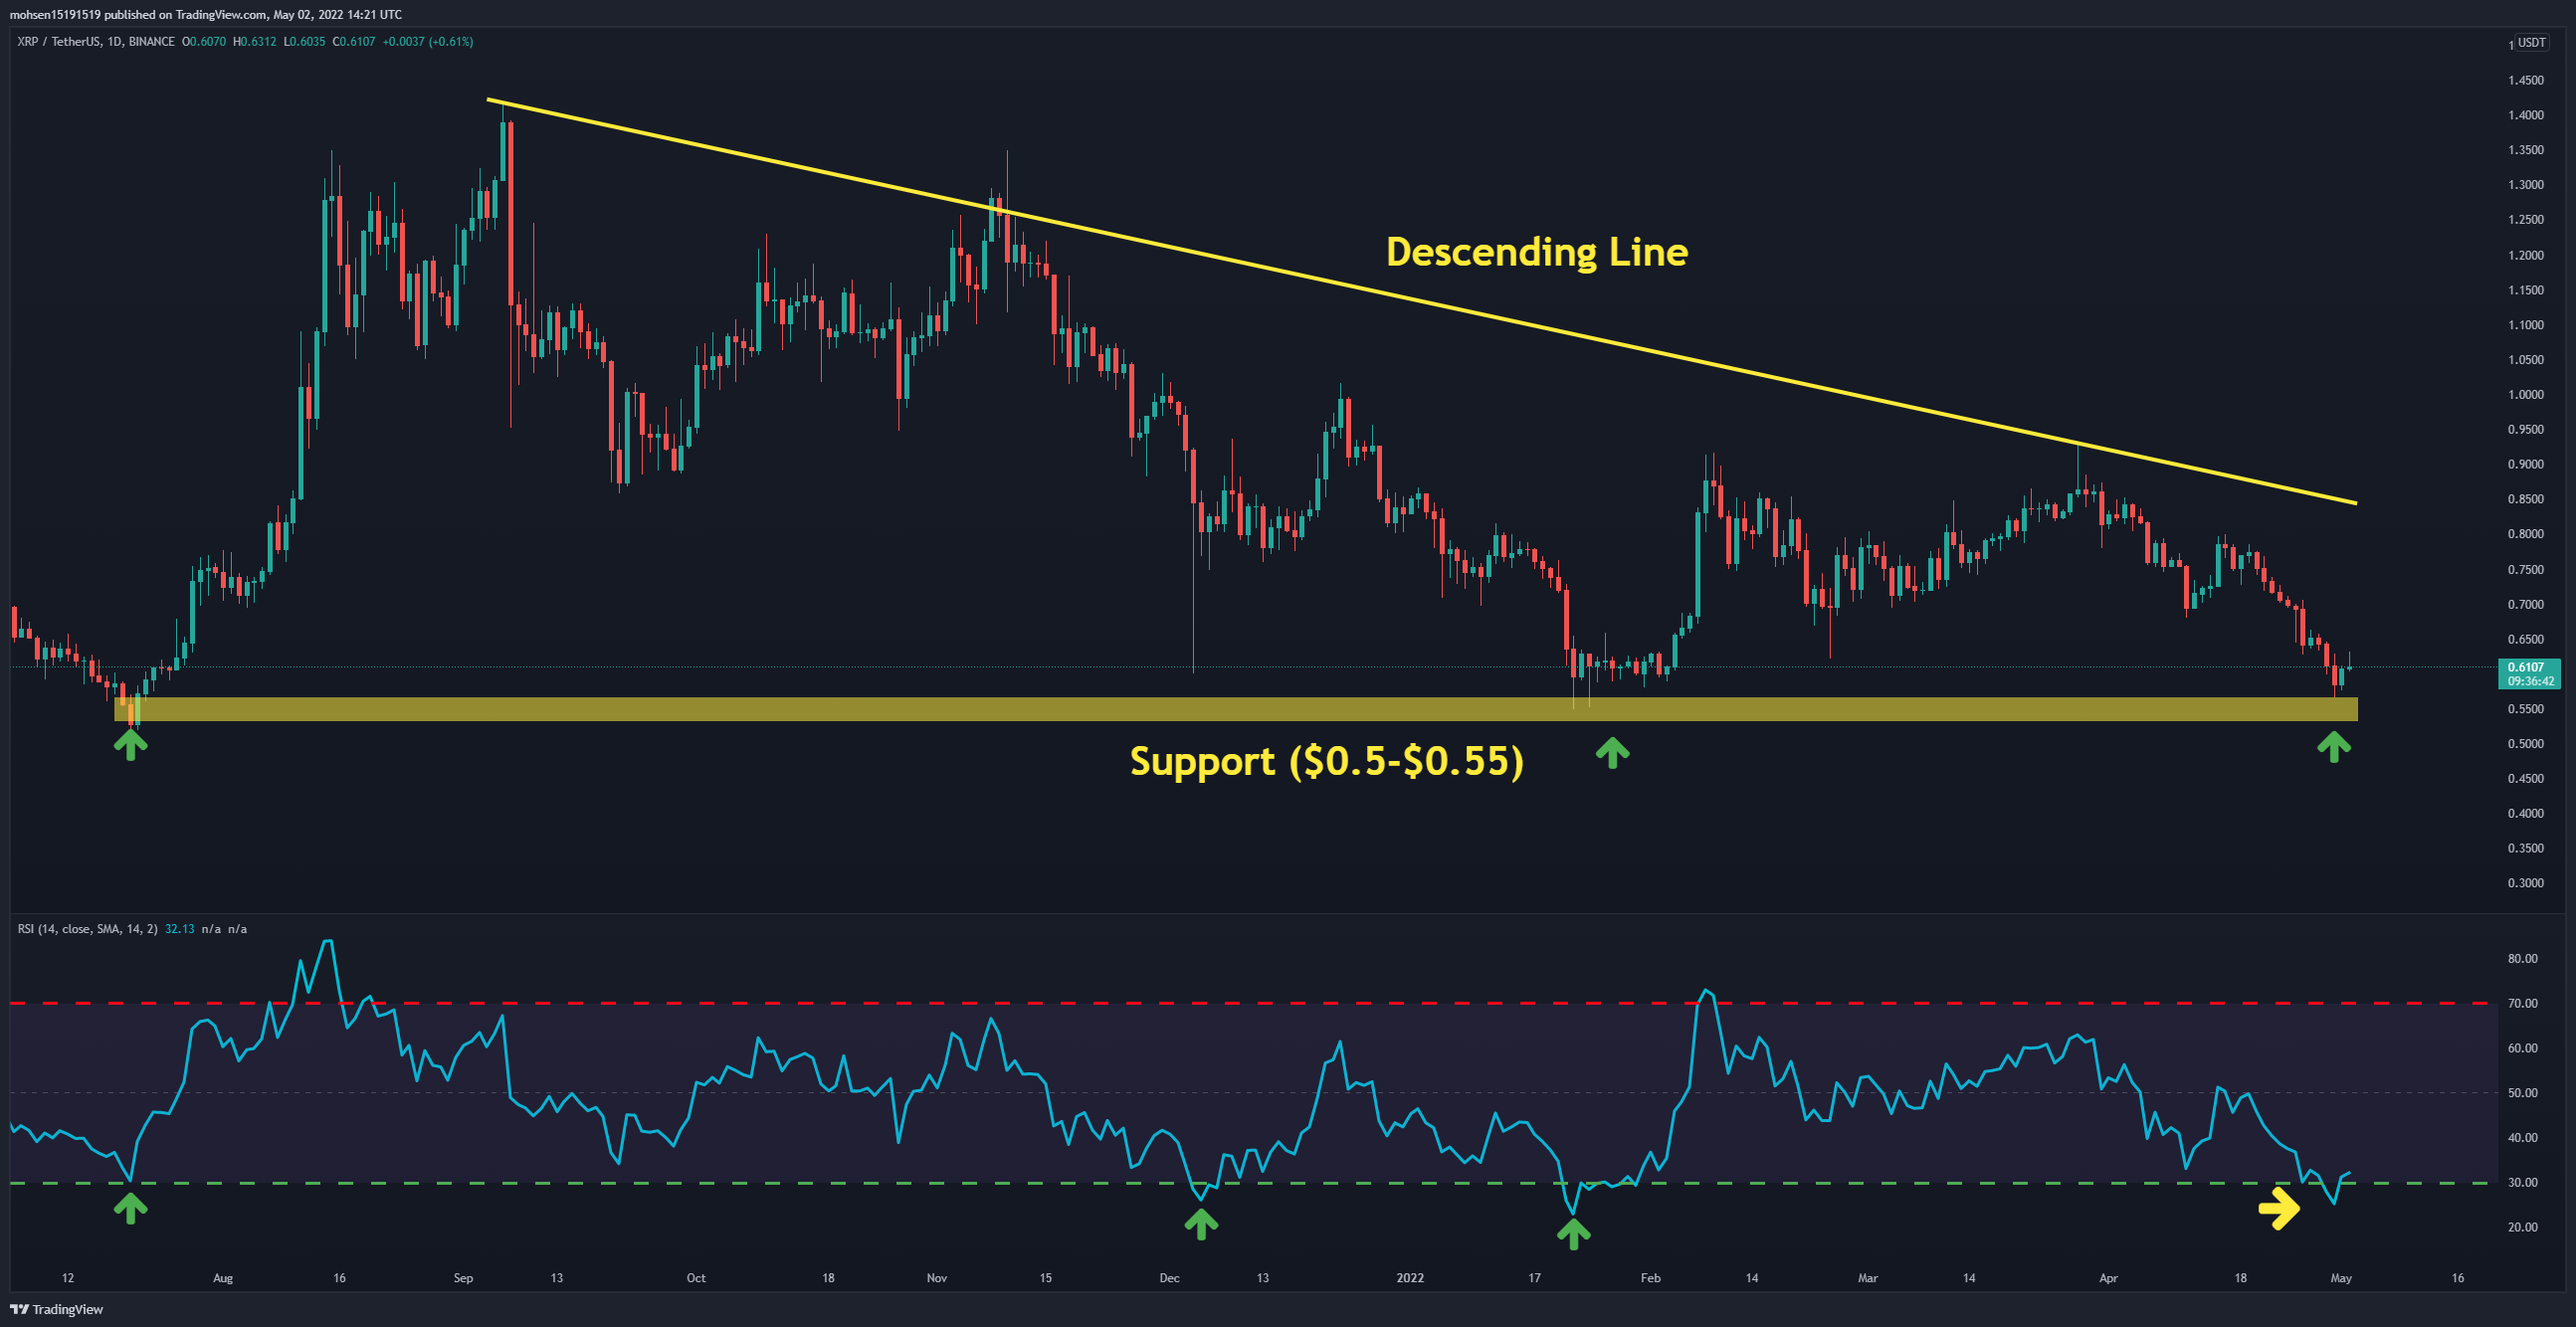
On the daily timeframe, after the price could not break the descending line at the end of March, the bears pushed XRP down by 40%. Ripple is currently on the horizontal support in the range of $0.5-$0.55, which has so far acted well.
The RSI indicator has also entered the oversold zone, which can technically be a bullish signal. Ripple might be on its way to starting an uptrend from current levels, in which case the first resistance is at $0.68 and then $0.8. If, for any reason, the bulls can not defend this support, then the price is likely to fall to around $0.4.
Moving Averages:
MA20: $0.70
MA50: $0.76
MA100: $0.74
MA200: $0.85
The 4-Hour Chart:
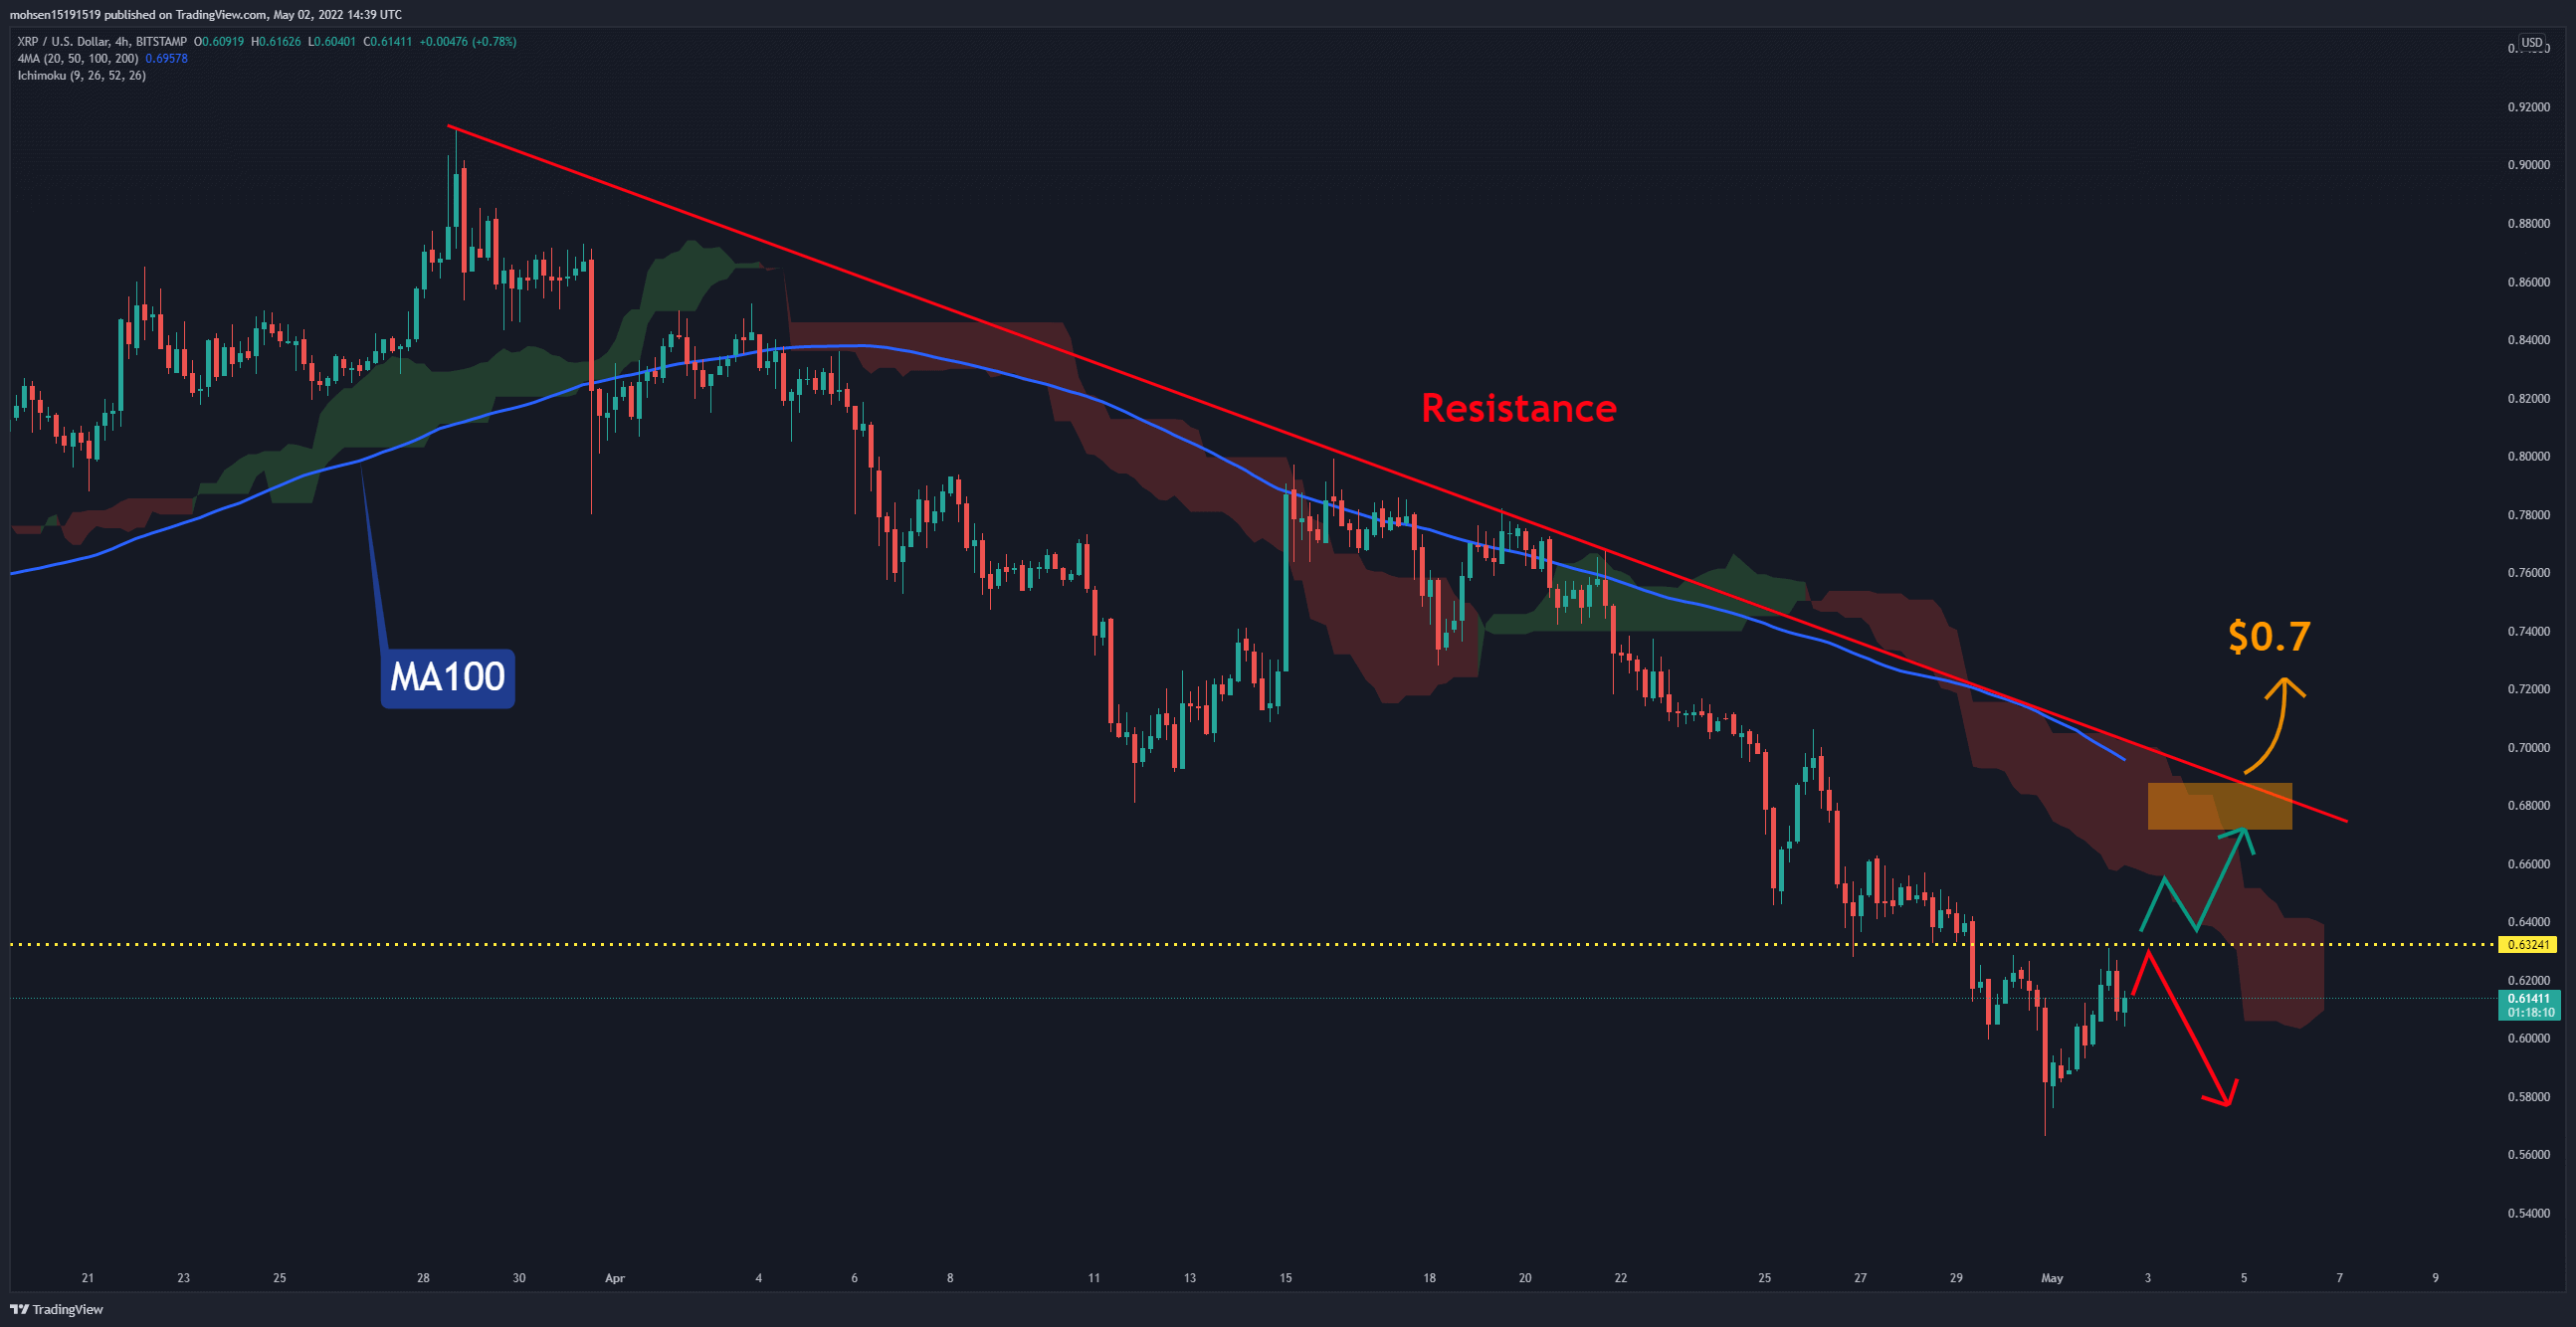
In the 4-hour timeframe, the first challenge for Ripple is to break the horizontal resistance (marked yellow) at $0.63, as it failed to do so in the first attempt. However, the main barrier is the intersection of Ichimoku cloud and dynamic resistance (marked red), with the MA100 at $0.7. If the price fails to cross the static resistance, the range of $0.5-$0.55 will be more likely to be retested.