After some hard days, SHIB is starting to give clear bullish signals that may emerge in the renewal of a possible price rally. Key Support level: %excerpt%.000018 Key Resistance level: %excerpt%.000023 While SHIB continues to consolidate under the key resistance at %excerpt%.000023, the MACD has turned bullish. The longer price maintains its current level the higher the chance for a breakout. The support at %excerpt%.000018 is unlikely to be retested if this momentum continues. Chart by TradingViewTechnical Indicators Trading Volume: Volume remains low. However, the buy-side seems to be leading the price action with four green days in the past week. RSI: The daily RSI left the oversold area and is currently found at 35 points. In order to make a higher high and start an uptrend, the RSI needs to go
Topics:
Duo Nine considers the following as important: Price Analysis, Shiba Inu (SHIB), SHIBBTC, SHIBUSD
This could be interesting, too:
Jordan Lyanchev writes Why Has Shiba Inu’s (SHIB) Price Skyrocketed by 25% Today?
Dimitar Dzhondzhorov writes Major Shiba Inu (SHIB) Warning: Team Sounds the Alarm
Chayanika Deka writes Financial Nihilism Fuels Meme Coin Frenzy as Traditional Finance Loses Appeal: Binance
Dimitar Dzhondzhorov writes 3 Bullish Signs for the Shiba Inu (SHIB) Price to Watch
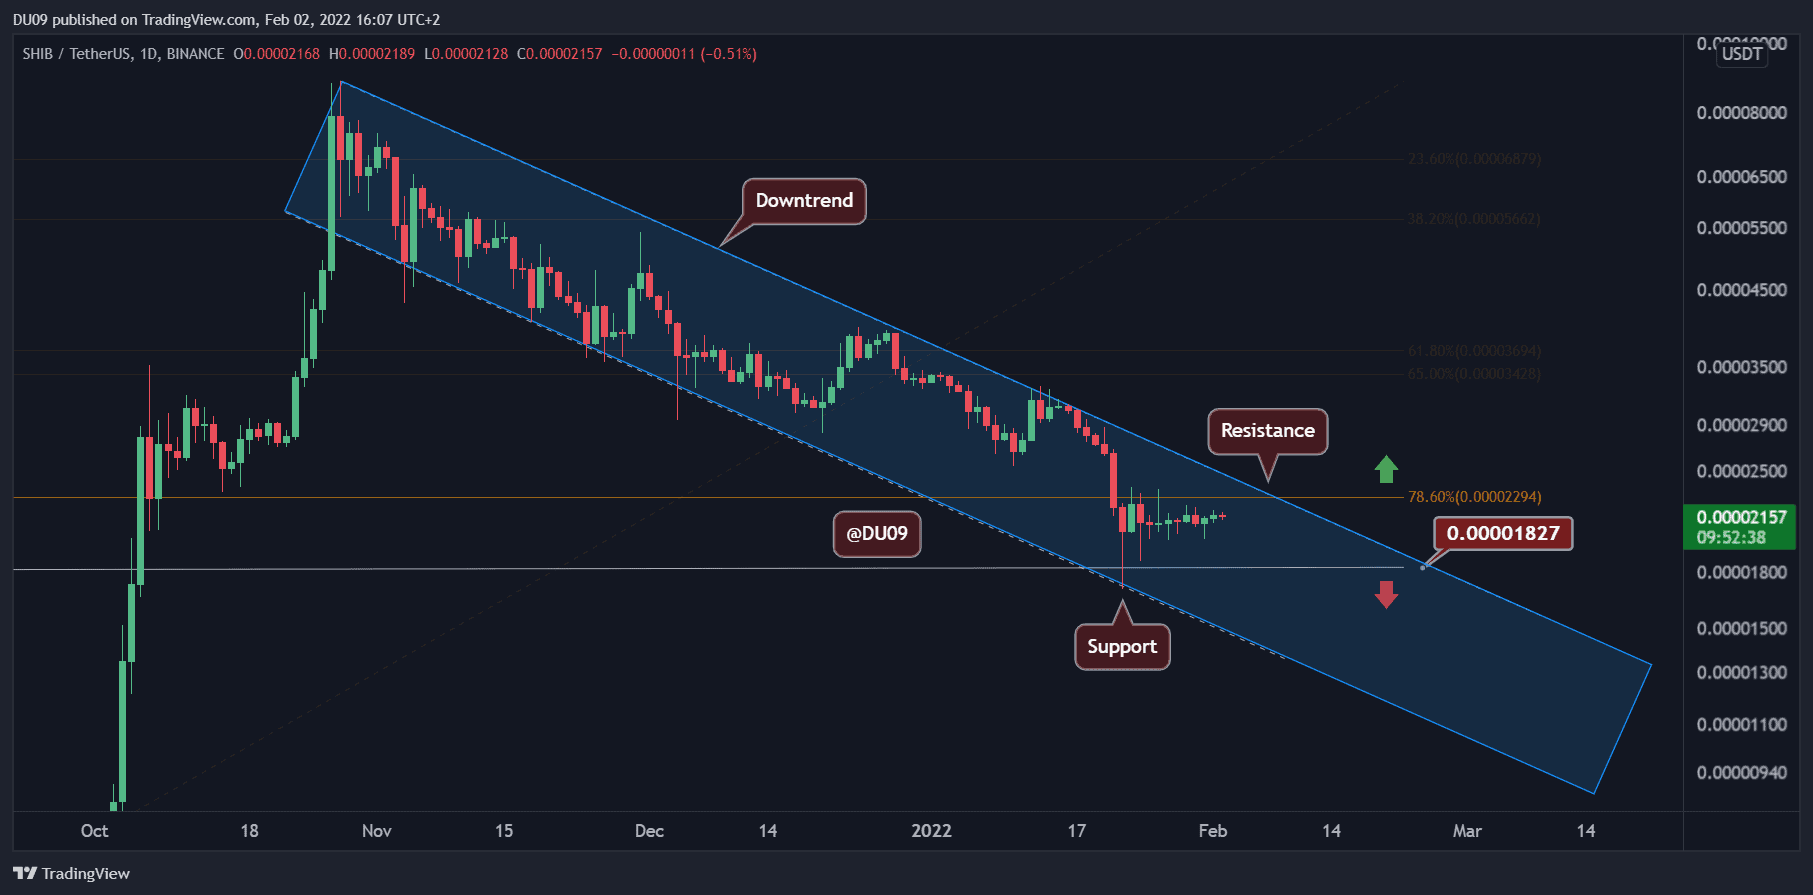
After some hard days, SHIB is starting to give clear bullish signals that may emerge in the renewal of a possible price rally.
Key Support level: $0.000018
Key Resistance level: $0.000023
While SHIB continues to consolidate under the key resistance at $0.000023, the MACD has turned bullish. The longer price maintains its current level the higher the chance for a breakout. The support at $0.000018 is unlikely to be retested if this momentum continues.
Technical Indicators
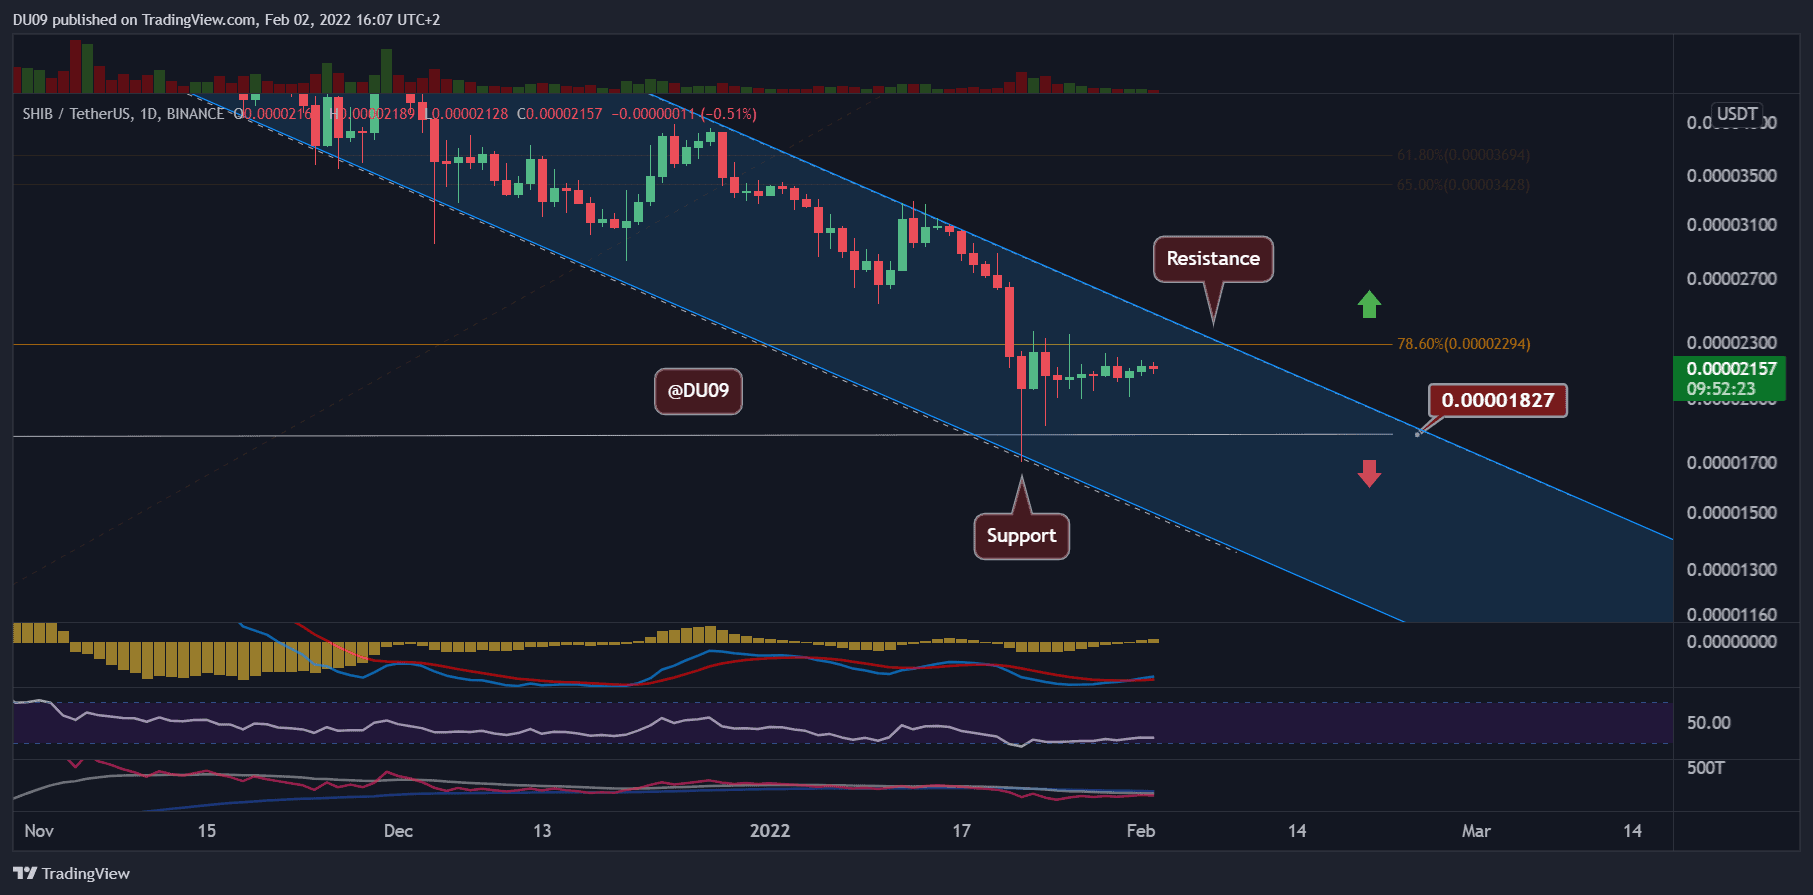
Trading Volume: Volume remains low. However, the buy-side seems to be leading the price action with four green days in the past week.
RSI: The daily RSI left the oversold area and is currently found at 35 points. In order to make a higher high and start an uptrend, the RSI needs to go over 50 points which seems a bit far right now.
MACD: The daily MACD did a bullish crossover three days ago which signals that this consolidation in price may see a breakout to the upside soon. If the key resistance is broken up, then this signal will be confirmed. Right now, the momentum favors the bulls based on the current MACD histogram and moving averages.
Bias
The bias on SHIB is neutral. A break above the key resistance is needed to flip the bias to bullish.
Short-Term Prediction for SHIB Price
SHIB has not seen such a ‘flat’ trend since last year when the price consolidated for months. If this continues, SHIB may break above the current downtrend over the next few days. It is also possible for SHIB to attempt a break of the key resistance at $0.000023 earlier, as indicated by MACD. If that happens, SHIB may quickly move higher.