Ripple has increased by 4% as the crypto market began to recover over the last two days. One explanation for this can be found in the DXY index reaching a stiff resistance. However, the sentiment across risk-on markets continues to be bearish. Technical Analysis By Grizzly The Weekly Chart The trend structure became bearish after the formation of a lower high and lower low on the daily chart. After failing to push the price above the horizontal resistance at %excerpt%.39 (in red), the bulls are now on the defense and should prevent the price from falling further. Although the price increased slightly yesterday, it is not yet significant enough to start a rally. The recovercould begin when the bulls can flip the resistance zone in the range of %excerpt%.38-%excerpt%.39 by passing through
Topics:
CryptoVizArt considers the following as important: Ripple (XRP) Price, XRP Analysis, xrpbtc, xrpusd
This could be interesting, too:
Dimitar Dzhondzhorov writes Is a Major Ripple v. SEC Lawsuit Development Expected This Week? Here’s Why
Mandy Williams writes Ripple Releases Institutional DeFi Roadmap for XRP Ledger in 2025
Dimitar Dzhondzhorov writes Ripple Whales Go on a Selling Spree: Is XRP Headed for a Further Correction?
Jordan Lyanchev writes ChatGPT and DeepSeek Analyze Ripple’s (XRP) Price Potential for 2025
Ripple has increased by 4% as the crypto market began to recover over the last two days. One explanation for this can be found in the DXY index reaching a stiff resistance. However, the sentiment across risk-on markets continues to be bearish.
Technical Analysis
By Grizzly
The Weekly Chart
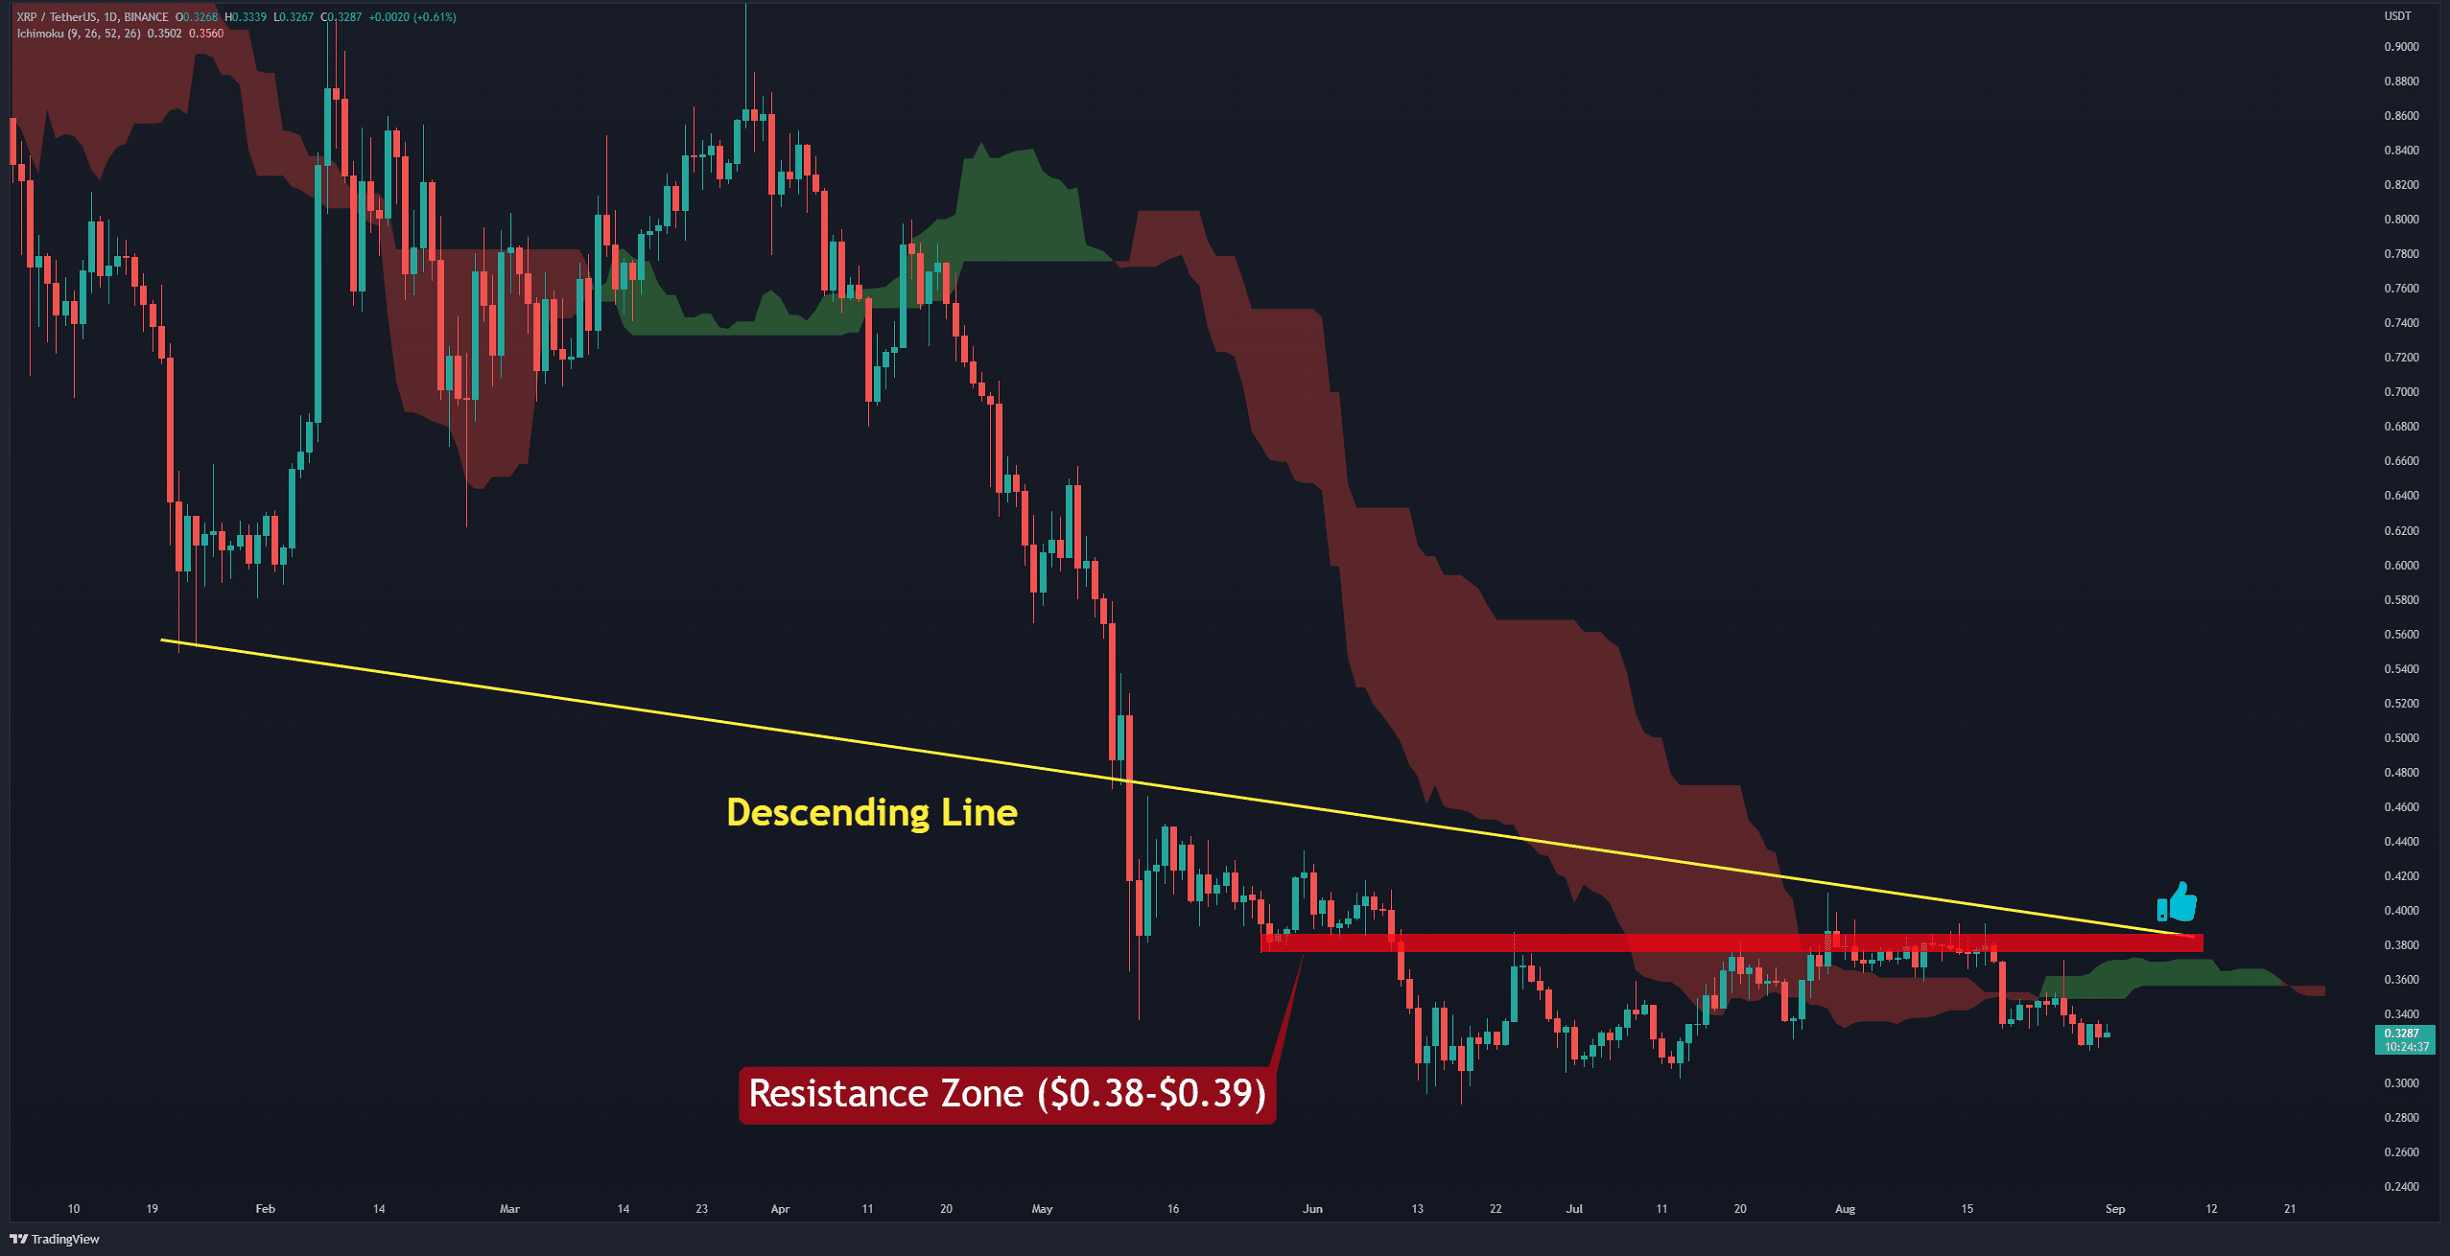
The trend structure became bearish after the formation of a lower high and lower low on the daily chart. After failing to push the price above the horizontal resistance at $0.39 (in red), the bulls are now on the defense and should prevent the price from falling further.
Although the price increased slightly yesterday, it is not yet significant enough to start a rally. The recovercould begin when the bulls can flip the resistance zone in the range of $0.38-$0.39 by passing through Ichimoku Cloud. This will likely coincide with clearing the resistance of the descending line (in yellow). However, this is a level that the asset has been stuck below for over 100 days.
Due to current macroeconomic conditions and fear of recession, high-risk assets will probably experience expanded volatility. Until the Federal Reserve reduces its hawkish policies, it seems unlikely for the crypto market to start recovering convincingly.
Key Support Levels: $0.33 & $0.28
Key Resistance Levels: $0.36 & $0.39
Daily Moving Averages:
MA20: $0.35
MA50: $0.35
MA100: $0.36
MA200: $0.53
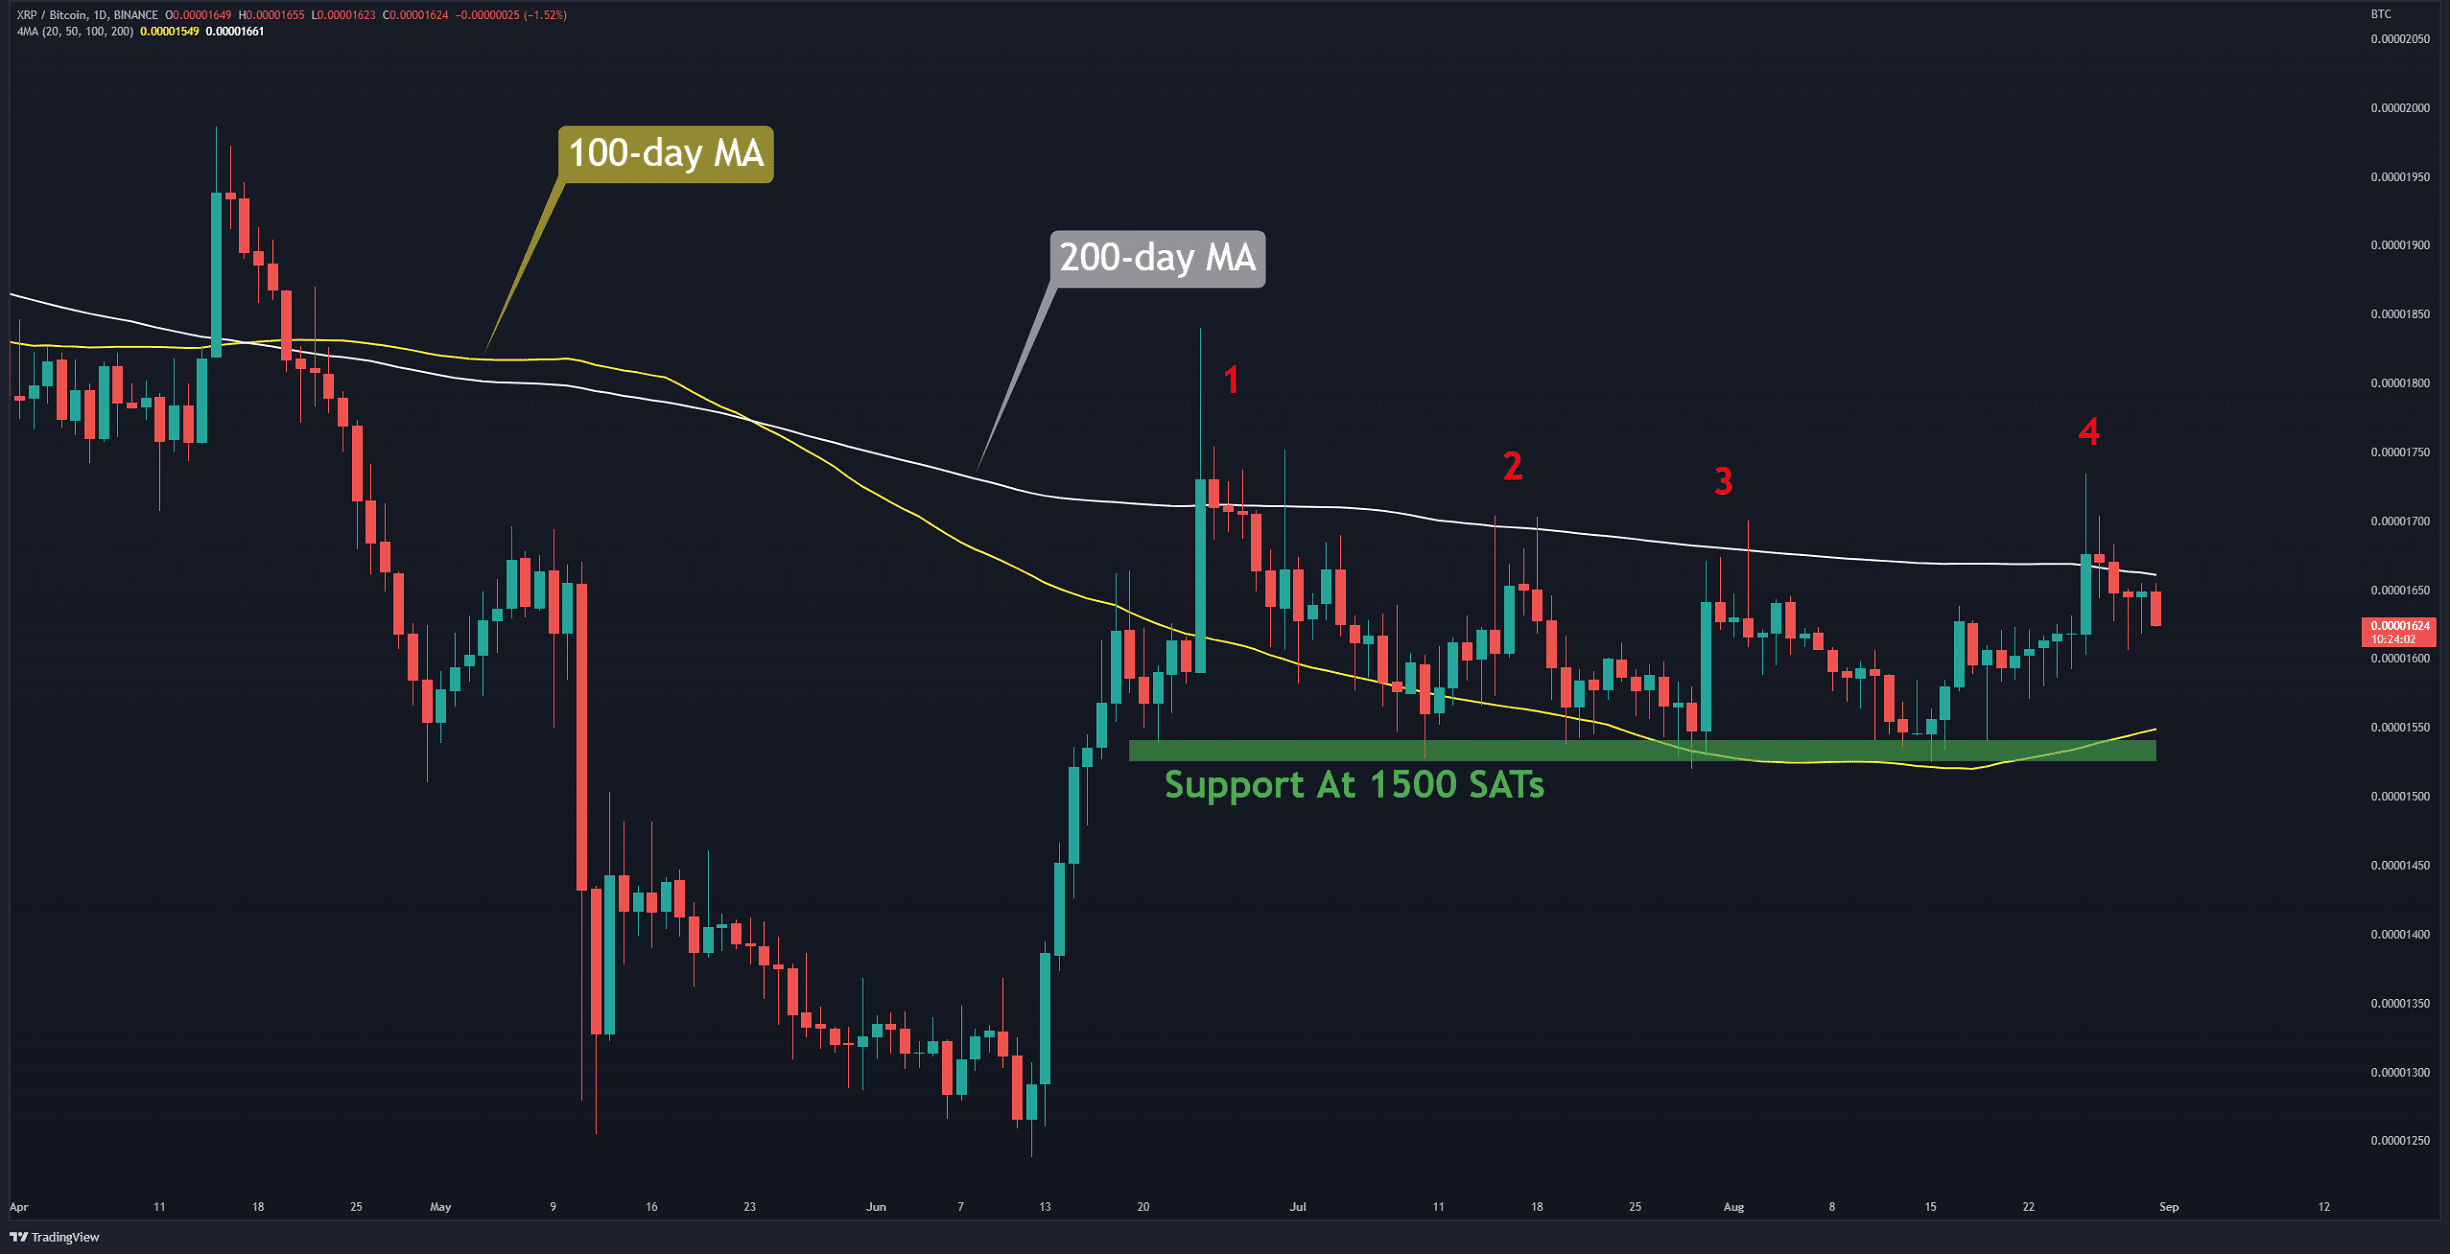
The XRP/BTC Chart
Against Bitcoin, the bulls could not keep the price above the 200-day moving average (in white) for the fourth time in the last two months. It is worth noting that in previous instances, the price extended up to the 100-day moving average (in yellow).
If the same pattern is repeated this time, the 100-day MA, which lies at 1500 SATs, has the potential to support XRP. If this level cracks, the next support will be found at 1370 SATs.
Key Support Levels: 1500 SATs & 1370 SATs
Key Resistance Levels: 1700 SATs & 2100 SATs