The crypto market experienced a sharp drop yesterday, liquidating many long positions. A lot of cryptocurrencies are approaching their long-term support levels, and it remains to be seen how bulls will defend them. Technical Analysis By Grizzly The Daily Chart On a daily time frame, XRP moves down inside a descending channel (in yellow). The intersection point of the channel’s midline with the horizontal support at %excerpt%.5 (in green) is a crucial level to monitor. If the bulls defend it, one can expect the channel top to be retested at around %excerpt%.8. Otherwise, the bears have the potential to push the price down to as low as %excerpt%.37. If buyers can hold the price above %excerpt%.5 and accumulate in this area, the bearish momentum would fade and open up the doors for a potential move to
Topics:
CryptoVizArt considers the following as important: Ripple (XRP) Price, XRP Analysis, xrpbtc, xrpusd
This could be interesting, too:
Dimitar Dzhondzhorov writes Is a Major Ripple v. SEC Lawsuit Development Expected This Week? Here’s Why
Mandy Williams writes Ripple Releases Institutional DeFi Roadmap for XRP Ledger in 2025
Dimitar Dzhondzhorov writes Ripple Whales Go on a Selling Spree: Is XRP Headed for a Further Correction?
Jordan Lyanchev writes ChatGPT and DeepSeek Analyze Ripple’s (XRP) Price Potential for 2025
The crypto market experienced a sharp drop yesterday, liquidating many long positions. A lot of cryptocurrencies are approaching their long-term support levels, and it remains to be seen how bulls will defend them.
Technical Analysis
By Grizzly
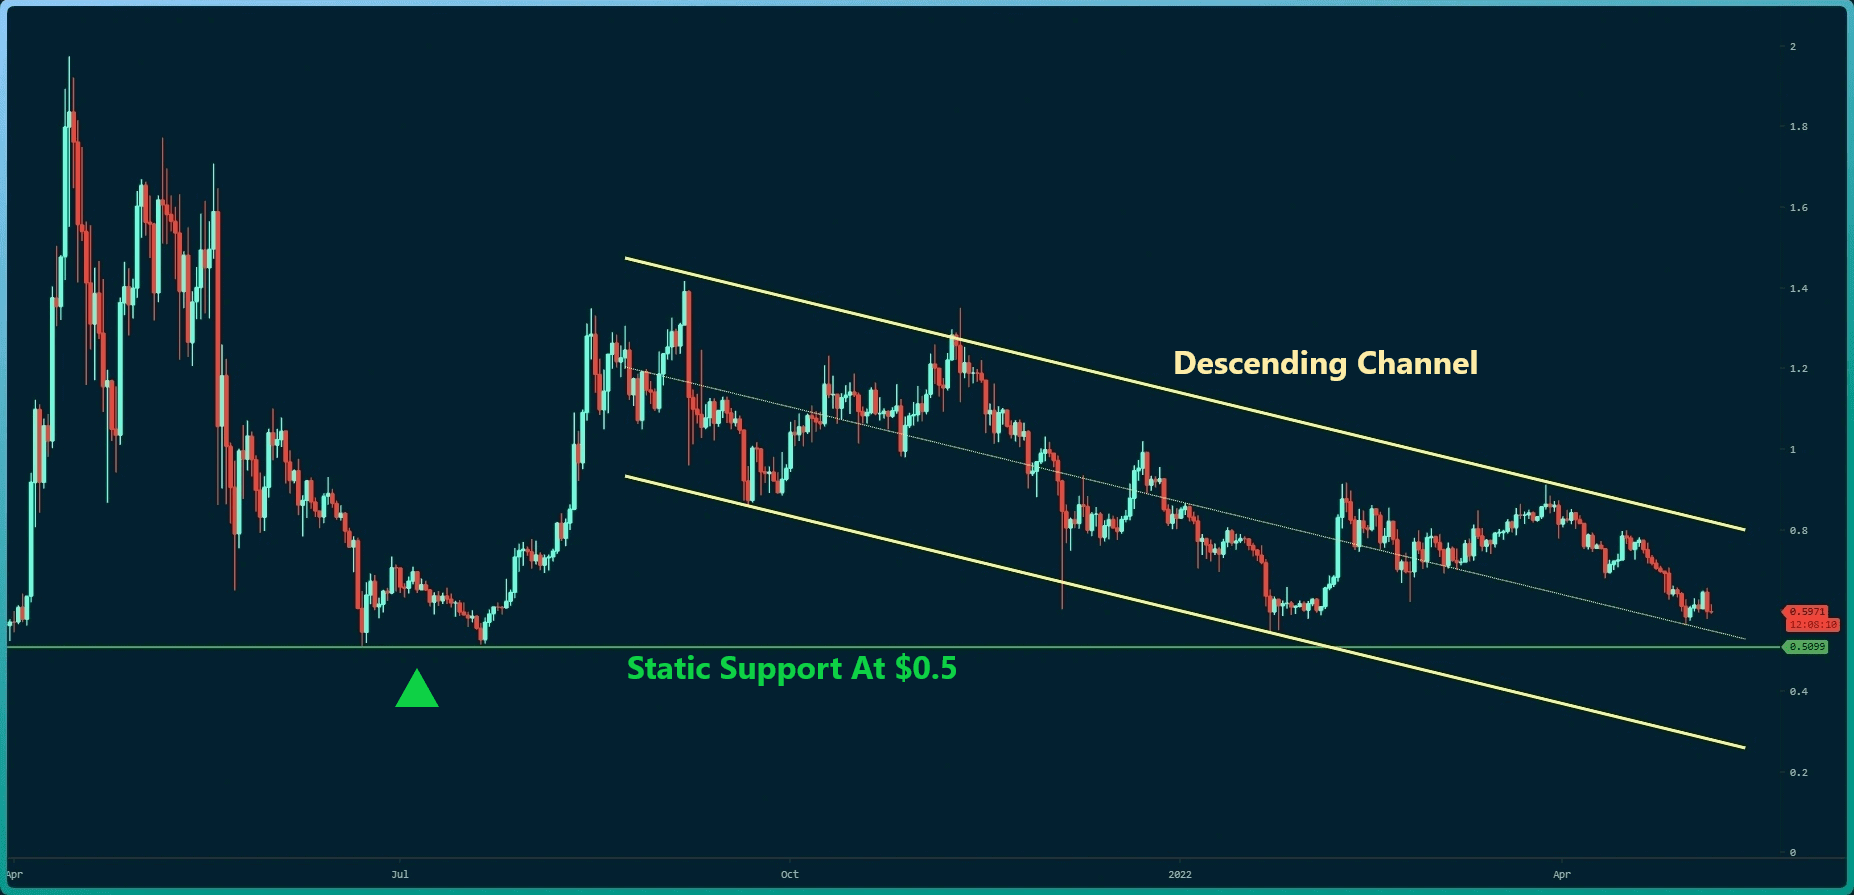
The Daily Chart
On a daily time frame, XRP moves down inside a descending channel (in yellow). The intersection point of the channel’s midline with the horizontal support at $0.5 (in green) is a crucial level to monitor. If the bulls defend it, one can expect the channel top to be retested at around $0.8.
Otherwise, the bears have the potential to push the price down to as low as $0.37. If buyers can hold the price above $0.5 and accumulate in this area, the bearish momentum would fade and open up the doors for a potential move to the upside.
The bottom line is that based on the current sentiment, where the market seems to be in the doubt/fear phase, and buyers are not very inclined to make big purchases.
Moving Averages:
MA20: $0.67
MA50: $0.75
MA100: $0.74
MA200: $0.84
The 4-Hour Chart
On the 4-hour timeframe, although the pressure from sellers has eased, the intersection of the horizontal resistance at $0.63 (in blue) with the dynamic resistance (in red) can be a severe barrier for the price to recover.
Therefore, it’s important to see how the price will behave around it before drawing any further conclusions.
