A very disheartening week in the crypto market has come to a close. Ripple saw its second-worst weekly candle since May and dropped more than a third of its market value over the last week. Technical Analysis By Grizzly The Daily Chart On the daily chart, the negative momentum slowed marginally as the asset approached the support zone in the %excerpt%.3 to %excerpt%.33 region (in green). However, this cannot be considered the end of the downward spiral. After 50 days, XRP hit the descending line (in yellow), which now serves as support. If the pair closes below this level, the price is anticipated to fall to around %excerpt%.24- something it has not seen since January 2021. Until the price can reclaim resistance at %excerpt%.42 (in red), it is premature to talk about the end of the downtrend. A break
Topics:
CryptoVizArt considers the following as important: Ripple (XRP) Price, XRP Analysis, xrpbtc, xrpusd
This could be interesting, too:
Dimitar Dzhondzhorov writes Is a Major Ripple v. SEC Lawsuit Development Expected This Week? Here’s Why
Mandy Williams writes Ripple Releases Institutional DeFi Roadmap for XRP Ledger in 2025
Dimitar Dzhondzhorov writes Ripple Whales Go on a Selling Spree: Is XRP Headed for a Further Correction?
Jordan Lyanchev writes ChatGPT and DeepSeek Analyze Ripple’s (XRP) Price Potential for 2025
A very disheartening week in the crypto market has come to a close. Ripple saw its second-worst weekly candle since May and dropped more than a third of its market value over the last week.
Technical Analysis
By Grizzly
The Daily Chart
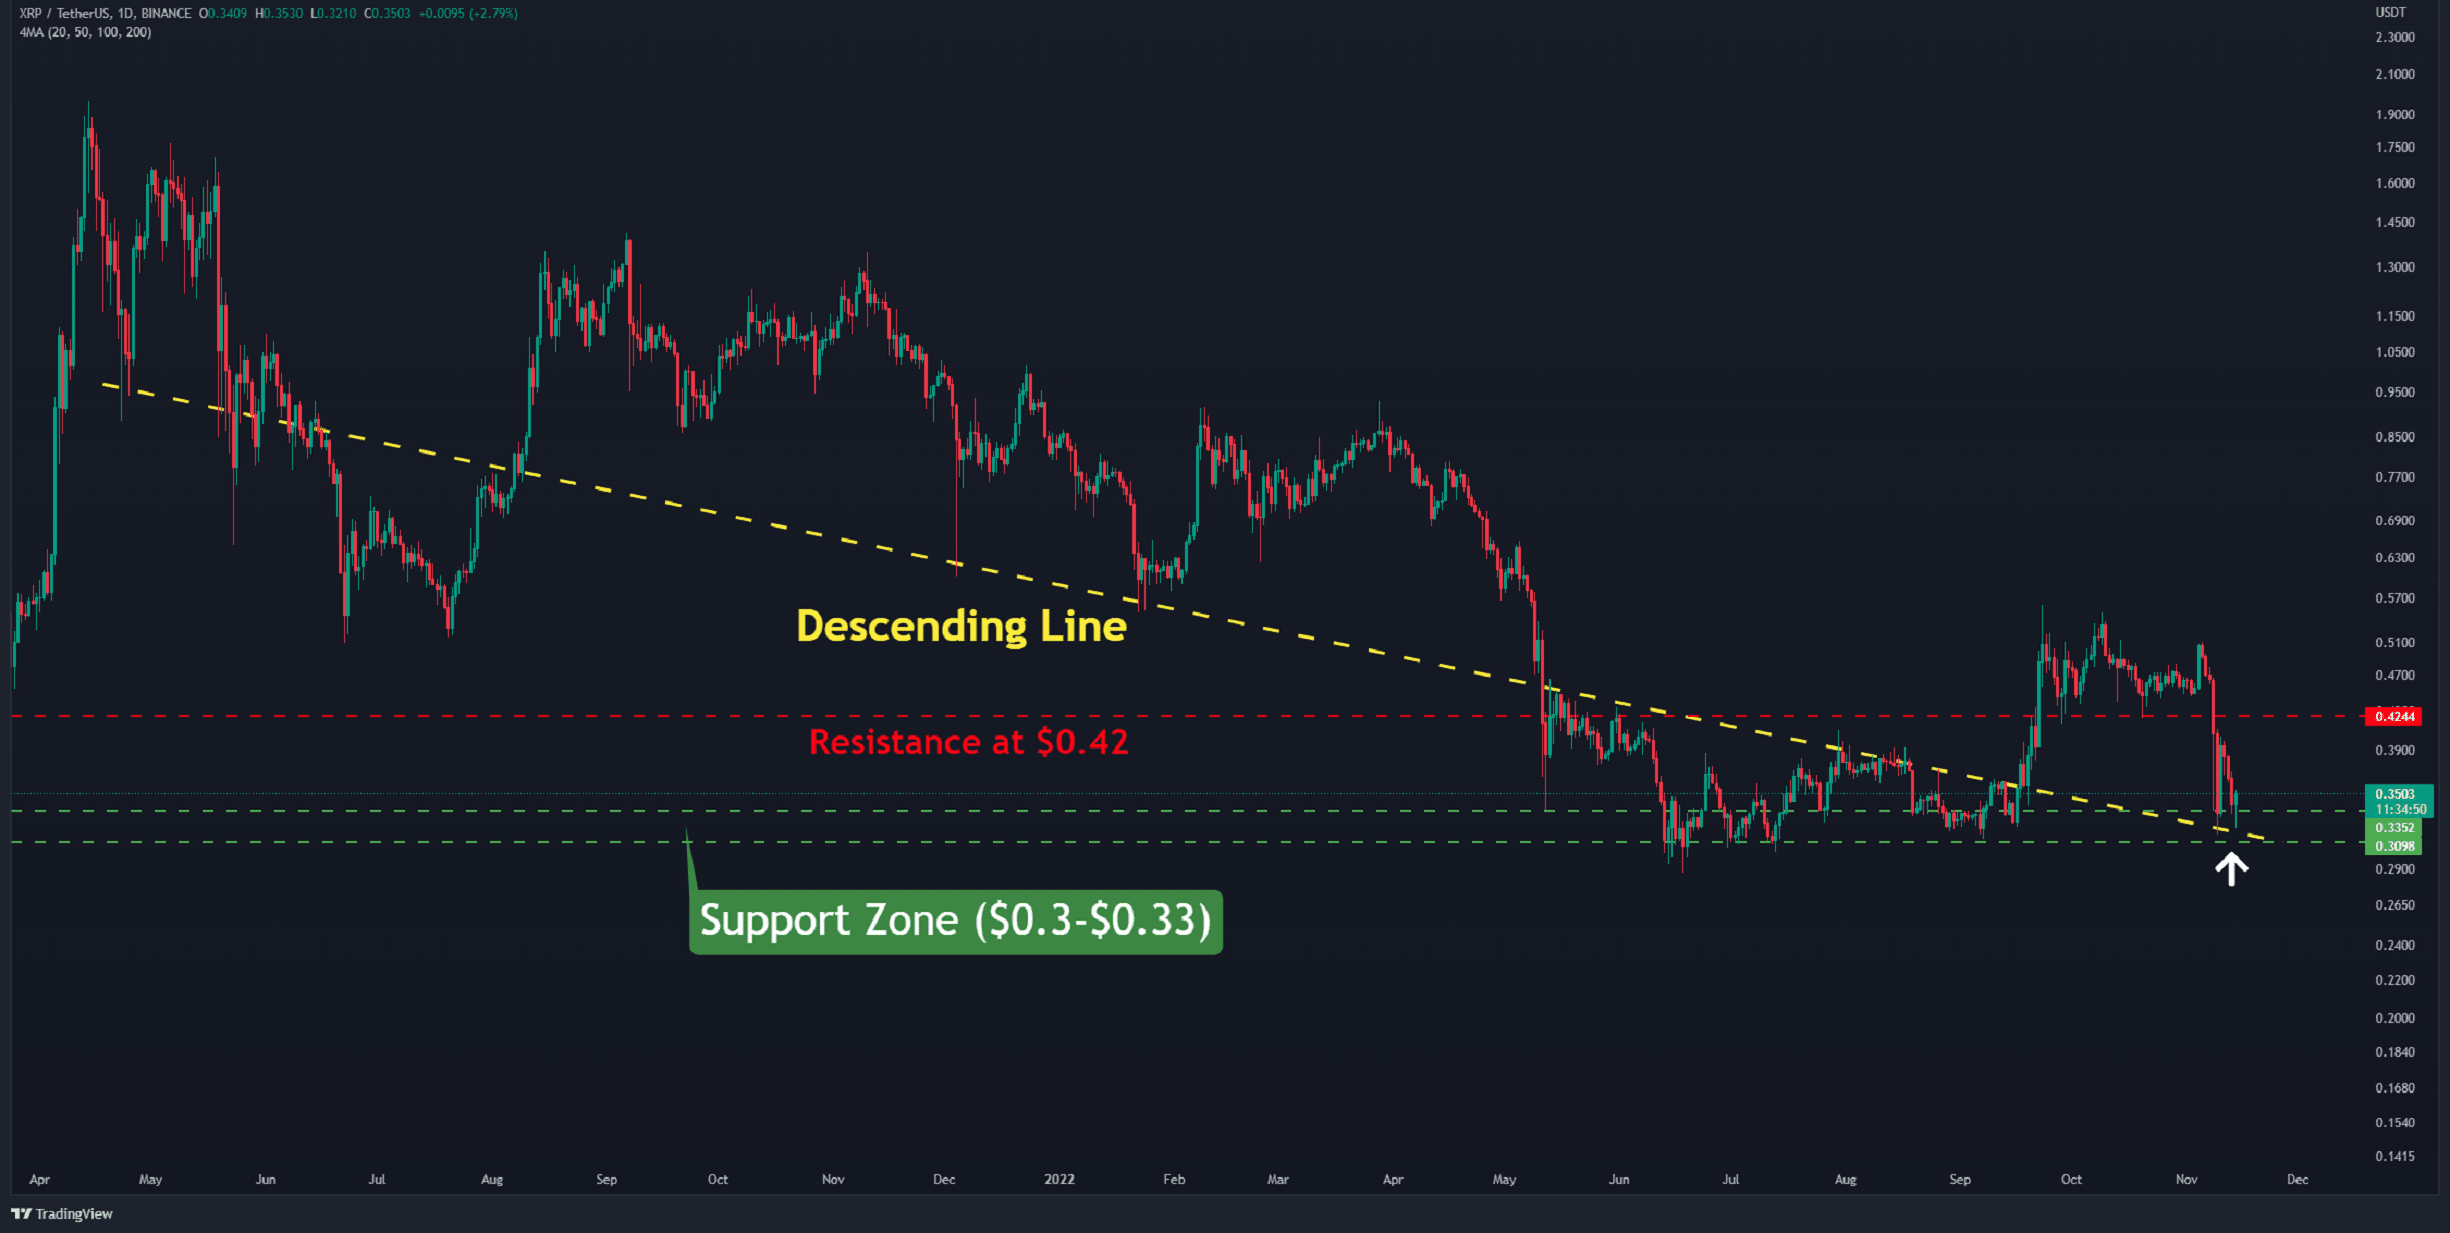
On the daily chart, the negative momentum slowed marginally as the asset approached the support zone in the $0.3 to $0.33 region (in green). However, this cannot be considered the end of the downward spiral.
After 50 days, XRP hit the descending line (in yellow), which now serves as support. If the pair closes below this level, the price is anticipated to fall to around $0.24- something it has not seen since January 2021. Until the price can reclaim resistance at $0.42 (in red), it is premature to talk about the end of the downtrend.
A break and close below $0.30 would likely be accompanied by heightened selling pressure. In this circumstance, a prolonged bear market becomes very likely.
Moving Averages:
MA20: $0.43
MA50: $0.46
MA100: $0.41
MA200: $0.40
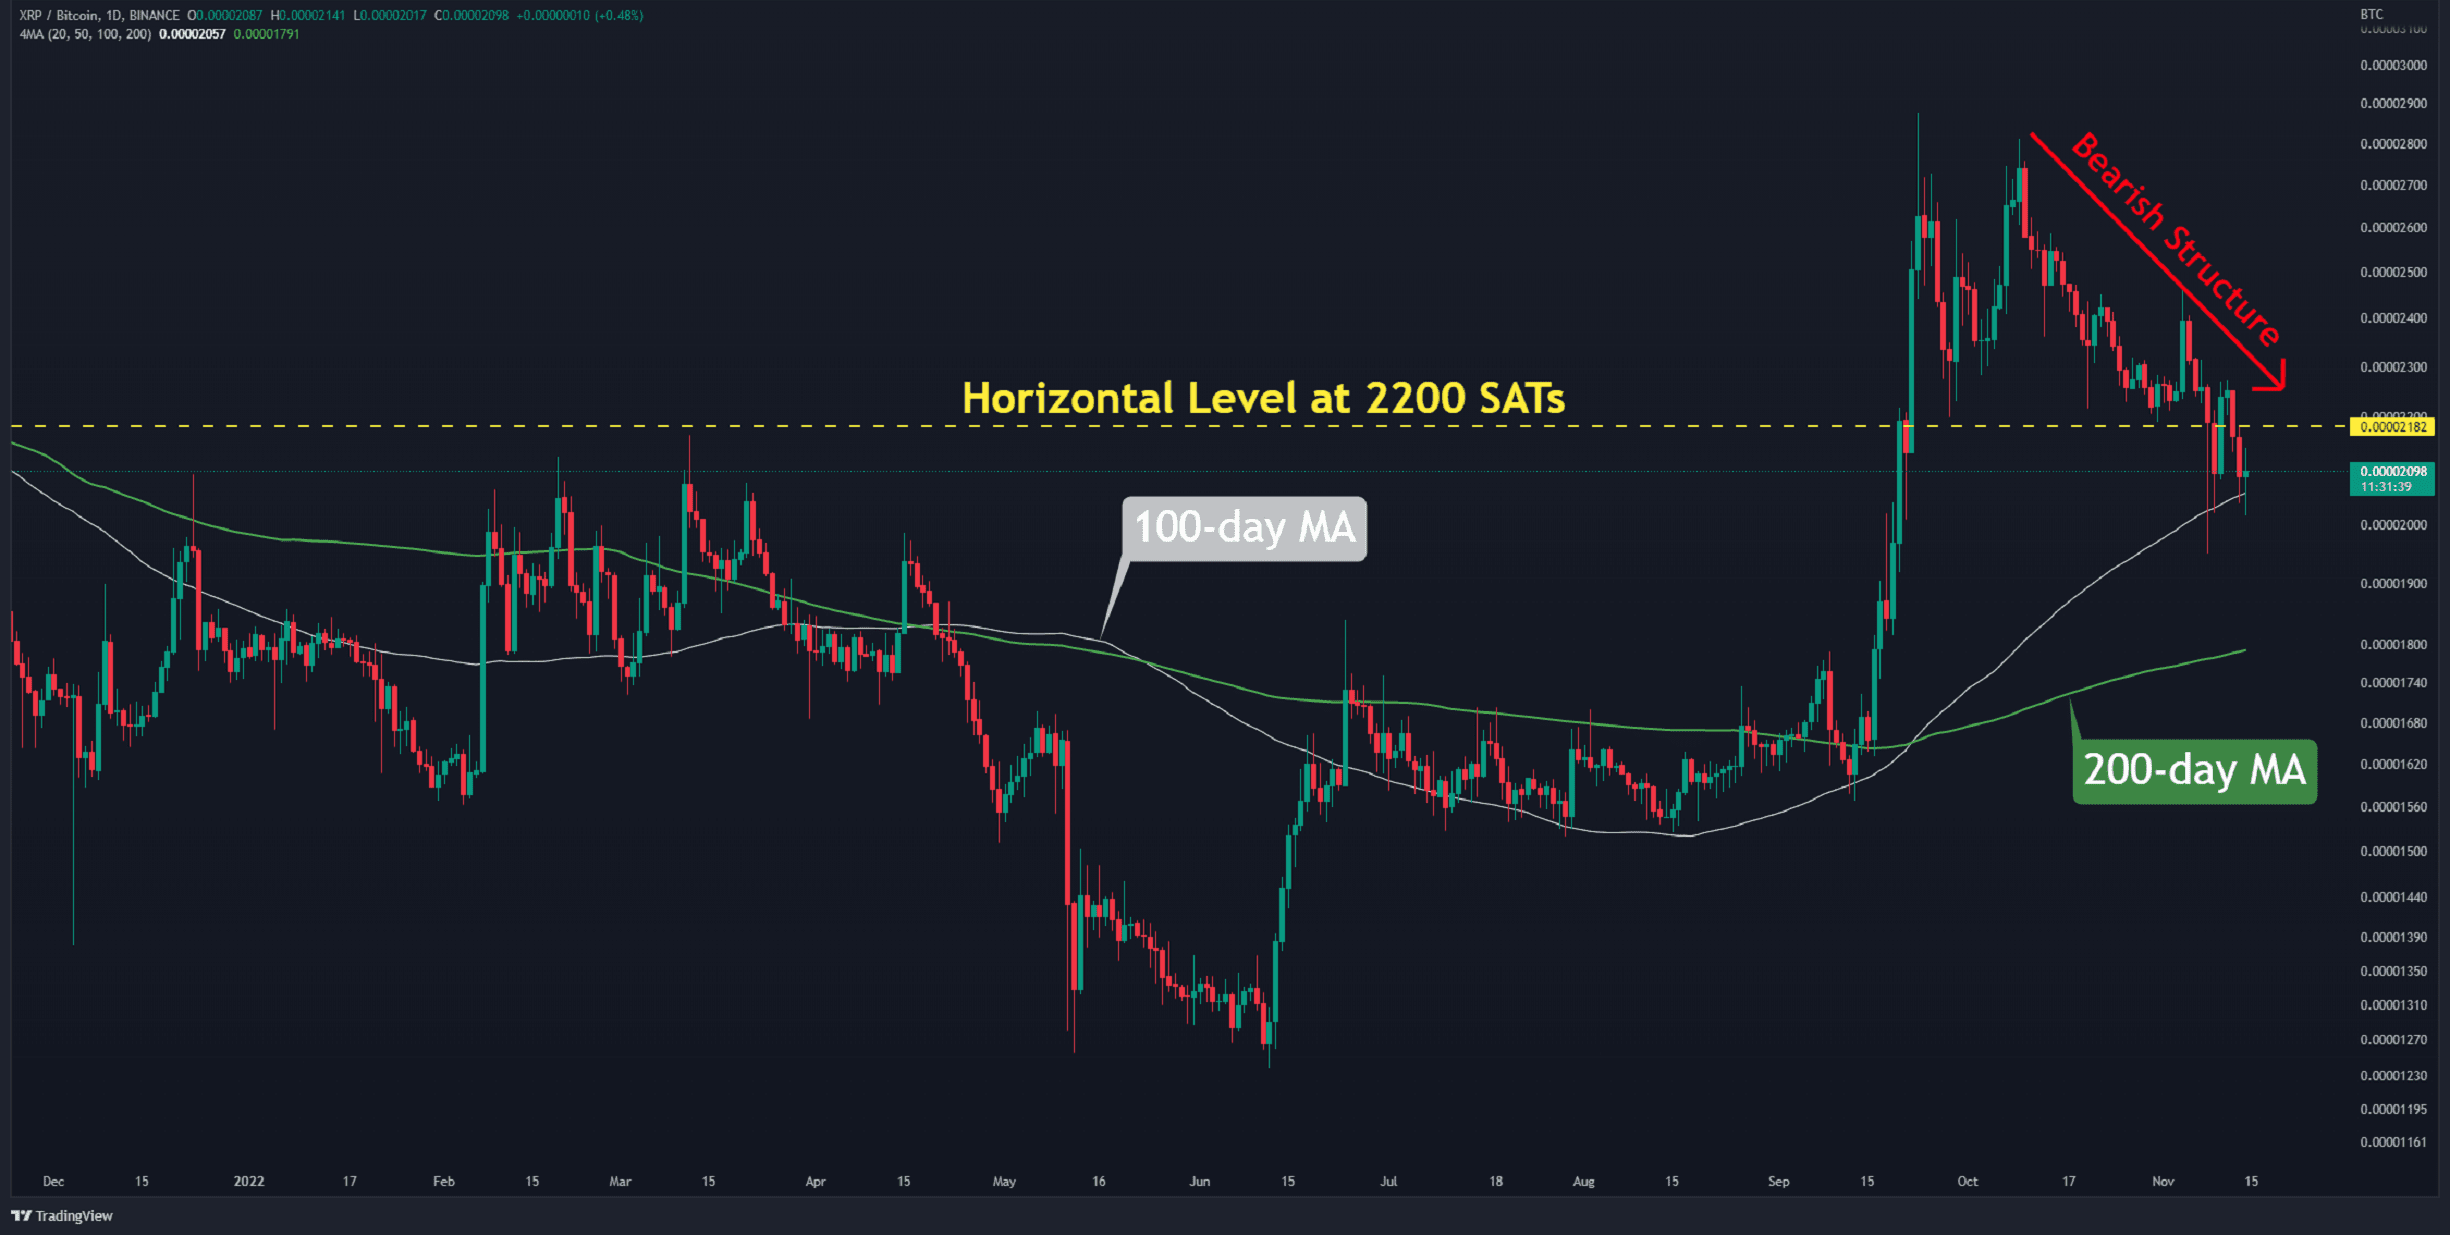
The XRP/BTC Chart
Against Bitcoin, the chart clearly shows a bearish pattern. The pair breached the horizontal level at 2200 SATs (in yellow), resulting in lower highs and lower lows.
The 100-day moving average (in white) is currently functioning as support, preventing additional dips. However, there is no evidence of the downward trend slowing.
If the price continues to fall, the next level of support will be around 1800 SATs, which coincides with the 200-day moving average (in green).
Key Support Levels: 2000 SATS, 1800 SATs
Key Resistance Levels: 2200 SATs, 2500 SATs