Ripple, as the fourth-largest cryptocurrency by market capitalization, saw increases of over 30% during the last 7 days, according to CoinGecko. The price extended to nearly %excerpt%.56 on Friday but got quickly rejected. Technical Analysis By Grizzly The Daily Chart The XRP/USDT trading pair reached a key support turned resistance level, for the first time since May 9, on the daily chart. Additionally, the price finally closed a daily candle above the 200-day moving average line (in white), which is a promising sign for the short-term future. Given the strength of the resistance zone located between %excerpt%.50 and %excerpt%.55, it is likely that some traders may take profits in this area, and XRP will consolidate. However, as long as the price remains above the horizontal support at %excerpt%.42
Topics:
CryptoVizArt considers the following as important: Ripple (XRP) Price, XRP Analysis, xrpbtc, xrpusd
This could be interesting, too:
Dimitar Dzhondzhorov writes Is a Major Ripple v. SEC Lawsuit Development Expected This Week? Here’s Why
Mandy Williams writes Ripple Releases Institutional DeFi Roadmap for XRP Ledger in 2025
Dimitar Dzhondzhorov writes Ripple Whales Go on a Selling Spree: Is XRP Headed for a Further Correction?
Jordan Lyanchev writes ChatGPT and DeepSeek Analyze Ripple’s (XRP) Price Potential for 2025
Ripple, as the fourth-largest cryptocurrency by market capitalization, saw increases of over 30% during the last 7 days, according to CoinGecko. The price extended to nearly $0.56 on Friday but got quickly rejected.
Technical Analysis
By Grizzly
The Daily Chart
The XRP/USDT trading pair reached a key support turned resistance level, for the first time since May 9, on the daily chart. Additionally, the price finally closed a daily candle above the 200-day moving average line (in white), which is a promising sign for the short-term future.
Given the strength of the resistance zone located between $0.50 and $0.55, it is likely that some traders may take profits in this area, and XRP will consolidate. However, as long as the price remains above the horizontal support at $0.42 (in green), this should not disrupt the current positive momentum.
If XRP can overcome the resistance mentioned above, which overlaps with the descending line (in yellow), reaching $0.60 should be an easy task for the cryptocurrency.
Key Support Levels: $0.45 & $0.4
Key Resistance Levels: $0.5 & $0.55
Daily Moving Averages:
MA20: $0.37
MA50: $0.36
MA100: $0.35
MA200: $0.48

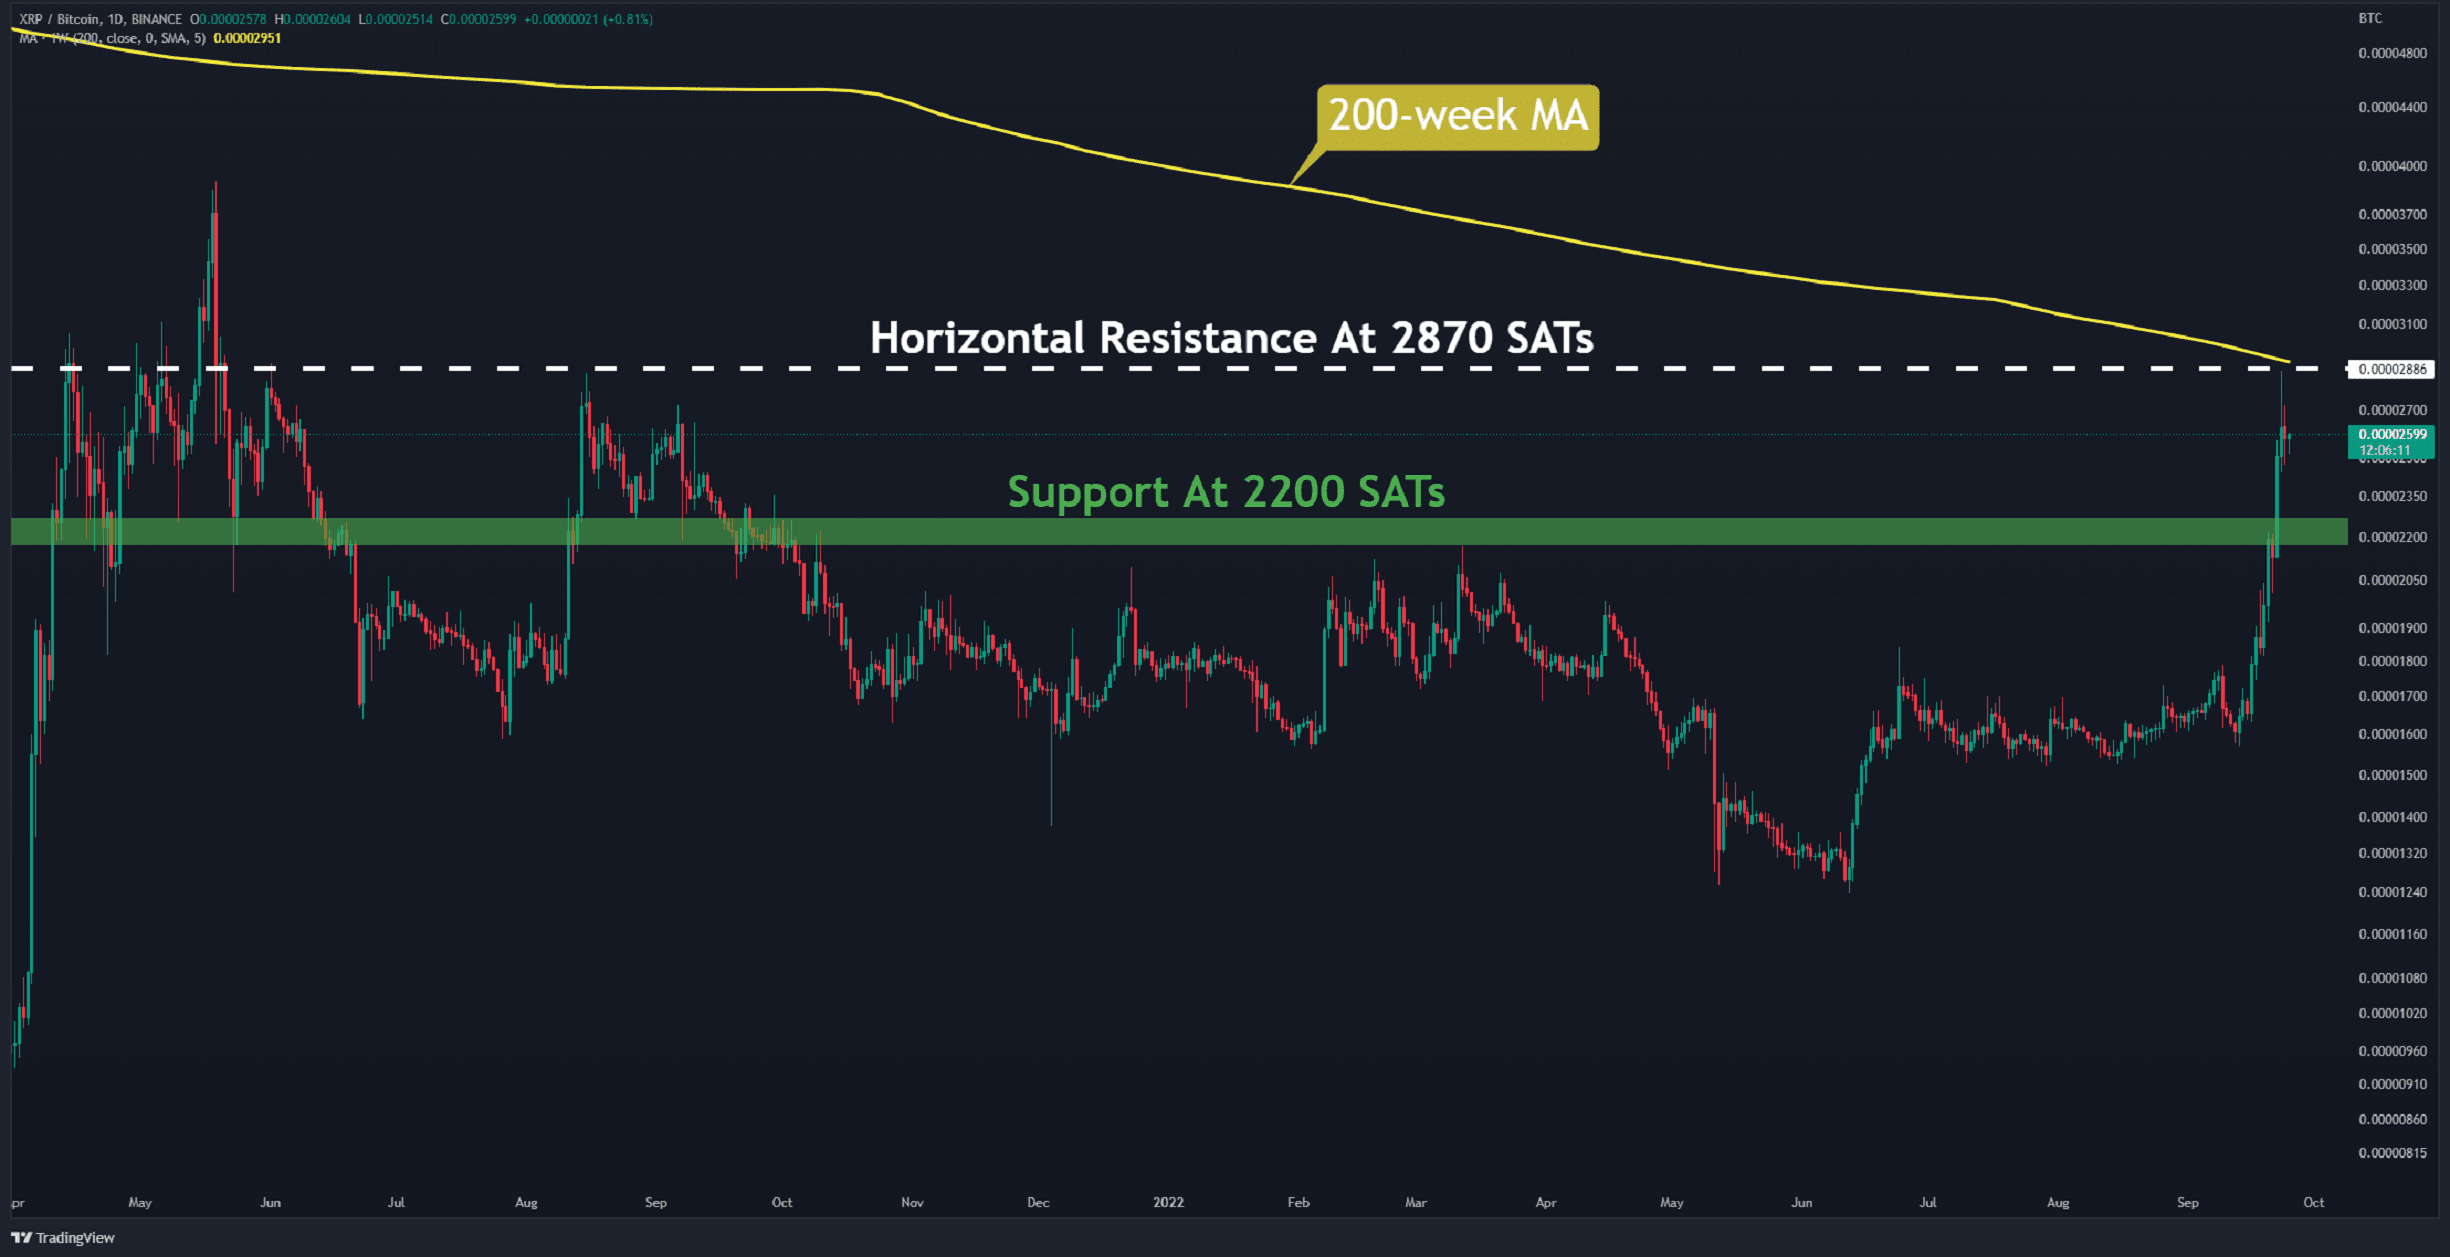
The XRP/BTC Chart
When examining the BTC pair chart, Ripple shows strength, trading above key resistance. It has finally encountered horizontal resistance at 2870 SATS (in white) for the first time in over 400 days. The 200-week moving average line and this level intersect. Clearing this obstacle should pave the way to reclaiming the 2021 high of 3,900 SATs.
Considering its more than 80% increase in the last 10 days, XRP is expected to test the lower levels as support. As long as the pair continues to trade above 2,200 SATs (in green), the outlook for XRP appears positive.
Key Support Levels: 2350 SATs & 2200 SATs
Key Resistance Levels: 2870 SATs & 3900 SATs