Ripple has experienced a long-term downward trend for over 500 days. April 14, 2021, marked the last day the bulls dominated the XRP market and recorded a local high of almost . Since then, the price of XRP has been down by 80%. Recent attempts by the bulls to start a rally have also failed. Technical Analysis By: Grizzly The Daily Chart On the daily chart, the XRP price is down 13% from the monthly high of %excerpt%.386. This drop caused the pair to slip below the 20-day, 50-day, and 100-day moving average lines. These lines lie around %excerpt%.36, which had become a critical resistance zone (in red). In addition, the horizontal resistance at %excerpt%.4 also marks a key supply zone in case of a breakout. From the bullish side, a breakout above %excerpt%.4 is the first step North. In such a case,
Topics:
CryptoVizArt considers the following as important: Ripple (XRP) Price, XRP Analysis, xrpbtc, xrpusd
This could be interesting, too:
Dimitar Dzhondzhorov writes Is a Major Ripple v. SEC Lawsuit Development Expected This Week? Here’s Why
Mandy Williams writes Ripple Releases Institutional DeFi Roadmap for XRP Ledger in 2025
Dimitar Dzhondzhorov writes Ripple Whales Go on a Selling Spree: Is XRP Headed for a Further Correction?
Jordan Lyanchev writes ChatGPT and DeepSeek Analyze Ripple’s (XRP) Price Potential for 2025
Ripple has experienced a long-term downward trend for over 500 days. April 14, 2021, marked the last day the bulls dominated the XRP market and recorded a local high of almost $2. Since then, the price of XRP has been down by 80%. Recent attempts by the bulls to start a rally have also failed.
Technical Analysis
By: Grizzly
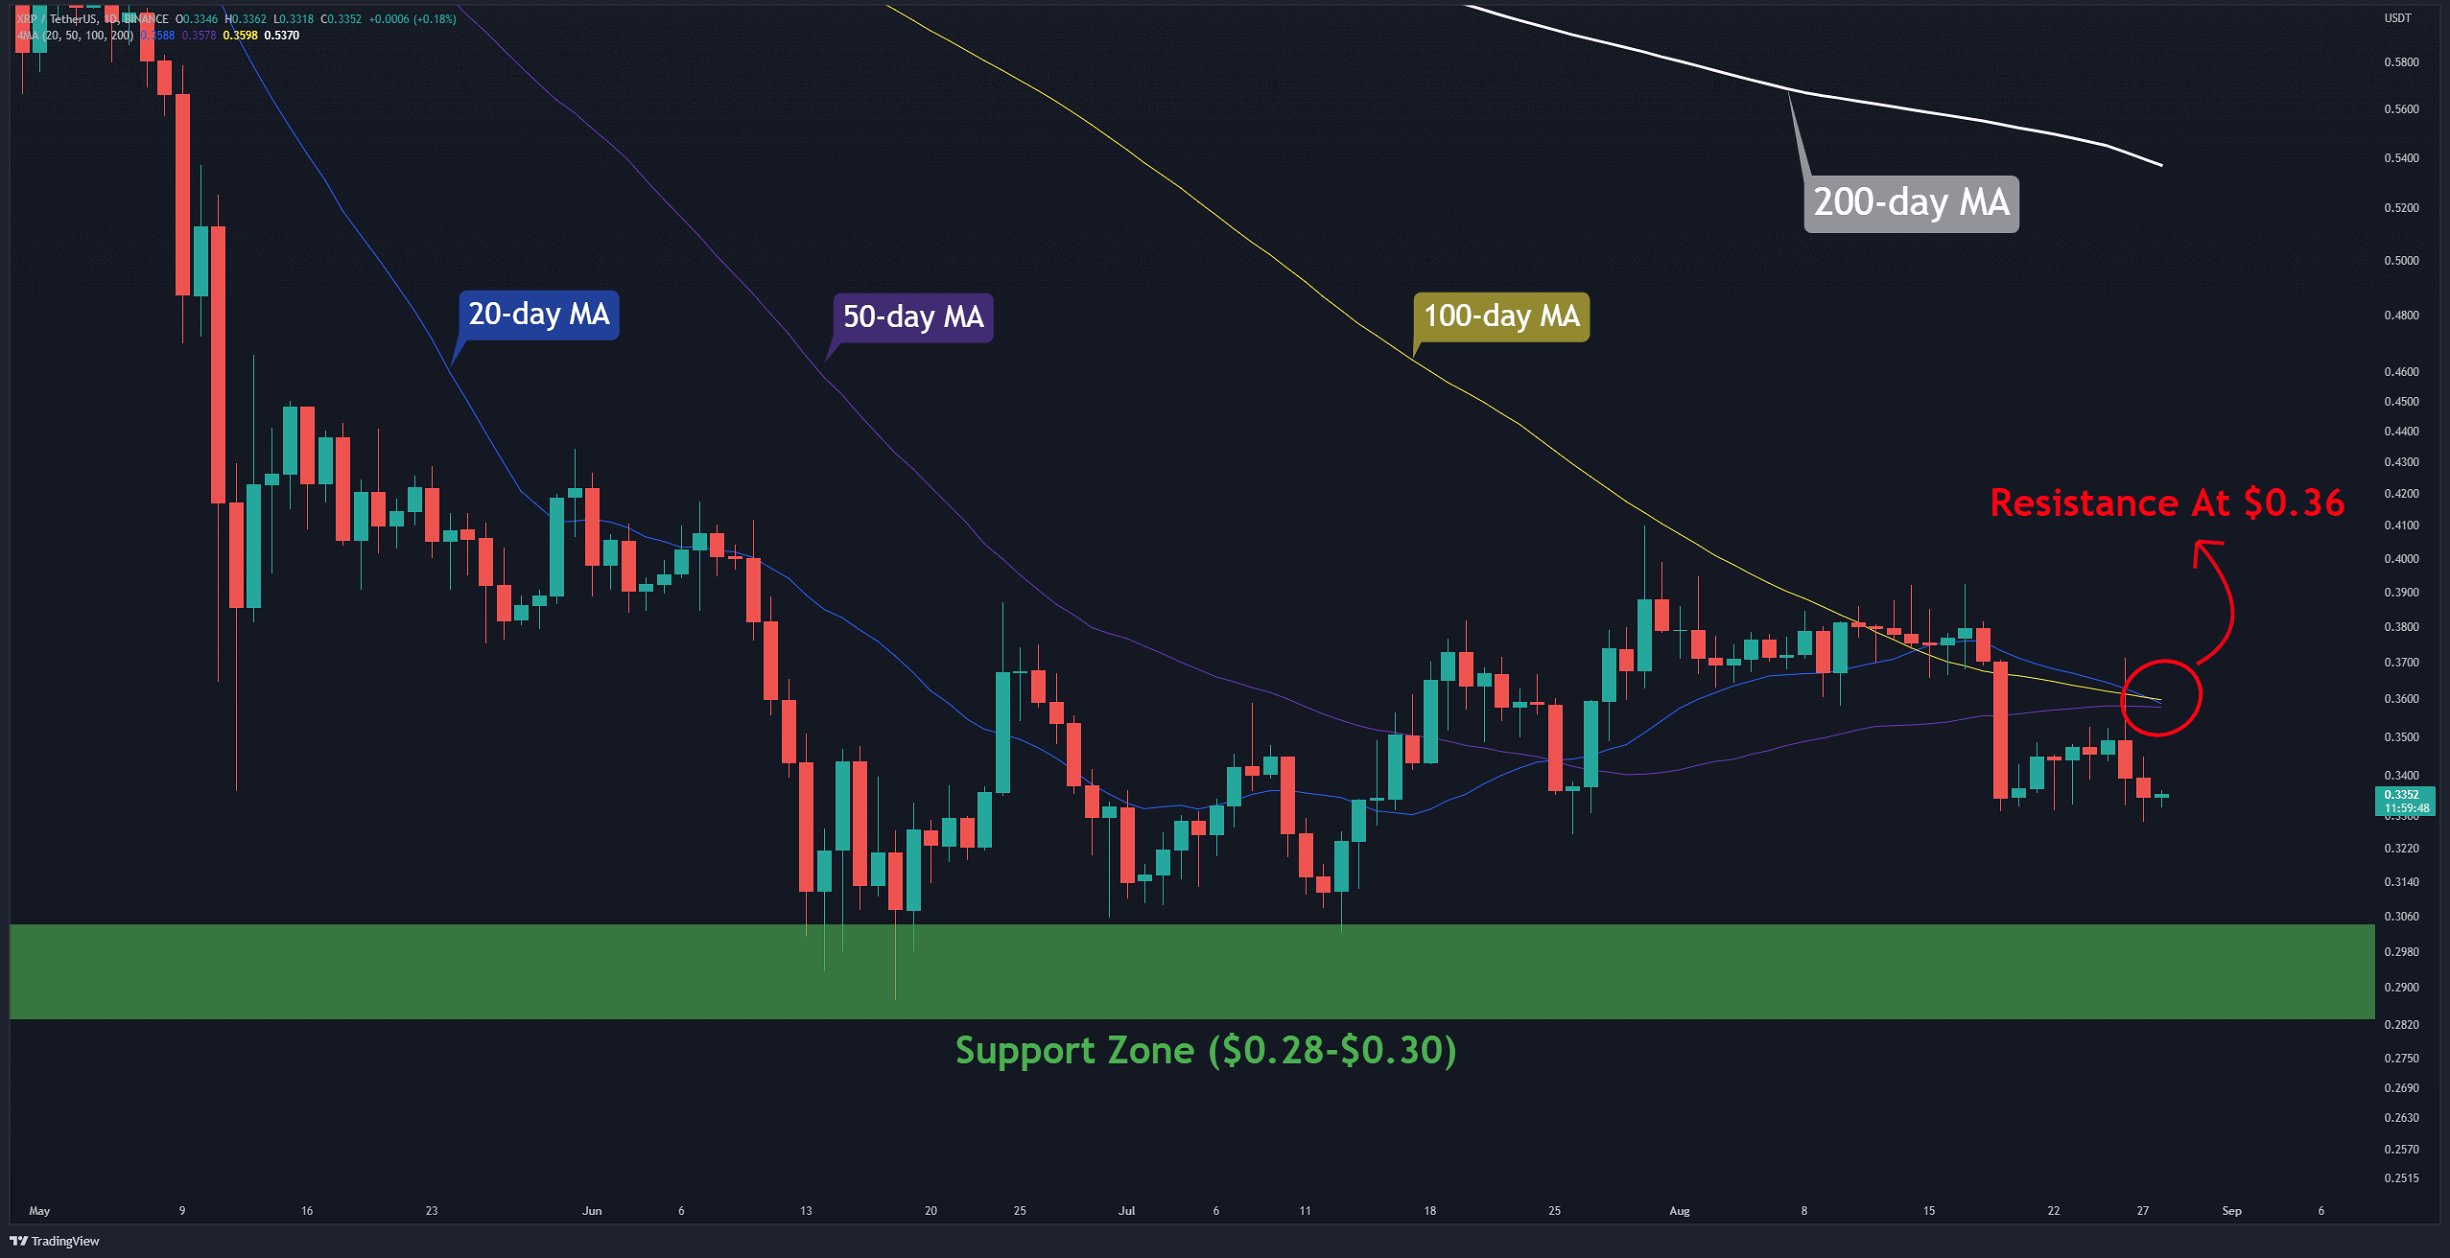
The Daily Chart
On the daily chart, the XRP price is down 13% from the monthly high of $0.386. This drop caused the pair to slip below the 20-day, 50-day, and 100-day moving average lines.
These lines lie around $0.36, which had become a critical resistance zone (in red). In addition, the horizontal resistance at $0.4 also marks a key supply zone in case of a breakout.
From the bullish side, a breakout above $0.4 is the first step North. In such a case, the probability of reaching the 200-day moving average (in white), now at $0.53, will become likely. Considering the current bearish sentiment, this scenario is unlikely.
On the other hand, according to the bearish structure formed on lower timeframes, the bears can potentially push the price lower to retest $0.3.
In conclusion, two levels to pay attention to $0.4 and $0.3.
Key Support Levels: $0.30 & $0.17
Key Resistance Levels: $0.40 & $0.50
Daily Moving Averages:
MA20: $0.36
MA50: $0.36
MA100: $0.36
MA200: $0.53
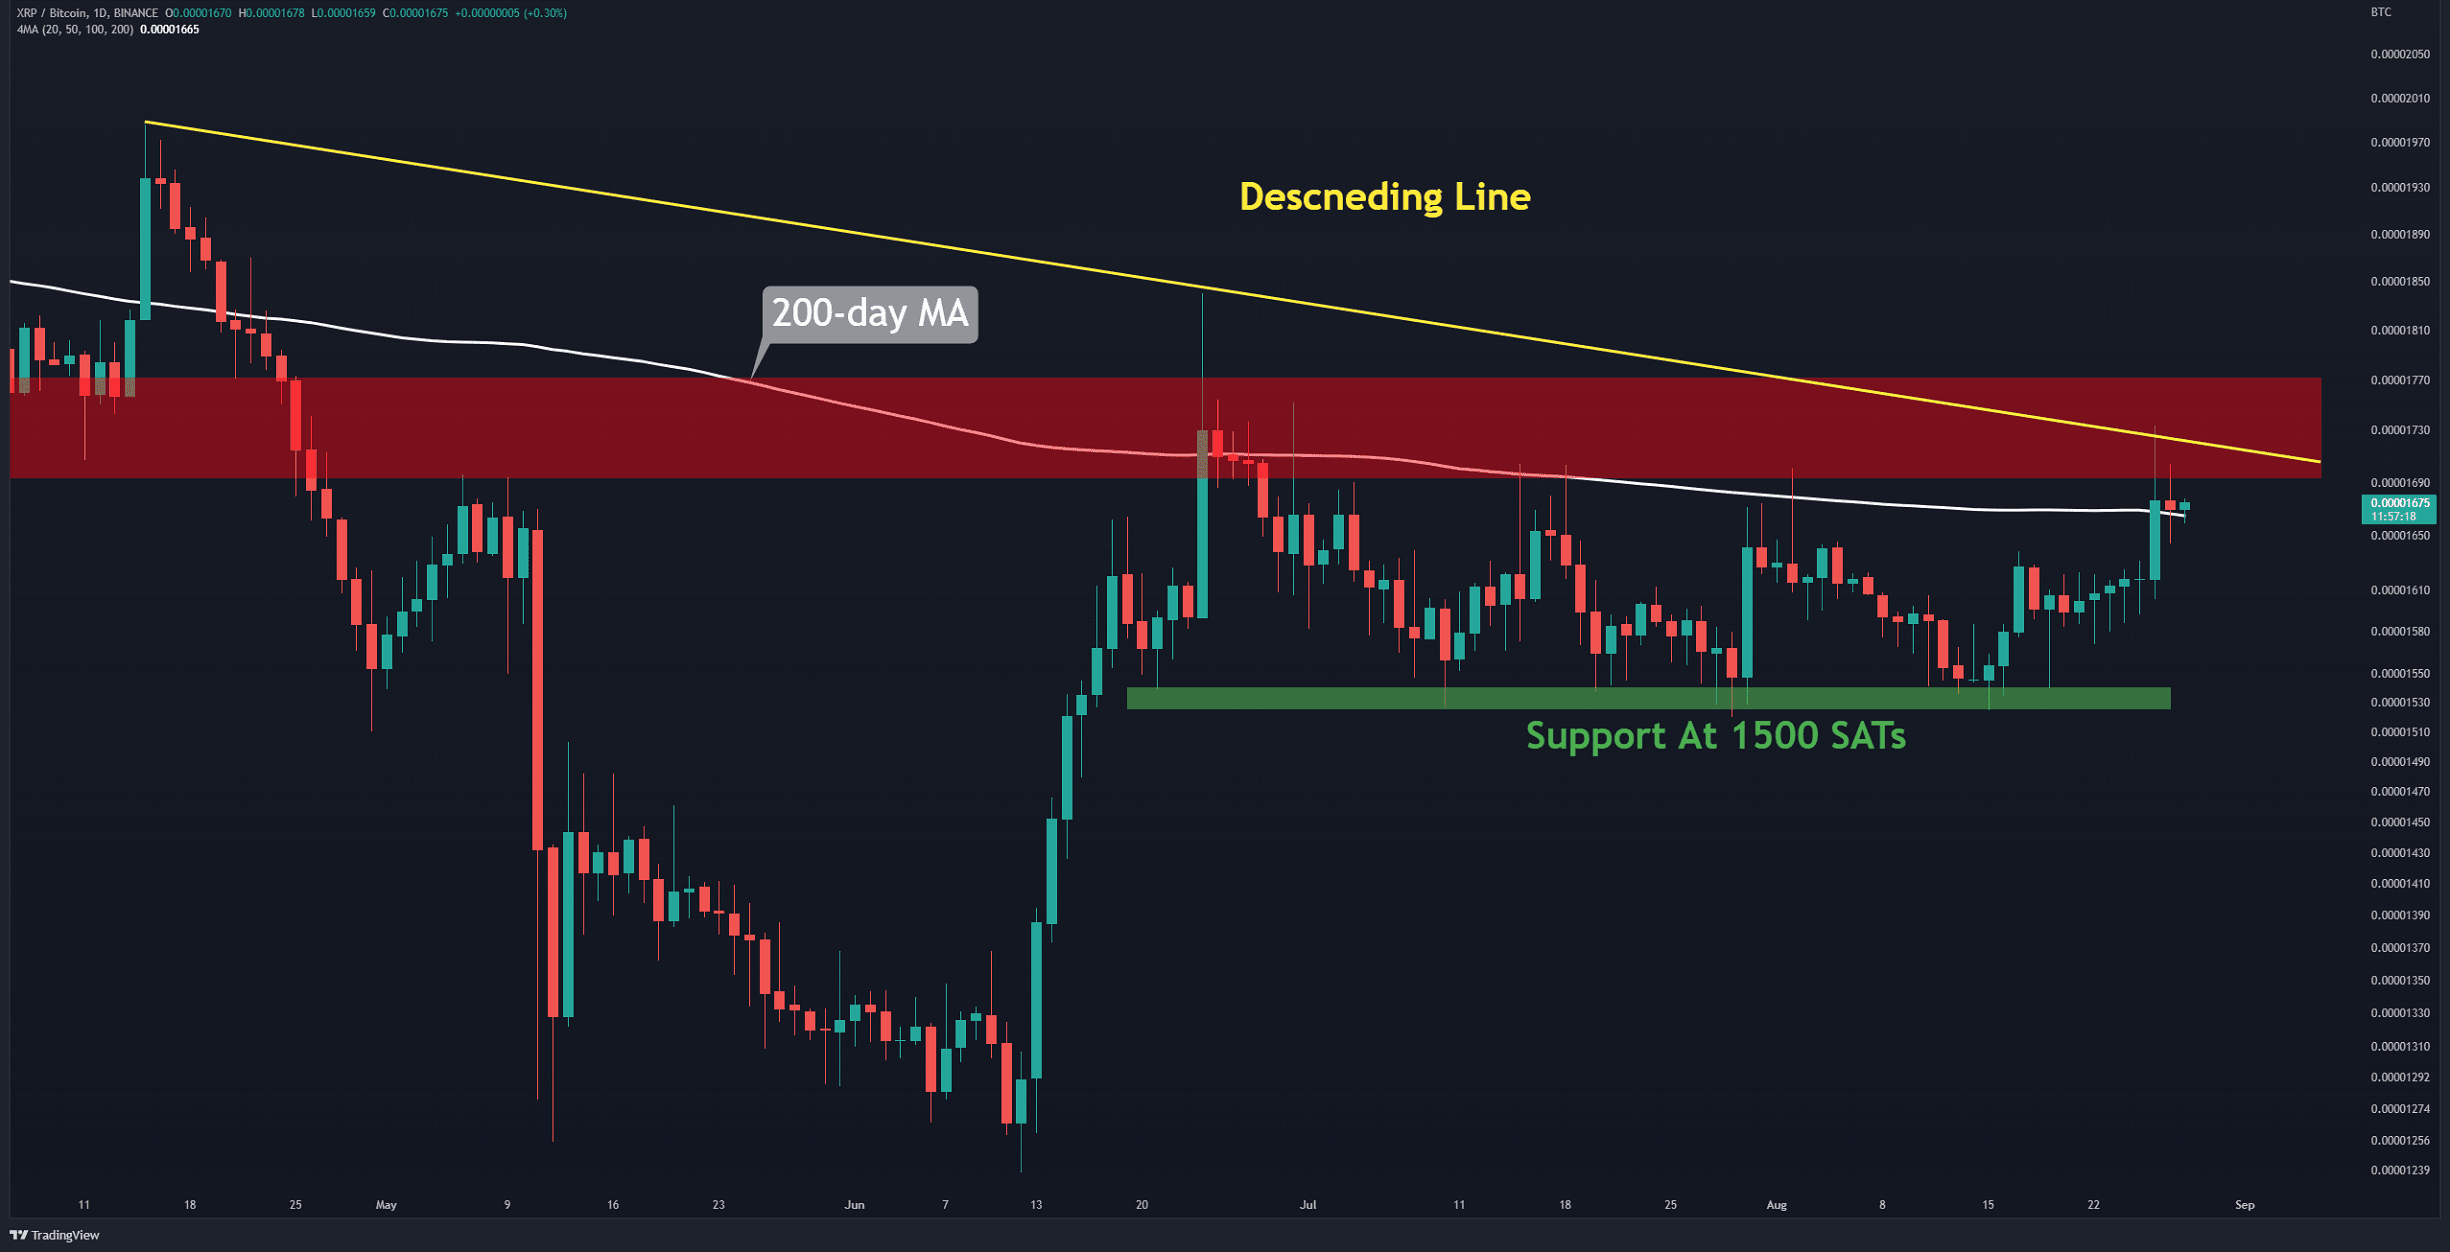
The XRP/BTC Chart
Interestingly, in the XRP/BTC chart, the bulls dominate the market to a certain degree. They have increased the price by more than 10% over the last two weeks. This has caused the pair to break above the 200-day moving average line (in white) and close two daily candles above it.
However, the resistance of the descending line (in yellow), combined with the resistance zone in the range of 1700-1800 SATs (in red), could potentially reject the momentum.
Key Support Levels: 1500 SATs & 1370 SATs
Key Resistance Levels: 1700 SATs & 2100 SATs