Markets are waiting for the arrival of the FOMC meeting, which has been creating uncertainty. Last night, XRP closed its second consecutive weekly red candle. This put the rising trend that began in mid-November on the edge of reversal. Technical Analysis By Grizzly The Daily Chart Ripple is trading below the 200-day moving average line (in white) on the daily chart and is expected to close a third consecutive candle below it. The descending triangle (in yellow), technically a bearish pattern, has resulted in lower highs, indicating that sellers have the upper hand in influencing market outcomes. Short setups can be triggered if the price slips below the horizontal support at %excerpt%.37. The initial short-term support in this scenario is found at %excerpt%.35. A breakout from above
Topics:
CryptoVizArt considers the following as important: Ripple (XRP) Price, XRP Analysis, xrpbtc, xrpusd
This could be interesting, too:
Dimitar Dzhondzhorov writes Is a Major Ripple v. SEC Lawsuit Development Expected This Week? Here’s Why
Mandy Williams writes Ripple Releases Institutional DeFi Roadmap for XRP Ledger in 2025
Dimitar Dzhondzhorov writes Ripple Whales Go on a Selling Spree: Is XRP Headed for a Further Correction?
Jordan Lyanchev writes ChatGPT and DeepSeek Analyze Ripple’s (XRP) Price Potential for 2025
Markets are waiting for the arrival of the FOMC meeting, which has been creating uncertainty. Last night, XRP closed its second consecutive weekly red candle. This put the rising trend that began in mid-November on the edge of reversal.
Technical Analysis
By Grizzly
The Daily Chart
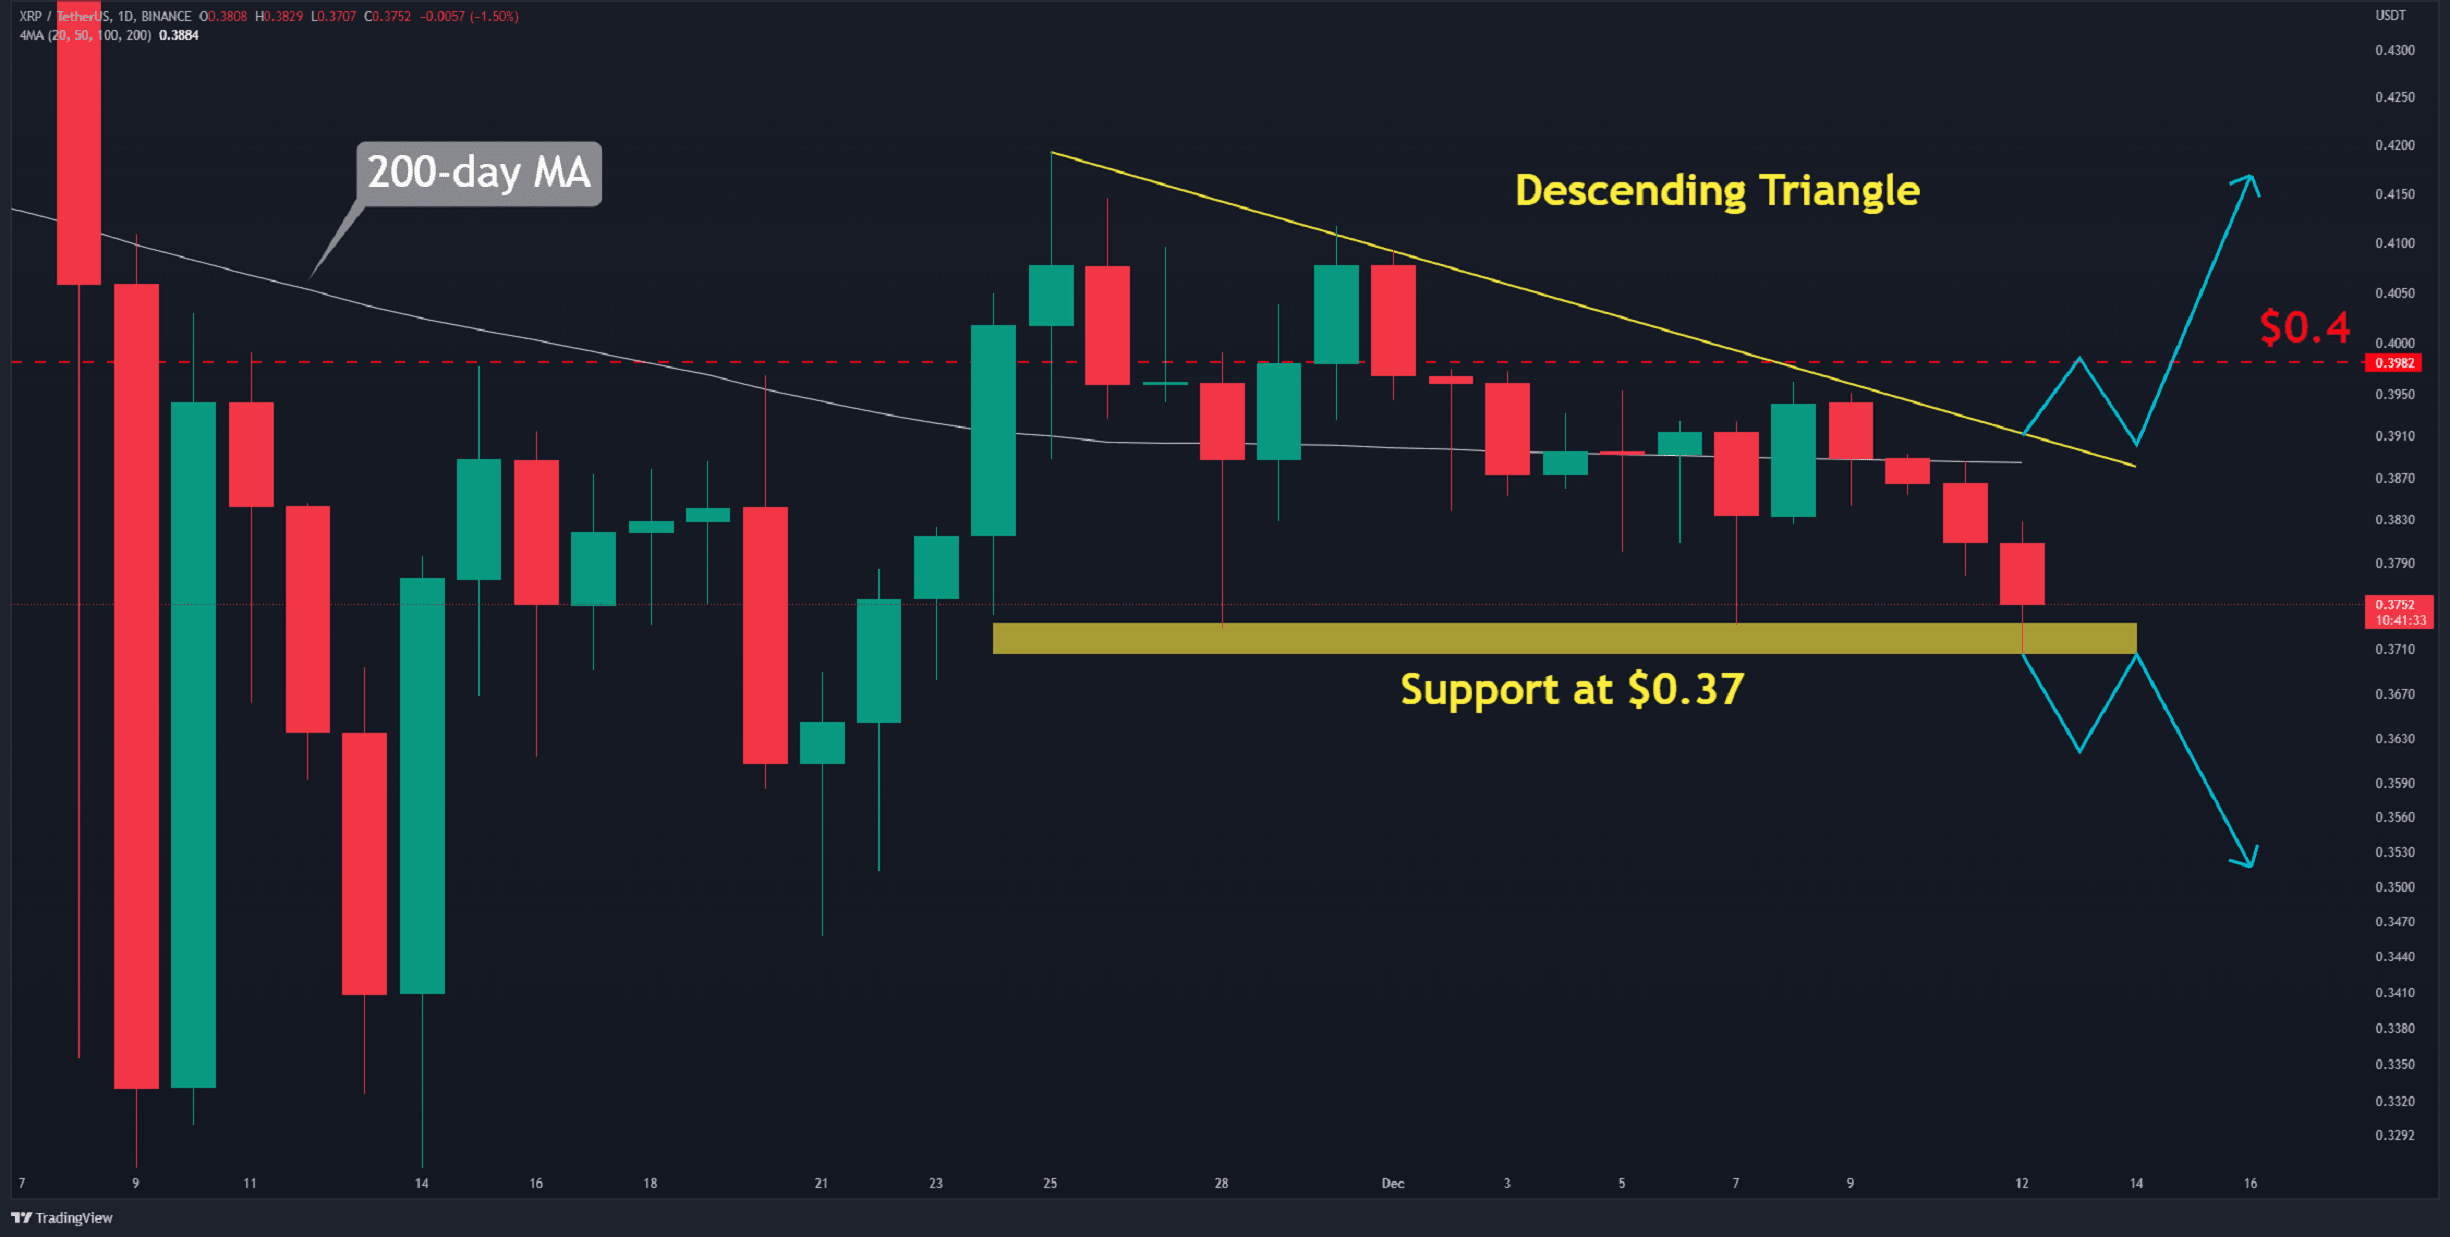
Ripple is trading below the 200-day moving average line (in white) on the daily chart and is expected to close a third consecutive candle below it.
The descending triangle (in yellow), technically a bearish pattern, has resulted in lower highs, indicating that sellers have the upper hand in influencing market outcomes. Short setups can be triggered if the price slips below the horizontal support at $0.37. The initial short-term support in this scenario is found at $0.35.
A breakout from above and a $0.4 flip, on the other hand, would be bullish. The cryptocurrency would likely retest $0.42 in this scenario.
Leaving this level behind will pave the way for a bullish rally on the daily chart. A move of this magnitude would have a target of roughly $0.5.
Moving Averages:
MA20: $0.39
MA50: $0.41
MA100: $0.42
MA200: $0.39
The XRP/BTC Chart
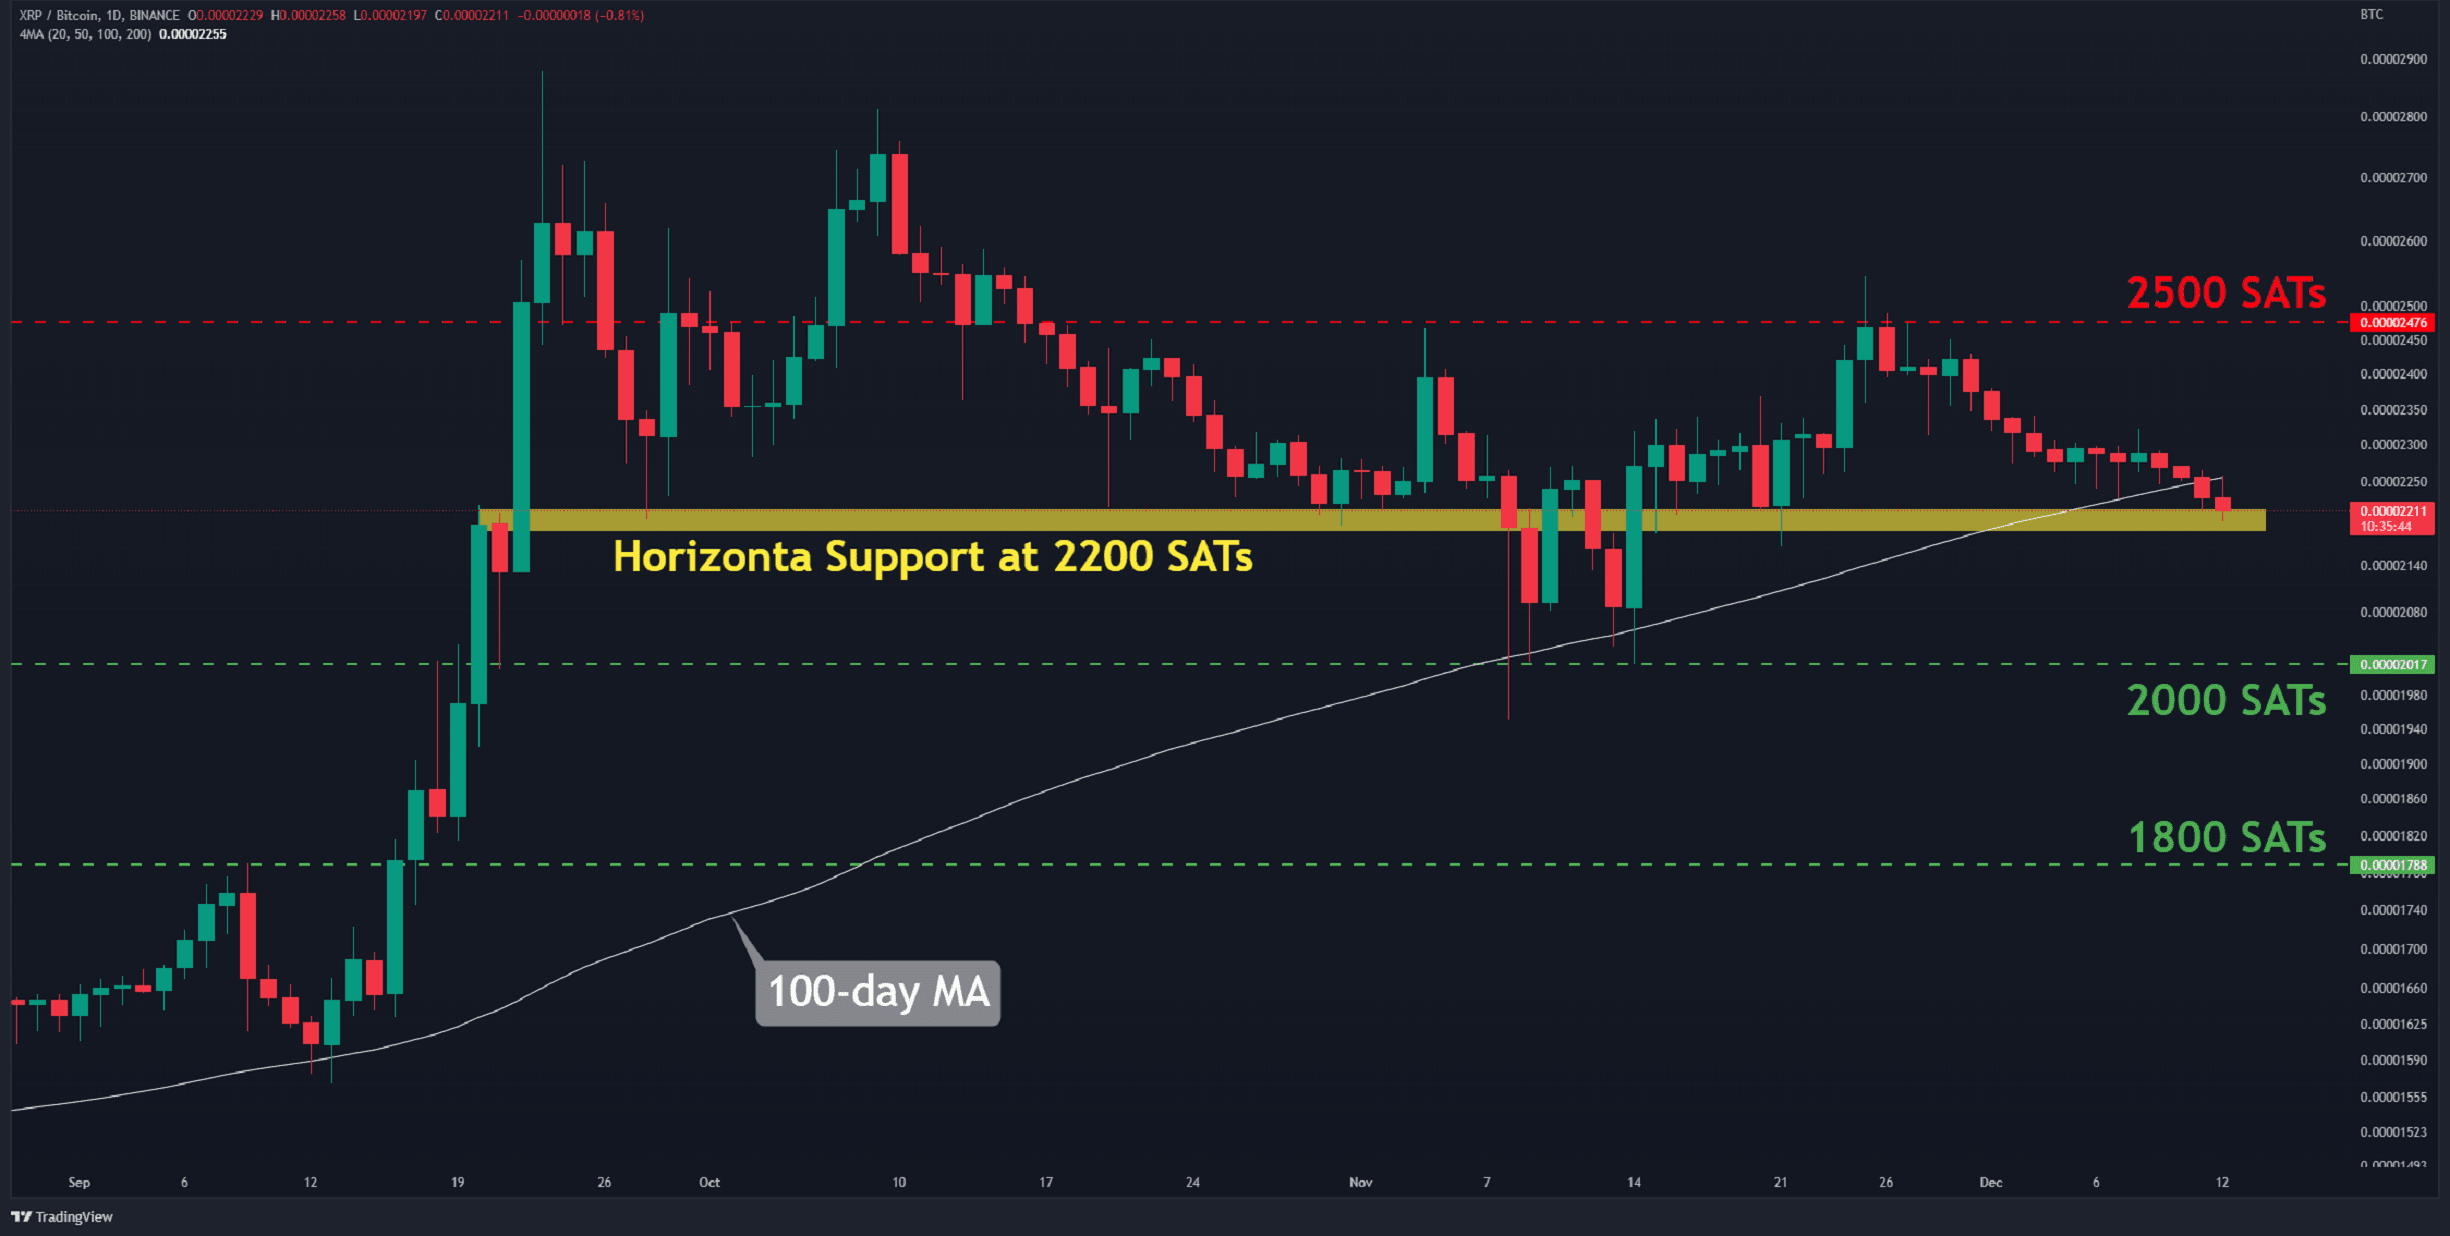
Against Bitcoin, the price is poised to close its second candlestick below the 100-day moving average line (in white), which has been unprecedented in recent months.
Currently, the most critical support is at 2200 SATs (in yellow). If it cracks, selling pressure can escalate, perhaps forcing the pair to retest 2000 SATs (in green).
The September uptrend, on the other hand, can restart only if the price can surpass 2500 SATs (in red).
Key Support Levels: 2000 SATS, 1800 SATs
Key Resistance Levels: 2500 SATs, 2900 SATs