With only two days remaining for September, XRP records its best month so far. However, the bearish trend reversal has not yet been confirmed. Technical Analysis By Grizzly The Weekly Chart Last week, XRP reached (and was rejected) to a critical level of %excerpt%.56 on the weekly chart. This resistance is combined of the ascending line (in yellow) and the red horizontal resistance. As a side note, it’s not uncommon to see a weekly red candle after multiple green candles. Unless breaking down below %excerpt%.4, it’s likely to see XRP performing another retest of the %excerpt%.56 level. A break and close above %excerpt%.56 will likely trigger a bullish momentum. The Relative Strength Index (RSI) backs up the above sentiment. The RSI indicates that the market continues to see increased selling pressure
Topics:
CryptoVizArt considers the following as important: Ripple (XRP) Price, XRP Analysis, xrpbtc, xrpusd
This could be interesting, too:
Dimitar Dzhondzhorov writes Is a Major Ripple v. SEC Lawsuit Development Expected This Week? Here’s Why
Mandy Williams writes Ripple Releases Institutional DeFi Roadmap for XRP Ledger in 2025
Dimitar Dzhondzhorov writes Ripple Whales Go on a Selling Spree: Is XRP Headed for a Further Correction?
Jordan Lyanchev writes ChatGPT and DeepSeek Analyze Ripple’s (XRP) Price Potential for 2025
With only two days remaining for September, XRP records its best month so far. However, the bearish trend reversal has not yet been confirmed.
Technical Analysis
By Grizzly
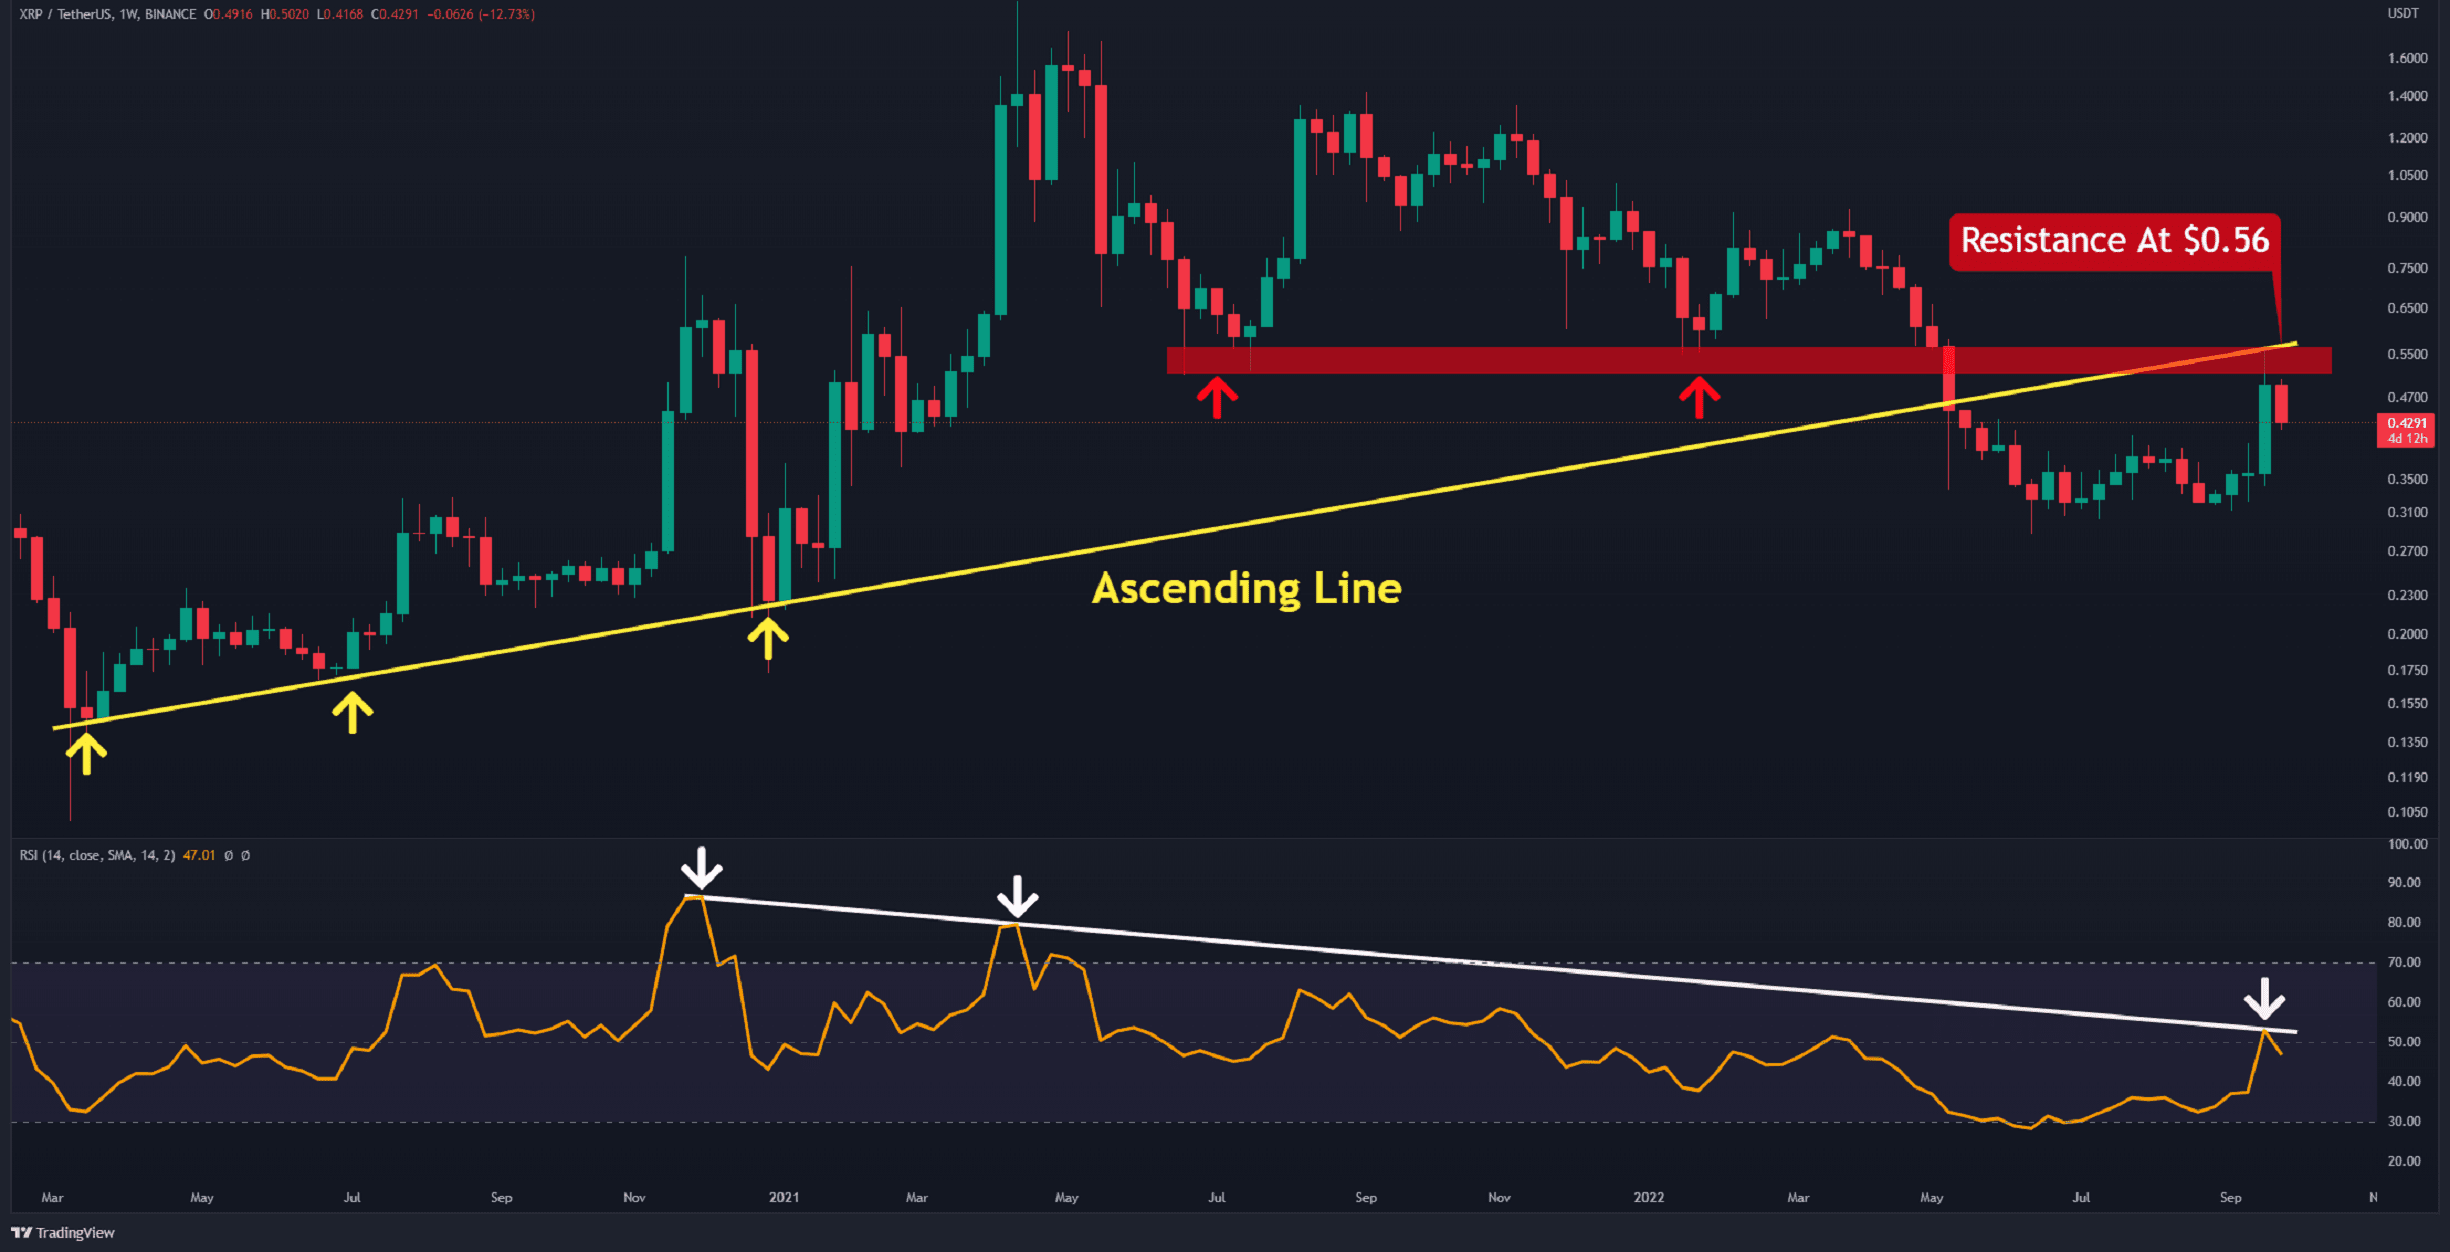
The Weekly Chart
Last week, XRP reached (and was rejected) to a critical level of $0.56 on the weekly chart. This resistance is combined of the ascending line (in yellow) and the red horizontal resistance. As a side note, it’s not uncommon to see a weekly red candle after multiple green candles.
Unless breaking down below $0.4, it’s likely to see XRP performing another retest of the $0.56 level. A break and close above $0.56 will likely trigger a bullish momentum.
The Relative Strength Index (RSI) backs up the above sentiment. The RSI indicates that the market continues to see increased selling pressure as the RSI indicator is below 50. Breaking above the descending line (in white) corresponds to the price’s resistance zone breakout.
Key Support Levels: $0.4 & $0.3
Key Resistance Levels: $0.56 & $0.75
Weekly Moving Averages:
MA20: $0.36
MA50: $0.63
MA100: $0.70
MA200: $0.48
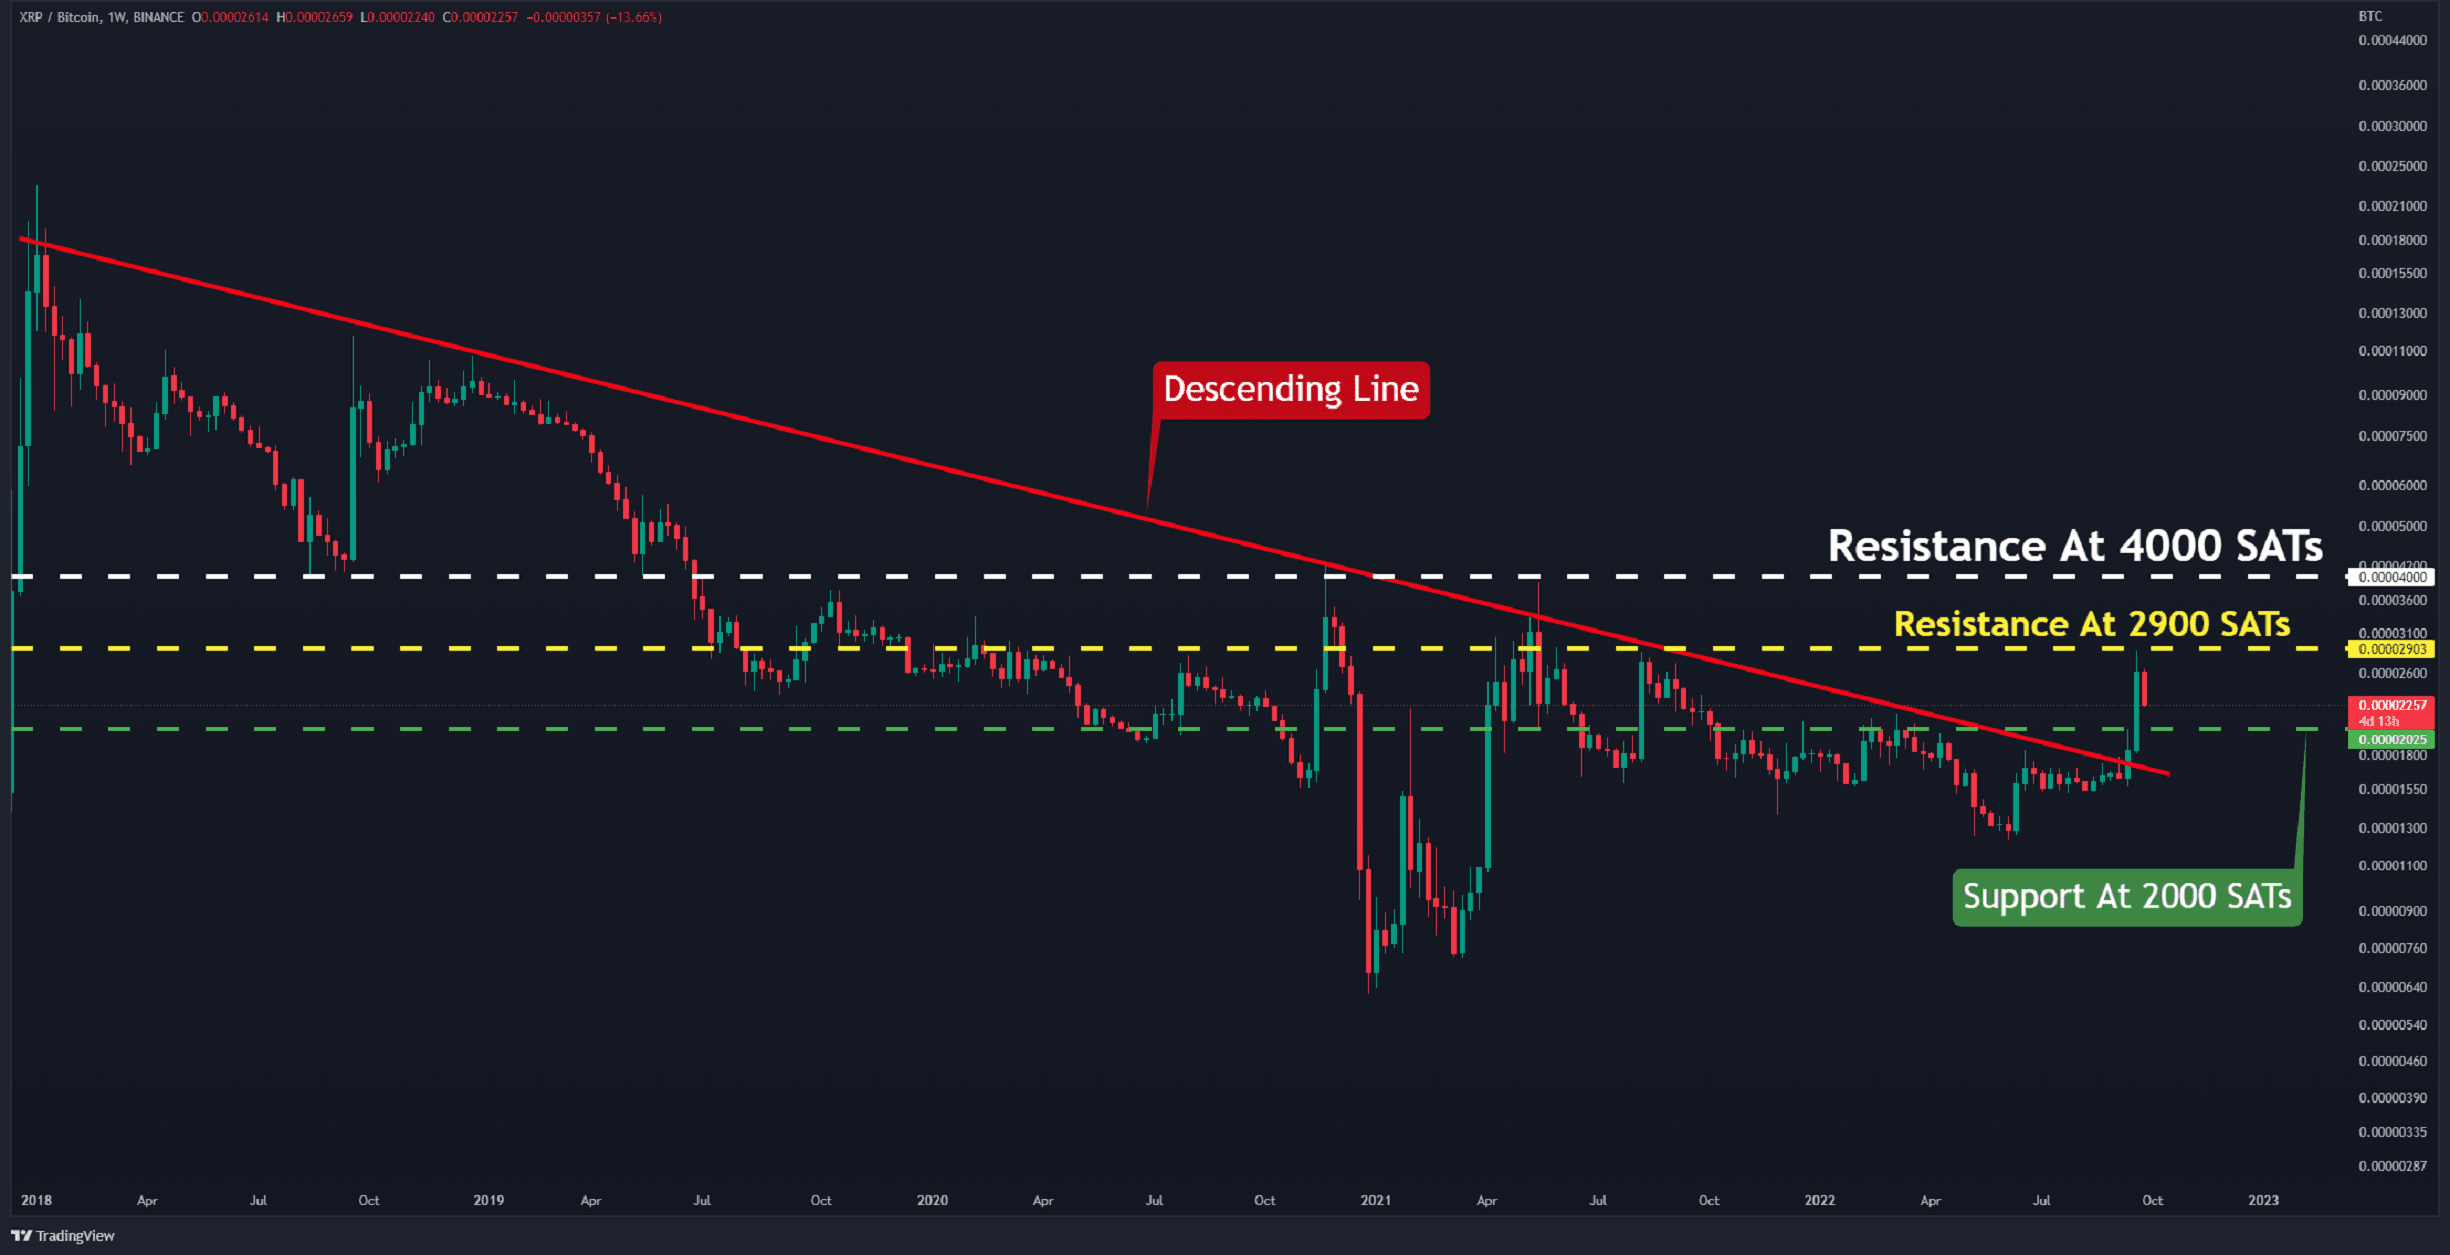
The XRP/BTC Chart
After the descending line barrier (in red) was cleared, a bullish spike began against Bitcoin, lasting until it encountered resistance amid 2900 SATs (in yellow).
Suppose that the XRP price against BTC experiences a brief pullback to the support at 2000 SATs (in green); a retest of 2,900 SATs is likely in the next weeks.
Alternately, breaking 2,900 SATs will resume the recent bullish momentum. The target for such a move might be around the 4000 SATs area (in white), the highest level recorded in 2021.
Key Support Levels: 2000 SATs & 1500 SATs
Key Resistance Levels: 2900 SATs & 4000 SATs