Ripple is on the verge of closing its second green weekly candle. However, there is a horizontal obstacle on the way to higher levels, which will be discussed further below. Technical Analysis By Grizzly The Daily Chart: XRP managed to recapture the 200-day moving average line (in white) on the daily chart after struggling since mid-November. Technically, this pattern denotes a positive psychological momentum in the market.Although the bullish sentiment is observable on the chart, the horizontal resistance in the %excerpt%.42 to %excerpt%.43 region (in red) should be regarded as a strong obstacle. After the May collapse, XRP remained below this level for a few months. Suppose that the asset will overcome this obstacle. In this case, an upward trend with a target of %excerpt%.55 is likely. This
Topics:
CryptoVizArt considers the following as important: Ripple (XRP) Price, XRP Analysis, xrpbtc, xrpusd
This could be interesting, too:
Dimitar Dzhondzhorov writes Is a Major Ripple v. SEC Lawsuit Development Expected This Week? Here’s Why
Mandy Williams writes Ripple Releases Institutional DeFi Roadmap for XRP Ledger in 2025
Dimitar Dzhondzhorov writes Ripple Whales Go on a Selling Spree: Is XRP Headed for a Further Correction?
Jordan Lyanchev writes ChatGPT and DeepSeek Analyze Ripple’s (XRP) Price Potential for 2025
Ripple is on the verge of closing its second green weekly candle. However, there is a horizontal obstacle on the way to higher levels, which will be discussed further below.
Technical Analysis
By Grizzly
The Daily Chart:
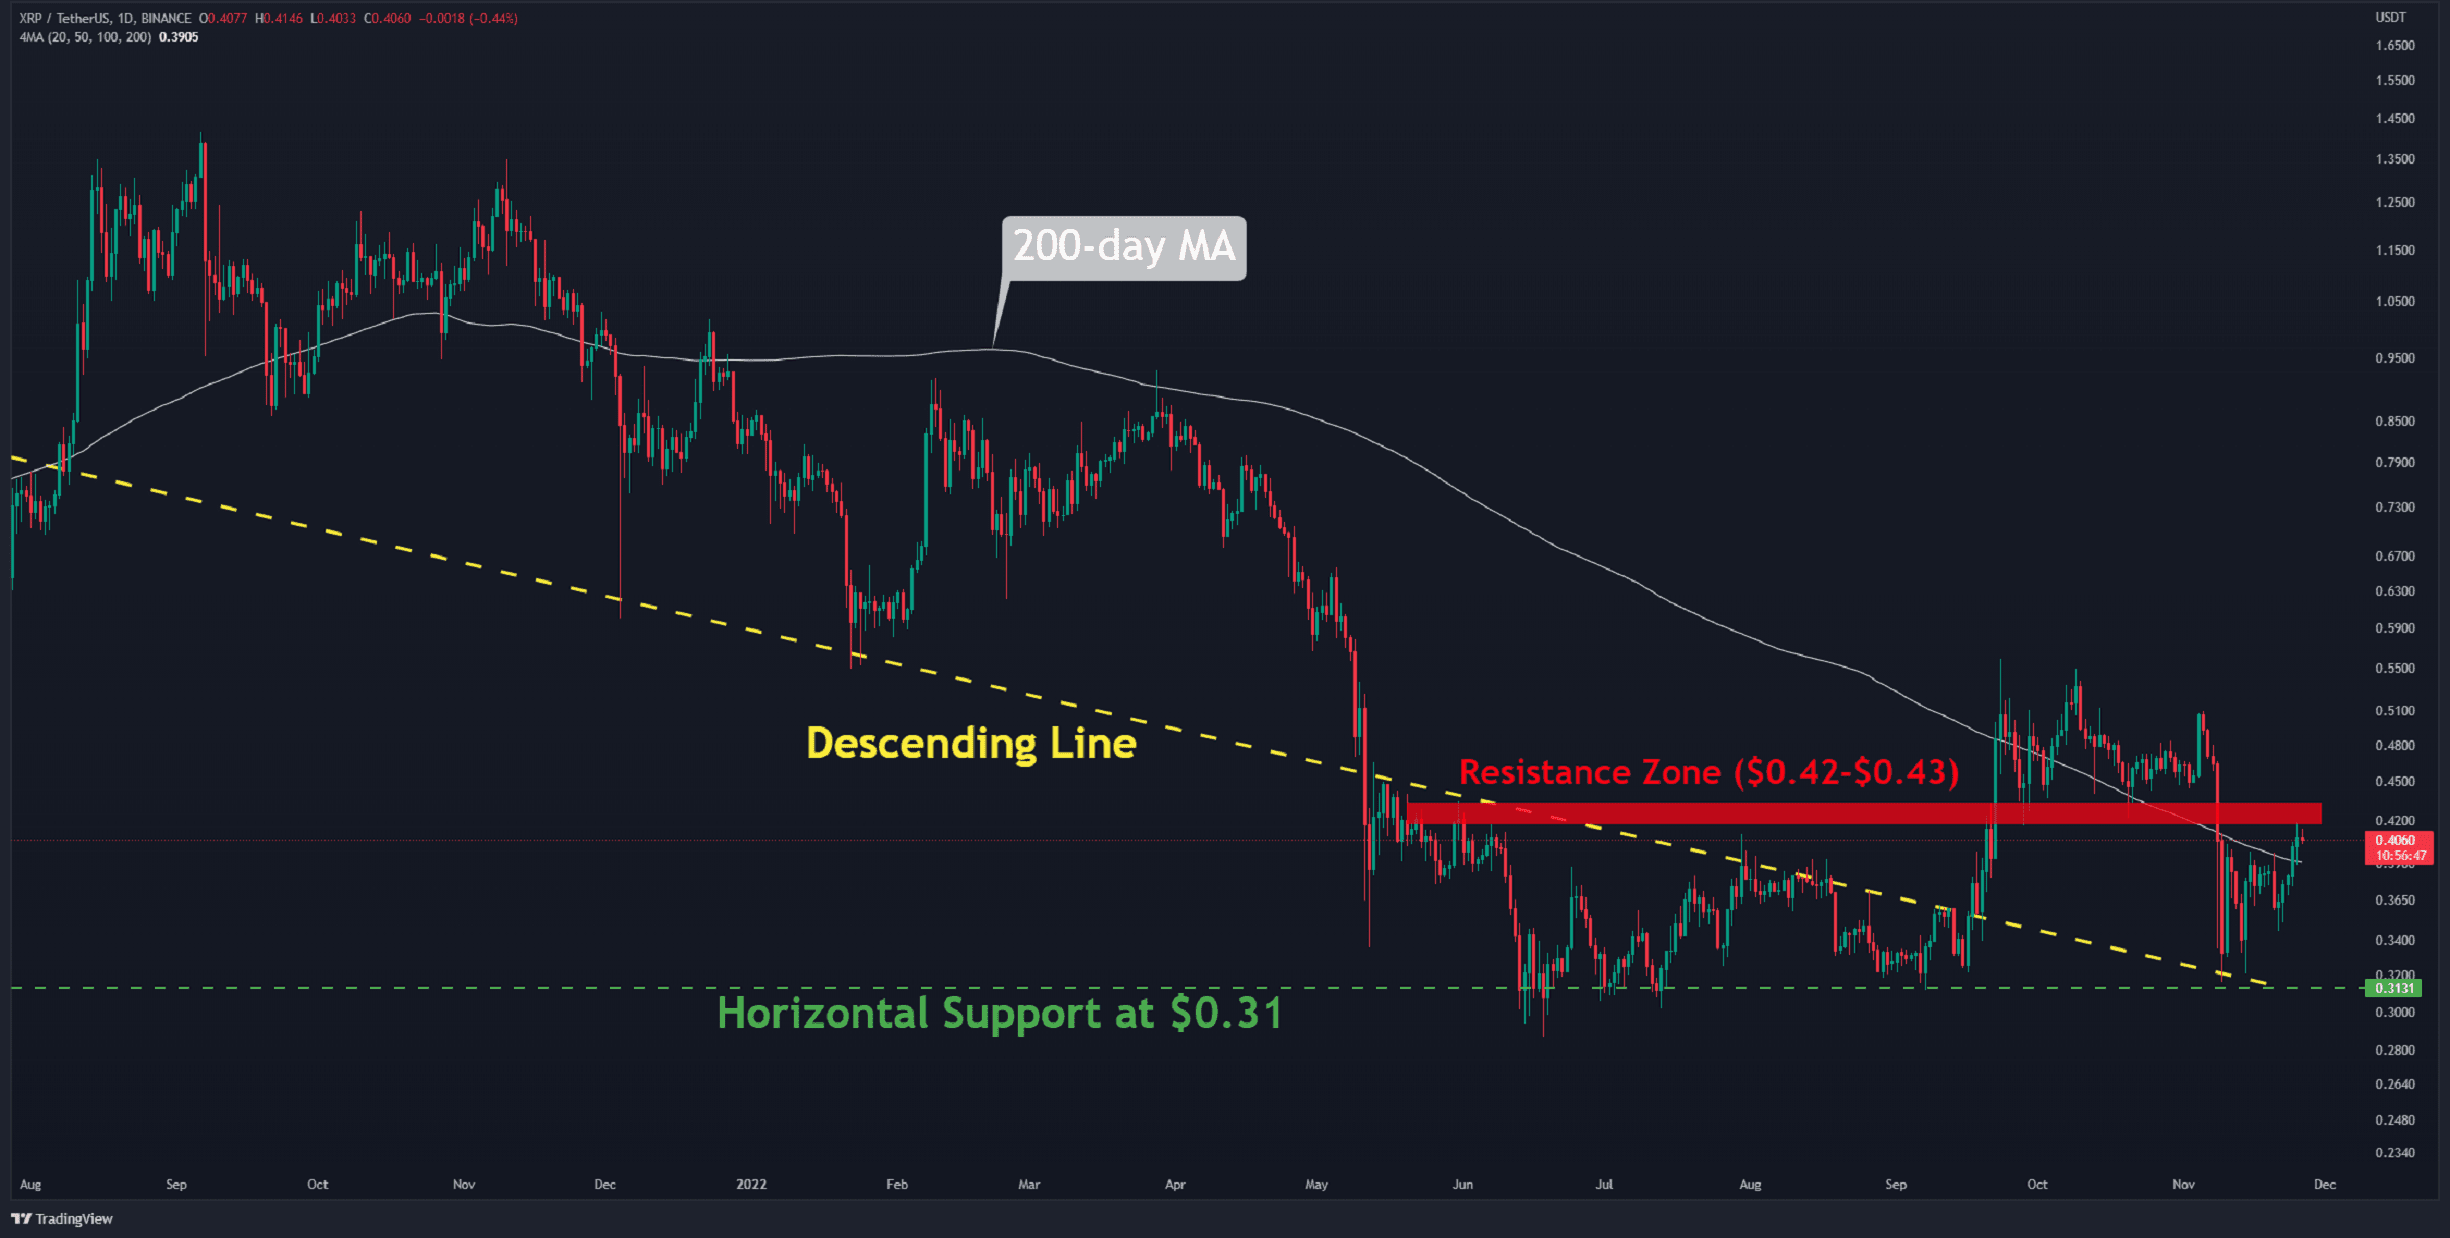
XRP managed to recapture the 200-day moving average line (in white) on the daily chart after struggling since mid-November. Technically, this pattern denotes a positive psychological momentum in the market.
Although the bullish sentiment is observable on the chart, the horizontal resistance in the $0.42 to $0.43 region (in red) should be regarded as a strong obstacle. After the May collapse, XRP remained below this level for a few months.
Suppose that the asset will overcome this obstacle. In this case, an upward trend with a target of $0.55 is likely. This level prevented further price growth in September and October.
A brief pullback to $0.37, on the other hand, is also considered healthy. As long as XRP trades above this level, it can always retest the highlighted overhead resistance.
Moving Averages:
MA20: $0.38
MA50: $0.44
MA100: $0.41
MA200: $0.39
The XRP/BTC Chart:
The chart shows an early indication of an end to the negative trend. In the latest correction, no candle closed below 2000 SATs, emphasizing the need to keep an eye on this level as critical support. The pair has recovered from the 61.8% Fib level (in yellow) and is presently hitting the 23.6% level at 2500 SATs (in blue). If the price can break over this resistance, it will be poised to retest the 2800 SATs.
In this chart, the primary support is at 2200 SATs (in green). The optimistic outlook remains strong in the short term as long as the pair maintains above it.
Key Support Levels: 2200 SATS, 2000 SATs
Key Resistance Levels: 2500 SATs, 2800 SATs
