Ripple is aiming for higher price levels as the market experienced another uptrend over the previous week. The trend’s momentum looks promising, yet the price must first surpass the crucial resistance level of %excerpt%.43. Technical Analysis By Shayan The Daily Chart After a short-term consolidation at the %excerpt%.39 level, the price finally broke the 100-day and 200-day moving average lines with significant momentum and continues to spike. A breakout from the 200-day moving average is considered a substantial bullish sign in terms of price action and impacts the whole sentiment of the market. However, the price faces a crucial resistance region consisting of the static resistance zone of %excerpt%.41-%excerpt%.43 and the channel’s middle boundary. This means there is a war going on between buyers
Topics:
CryptoVizArt considers the following as important: Ripple (XRP) Price, XRP Analysis, xrpbtc, xrpusd
This could be interesting, too:
Jordan Lyanchev writes Ripple’s (XRP) Surge to Triggers Over Million in Short Liquidations
Jordan Lyanchev writes Trump Confirms Work on Strategic Crypto Reserve: XRP, ADA, SOL Included
Dimitar Dzhondzhorov writes Is a Major Ripple v. SEC Lawsuit Development Expected This Week? Here’s Why
Mandy Williams writes Ripple Releases Institutional DeFi Roadmap for XRP Ledger in 2025
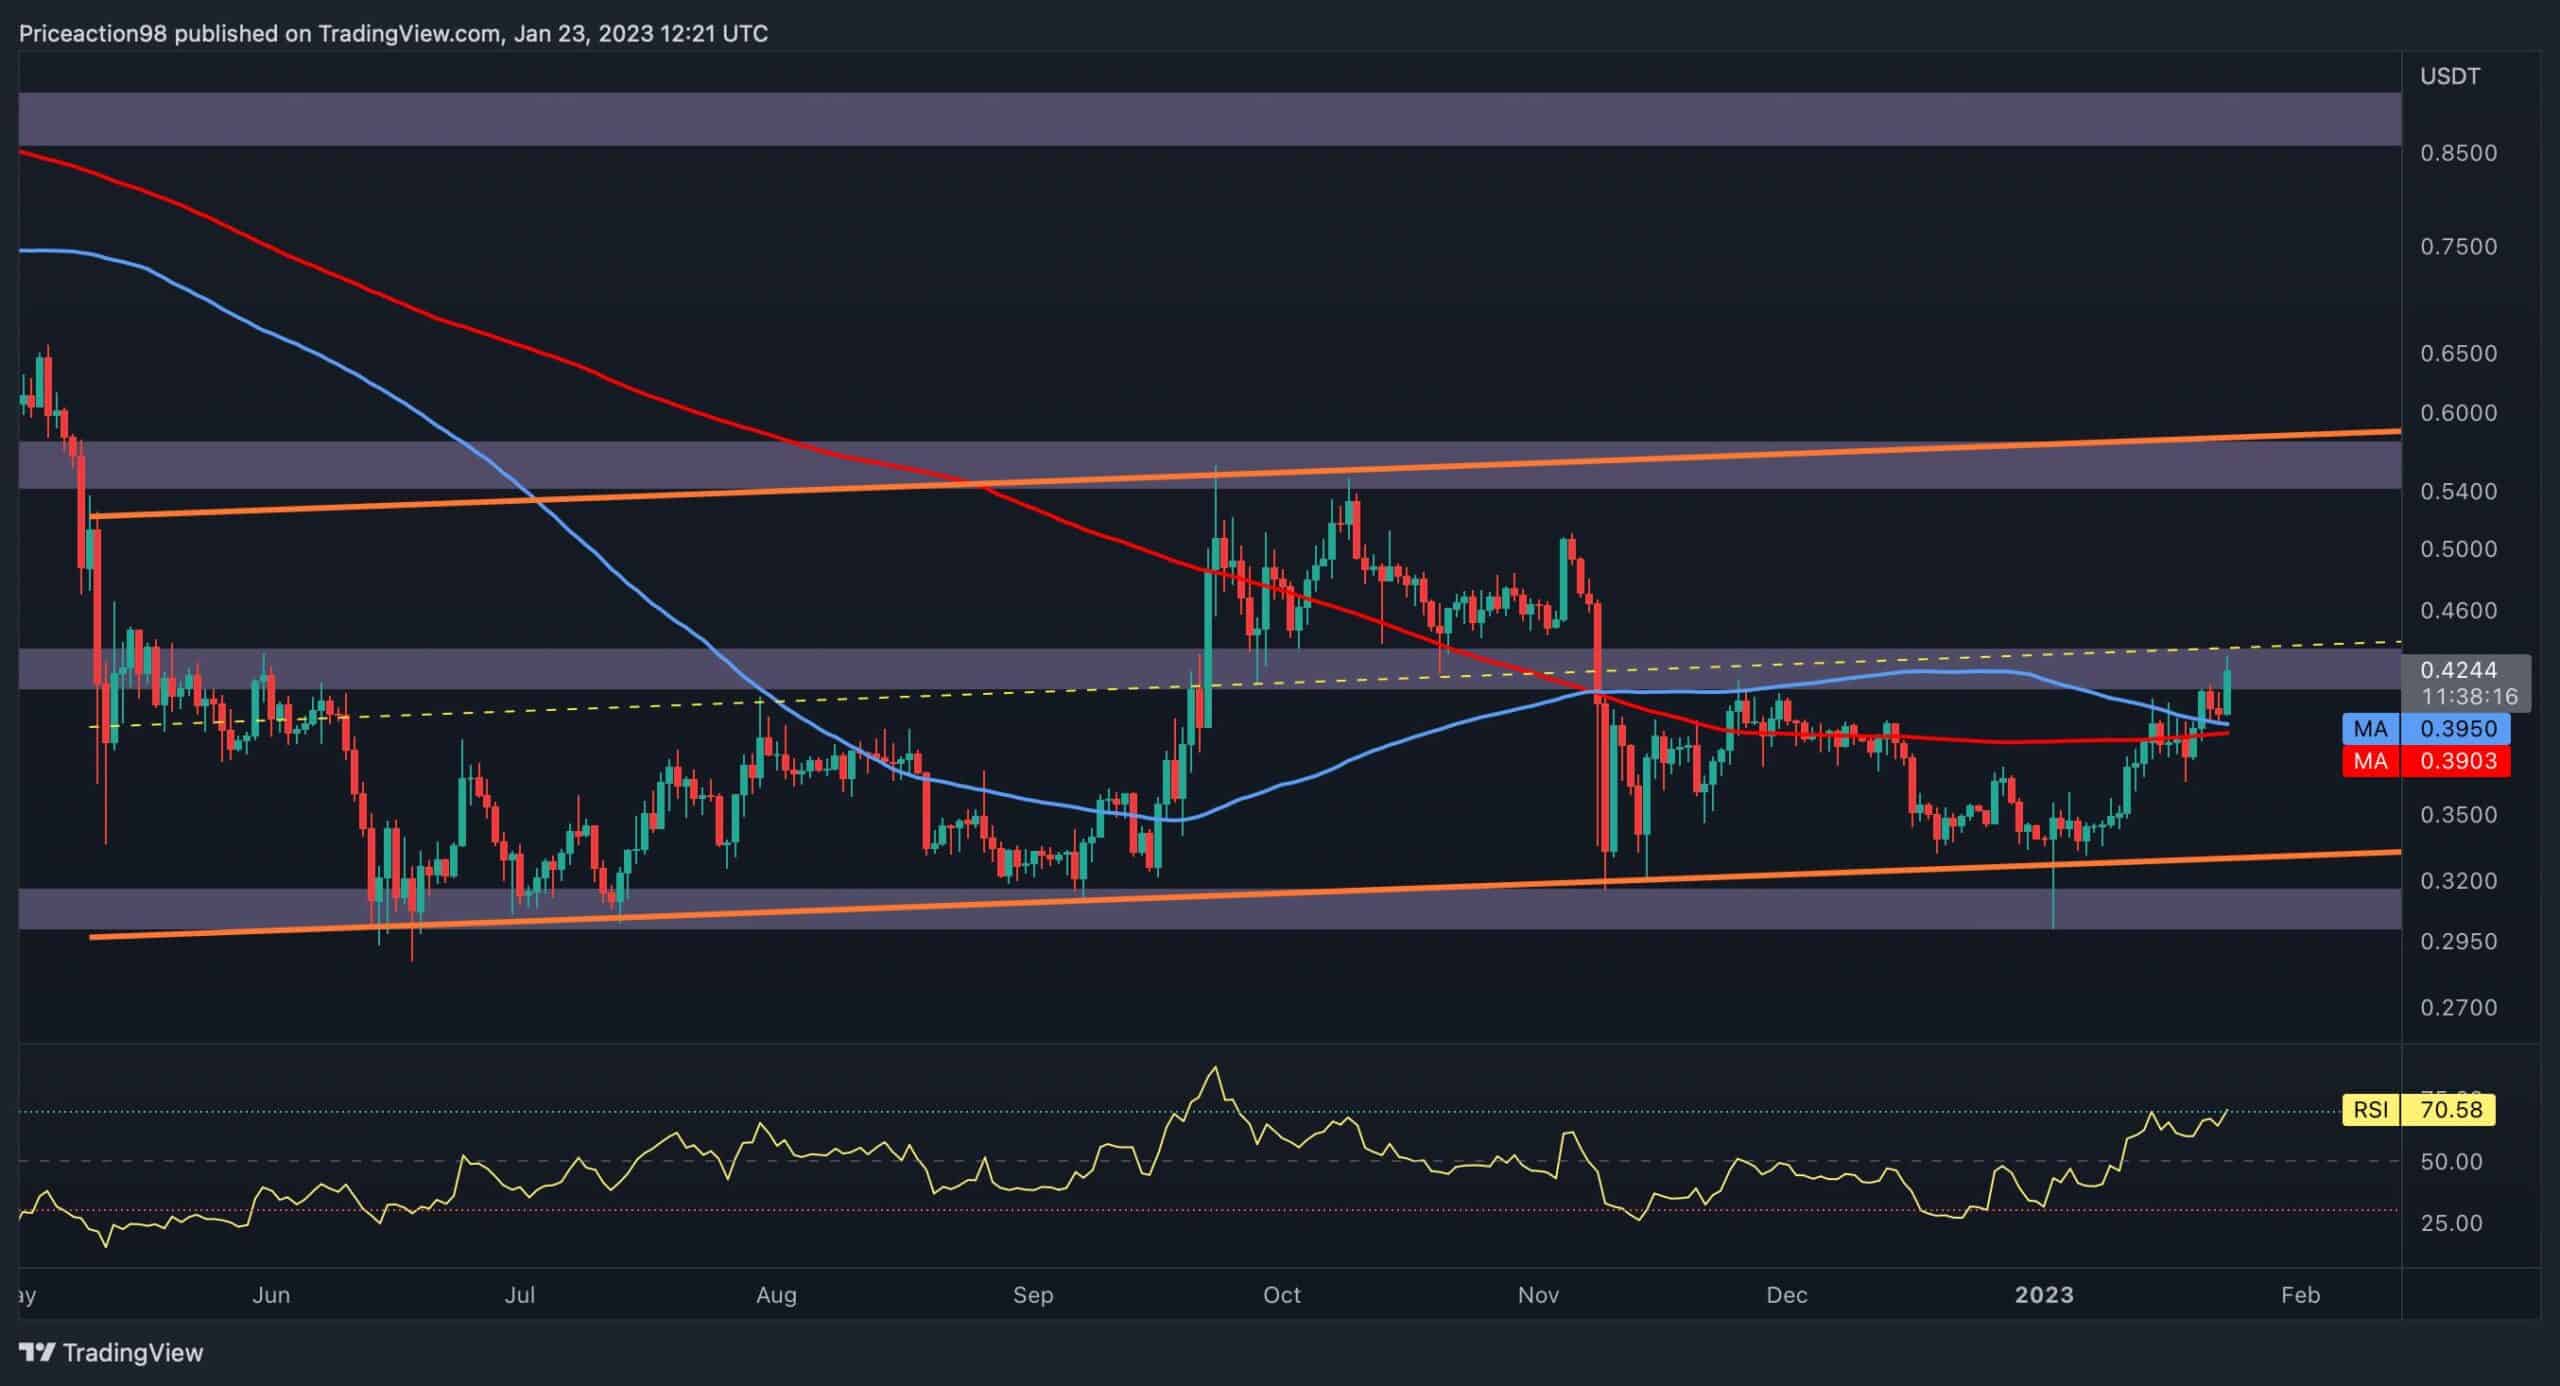
Ripple is aiming for higher price levels as the market experienced another uptrend over the previous week. The trend’s momentum looks promising, yet the price must first surpass the crucial resistance level of $0.43.
Technical Analysis
By Shayan
The Daily Chart
After a short-term consolidation at the $0.39 level, the price finally broke the 100-day and 200-day moving average lines with significant momentum and continues to spike.
A breakout from the 200-day moving average is considered a substantial bullish sign in terms of price action and impacts the whole sentiment of the market.
However, the price faces a crucial resistance region consisting of the static resistance zone of $0.41-$0.43 and the channel’s middle boundary. This means there is a war going on between buyers and sellers.
The upcoming price action will determine XRP’s short-term path, and if the bulls achieve dominance and the price surpasses the mentioned level, another spike will be anticipated.
On the contrary, if the price fails to break out, a decline will possibly occur, followed by short-term fluctuations.
The 4-Hour Chart
On the 4-hour timeframe, the abovementioned resistance zone of $0.41-$0.43 is more apparent as it has recently rejected the price in late November. Currently, the price faces the yellow descending trendline at the same level, which makes it a more powerful resistance zone.
Nevertheless, a solid bearish divergence between the price and the RSI indicator has formed and could reverse the current trend, resulting in a slight decline. As a result, the odds are against Ripple in terms of price action, and a short-term rejection looks imminent.
Still, the market may surprise participants with a short-squeeze event and impulsively break above this resistance region.
