After four straight weeks of price fluctuation with extremely low volatility, XRP finally initiated a rally and broke above the 50-day moving average. However, the uptrend came to a halt after reaching the 100-day moving average, and the price is now attempting to surpass it. Technical Analysis By Shayan The Daily Chart The 50-day moving average had been acting as resistance to the price for several months. However, the bulls recently pushed the price above this range. This resulted in a rally toward the next critical resistance level, which stands at %excerpt%.4. Presently, the cryptocurrency is up against a significant resistance region, which includes the 100-day moving average and the static resistance level of %excerpt%.5, which also aligns with the channel’s upper trendline. In
Topics:
CryptoVizArt considers the following as important: Ripple (XRP) Price, XRP Analysis, xrpbtc, xrpusd
This could be interesting, too:
Dimitar Dzhondzhorov writes Is a Major Ripple v. SEC Lawsuit Development Expected This Week? Here’s Why
Mandy Williams writes Ripple Releases Institutional DeFi Roadmap for XRP Ledger in 2025
Dimitar Dzhondzhorov writes Ripple Whales Go on a Selling Spree: Is XRP Headed for a Further Correction?
Jordan Lyanchev writes ChatGPT and DeepSeek Analyze Ripple’s (XRP) Price Potential for 2025
After four straight weeks of price fluctuation with extremely low volatility, XRP finally initiated a rally and broke above the 50-day moving average. However, the uptrend came to a halt after reaching the 100-day moving average, and the price is now attempting to surpass it.
Technical Analysis
By Shayan
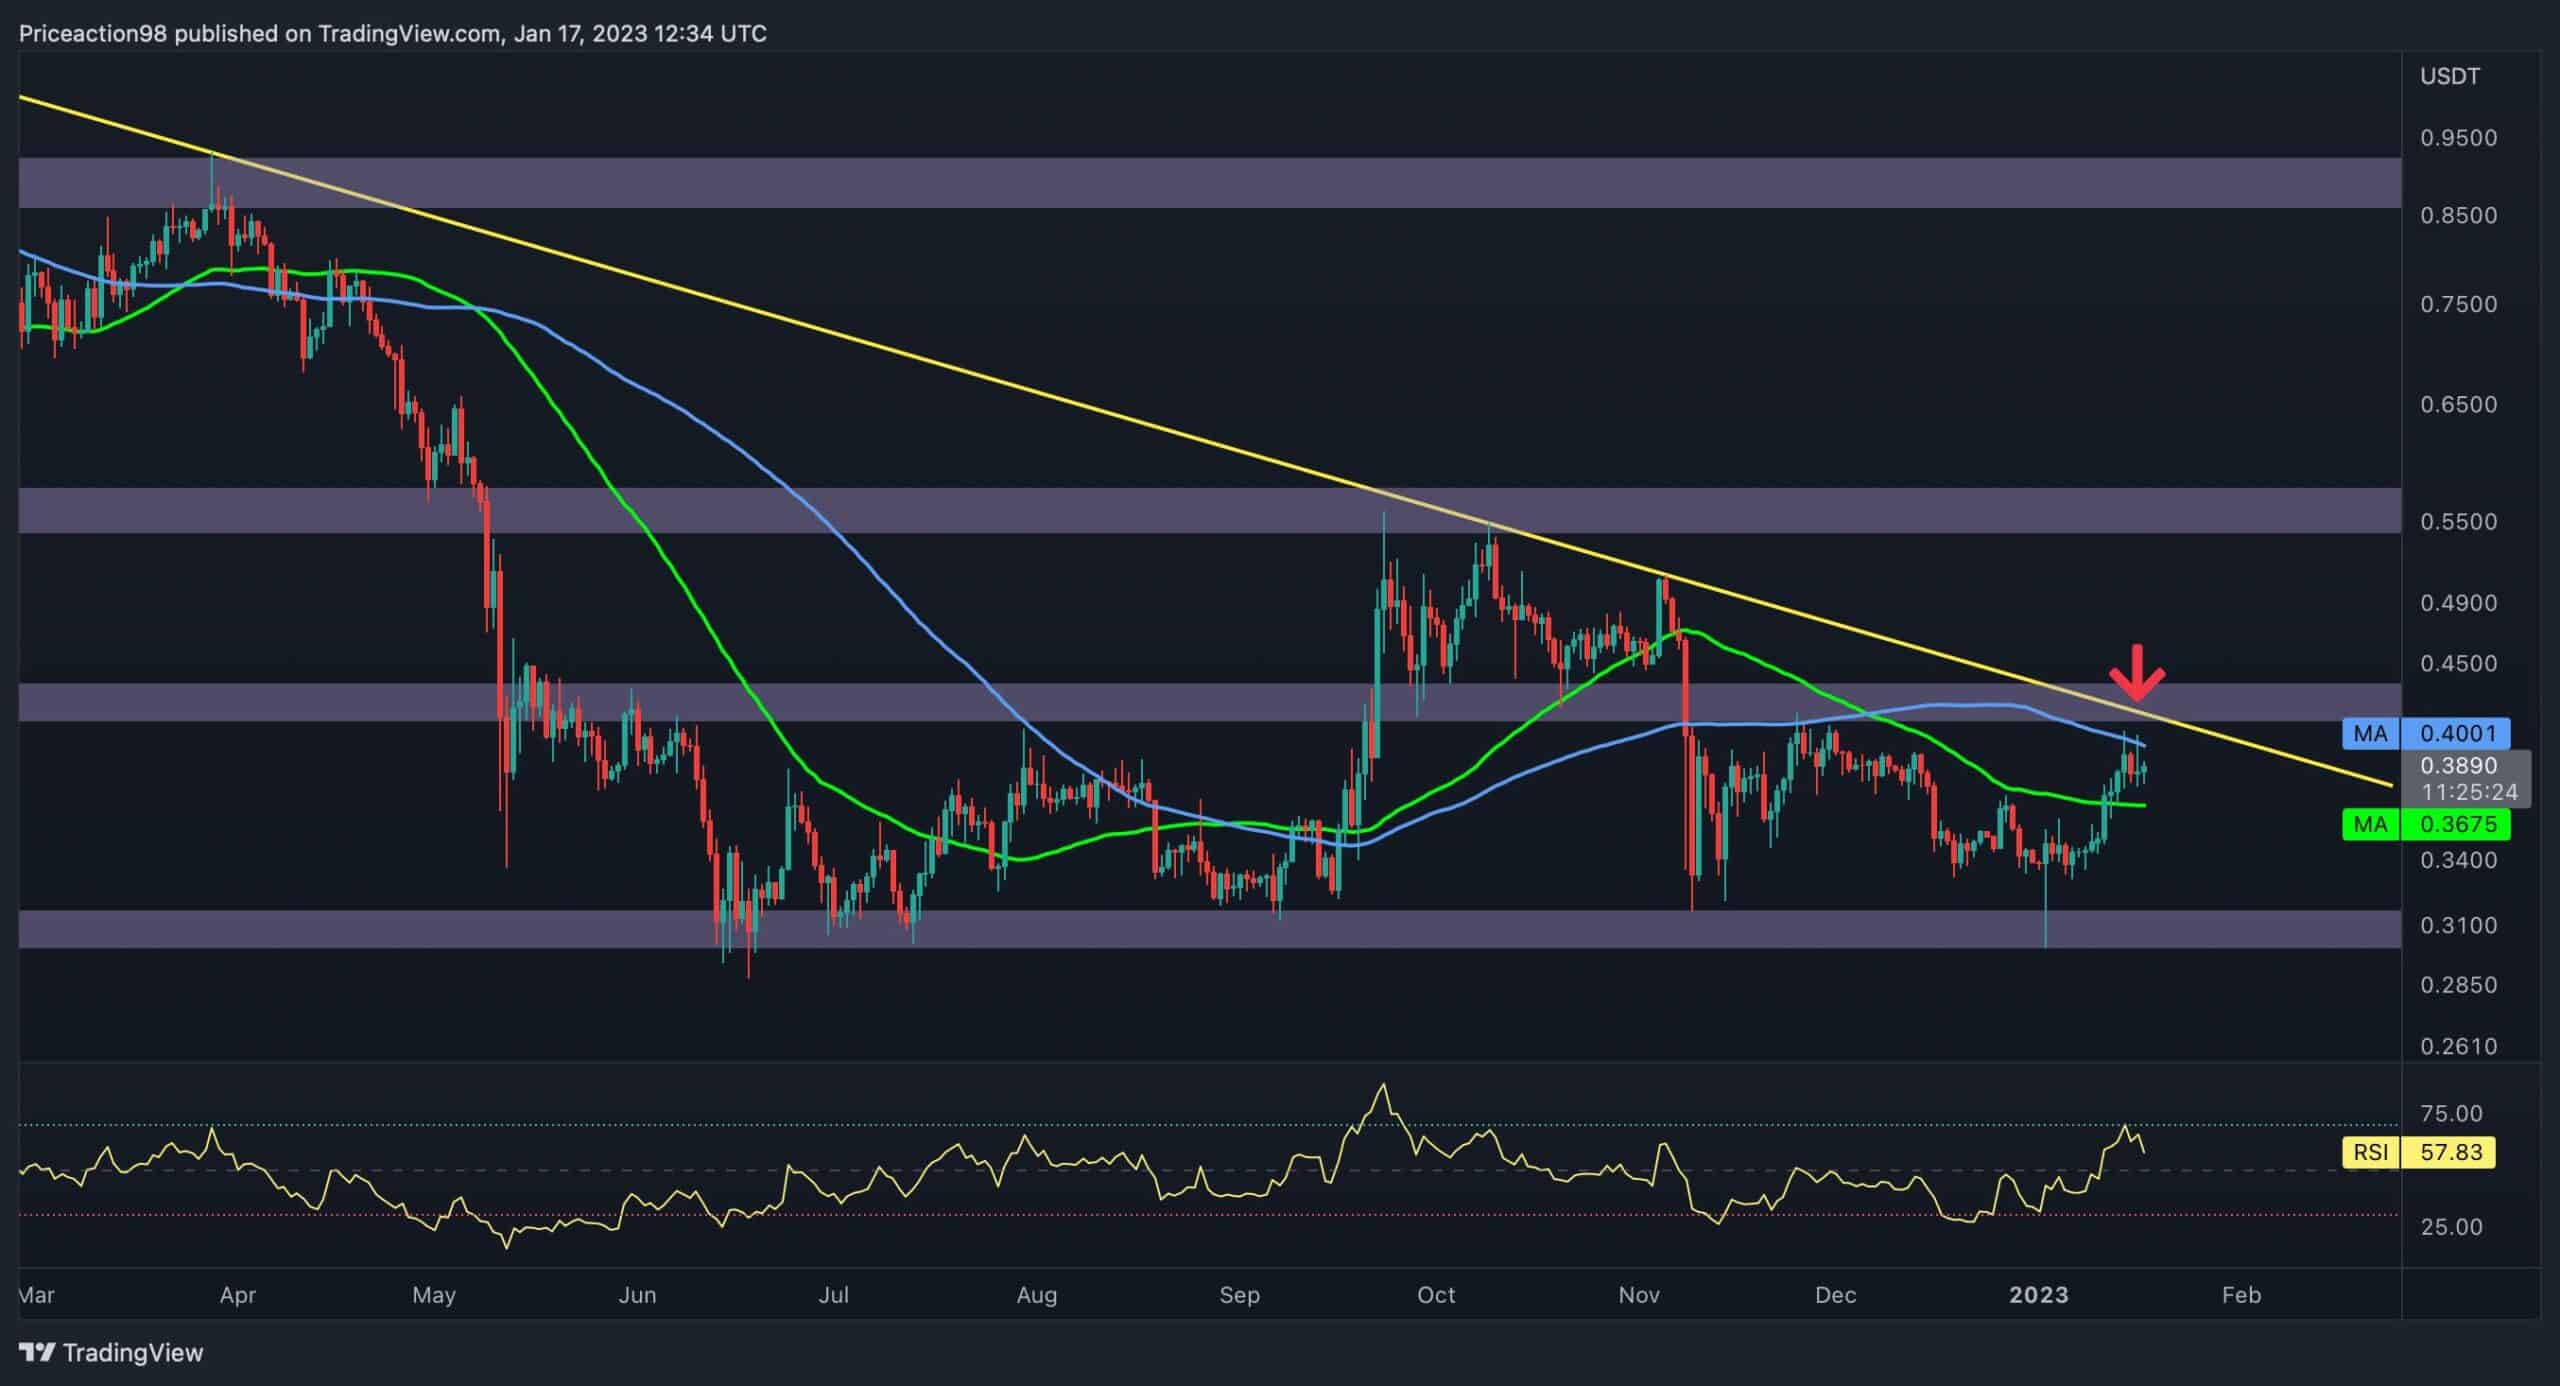
The Daily Chart
The 50-day moving average had been acting as resistance to the price for several months. However, the bulls recently pushed the price above this range. This resulted in a rally toward the next critical resistance level, which stands at $0.4.
Presently, the cryptocurrency is up against a significant resistance region, which includes the 100-day moving average and the static resistance level of $0.5, which also aligns with the channel’s upper trendline.
In case of a breakout from this region, the market should expect a surge toward the next resistance level at $0.55. However, if the price fails to exceed the above-mentioned level, a short-term consolidation would be the most probable outcome.
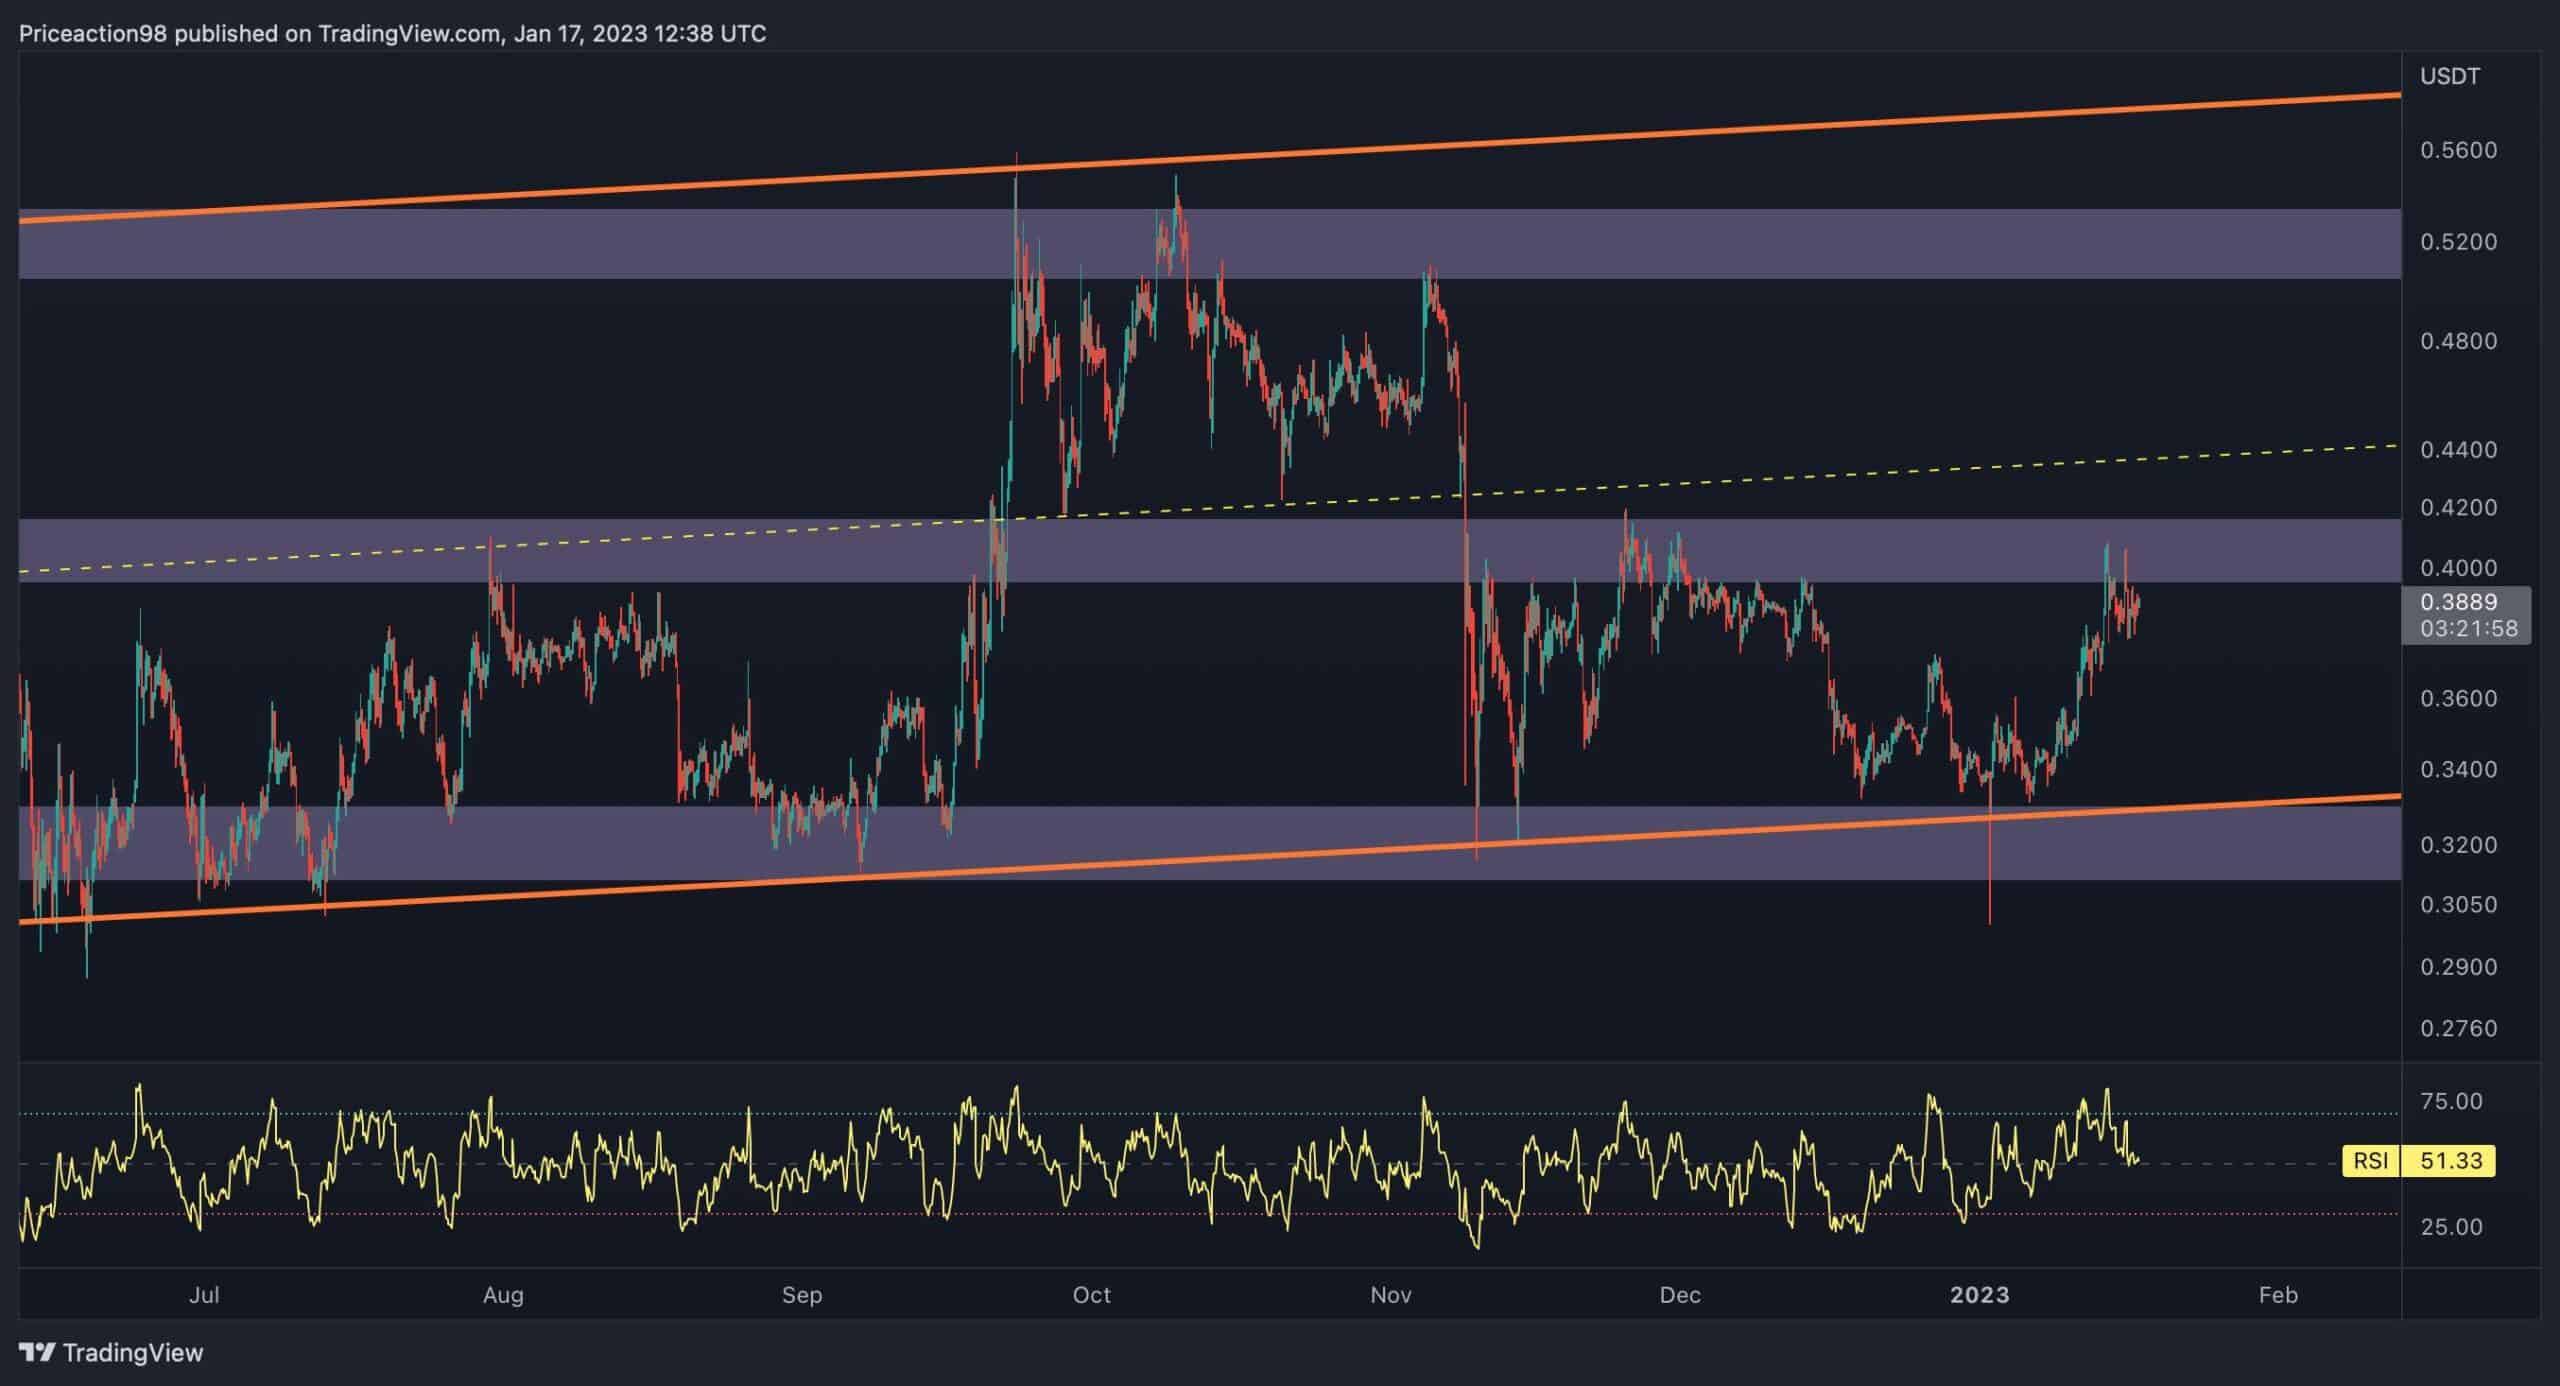
The 4-Hour Chart
In the 4-hour timeframe, the price formed an ascending price channel pattern, and after being supported by the lower trendline, it started moving upward. However, the $0.4 resistance level has paused the rally for now, resulting in short-term price consolidation.
If the cryptocurrency surpasses the $0.4 level, the channel’s middle trendline and the $0.5 levels will be the next obstacles to surpass. On the other hand, if the $0.4 level rejects the price, the channel’s lower boundary will be the next significant support level.