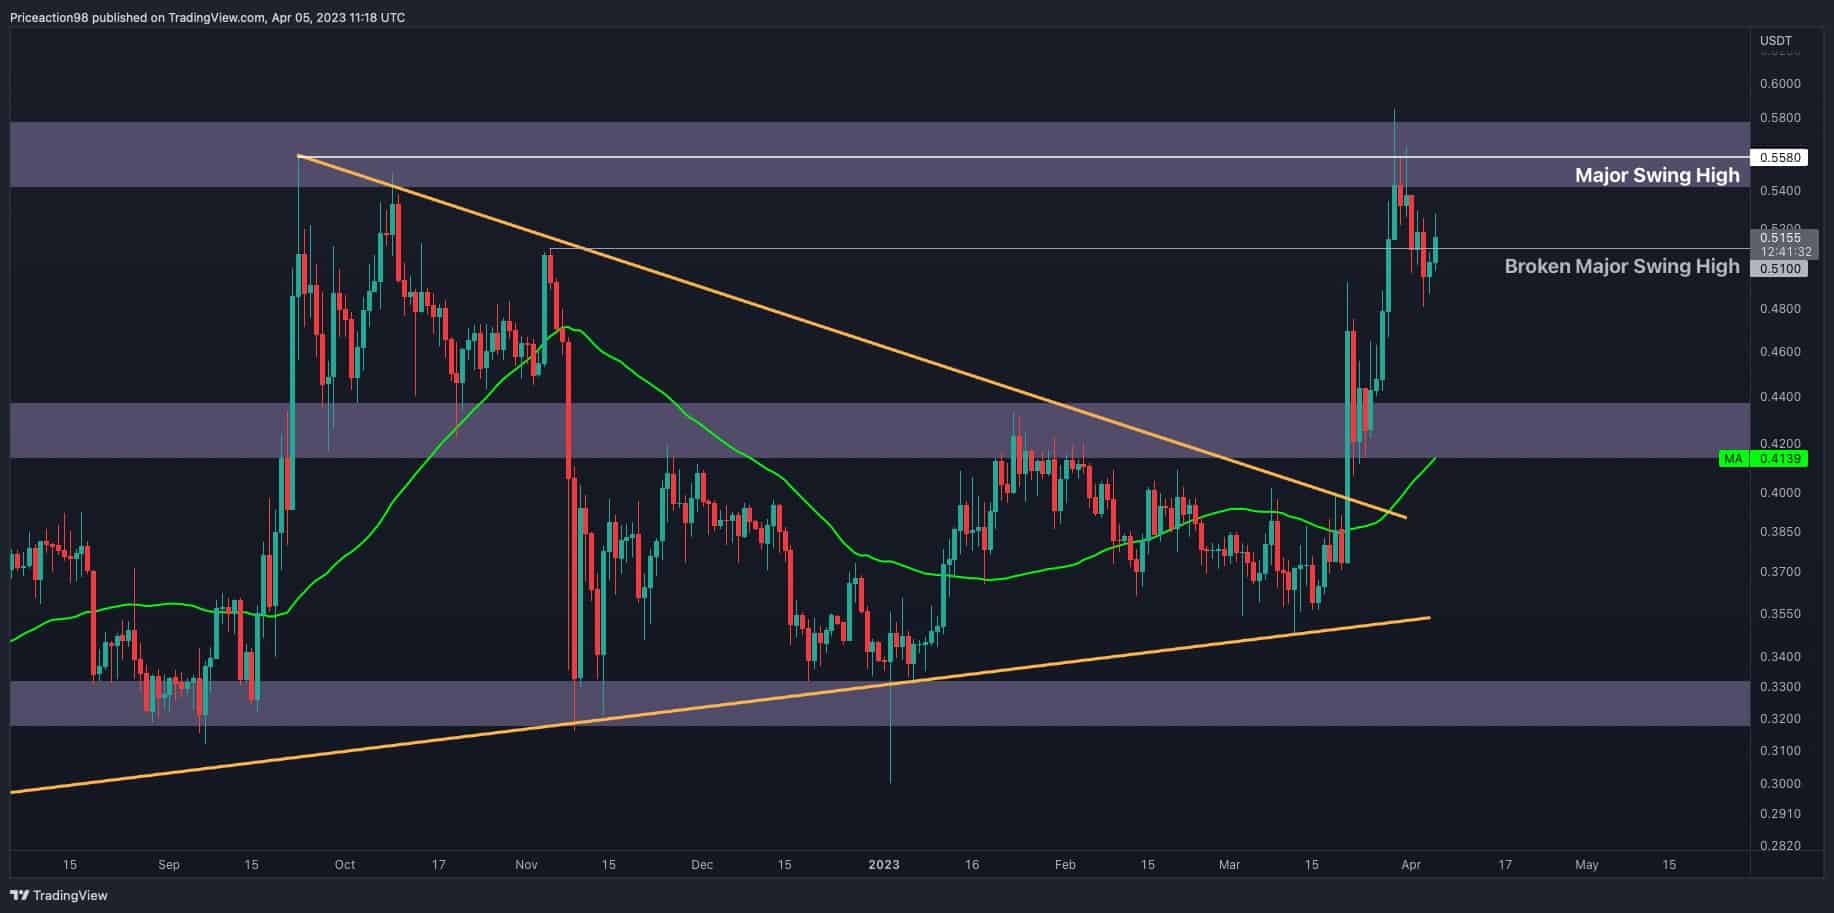
After going through an impulsive bullish rally, Ripple has broken through several resistance levels, such as the 50-day moving average, the multi-month triangle pattern, and its previous major swing highs. However, the price now faces a significant decisive resistance zone at %excerpt%.55. Technical Analysis By Shayan The Daily Chart Following an impulsive spike, the price has claimed many critical resistance levels, creating a bullish sentiment for the cryptocurrency. However, after reaching a significant barrier of around %excerpt%.55, the rally temporarily halted, and the price declined a bit. Although the slight rejection could be seen as a short-term correction before the next climb above the mentioned resistance area, %excerpt%.42 acts as critical support in the event of a sudden drop.
Topics:
CryptoVizArt considers the following as important: Ripple (XRP) Price, XRP Analysis, xrpbtc, xrpusd
This could be interesting, too:
Dimitar Dzhondzhorov writes Is a Major Ripple v. SEC Lawsuit Development Expected This Week? Here’s Why
Mandy Williams writes Ripple Releases Institutional DeFi Roadmap for XRP Ledger in 2025
Dimitar Dzhondzhorov writes Ripple Whales Go on a Selling Spree: Is XRP Headed for a Further Correction?
Jordan Lyanchev writes ChatGPT and DeepSeek Analyze Ripple’s (XRP) Price Potential for 2025
After going through an impulsive bullish rally, Ripple has broken through several resistance levels, such as the 50-day moving average, the multi-month triangle pattern, and its previous major swing highs. However, the price now faces a significant decisive resistance zone at $0.55.
Technical Analysis
By Shayan
The Daily Chart
Following an impulsive spike, the price has claimed many critical resistance levels, creating a bullish sentiment for the cryptocurrency. However, after reaching a significant barrier of around $0.55, the rally temporarily halted, and the price declined a bit.
Although the slight rejection could be seen as a short-term correction before the next climb above the mentioned resistance area, $0.42 acts as critical support in the event of a sudden drop.
This is particularly relevant since the 50-day moving average is currently around $0.42, making it a powerful support level.
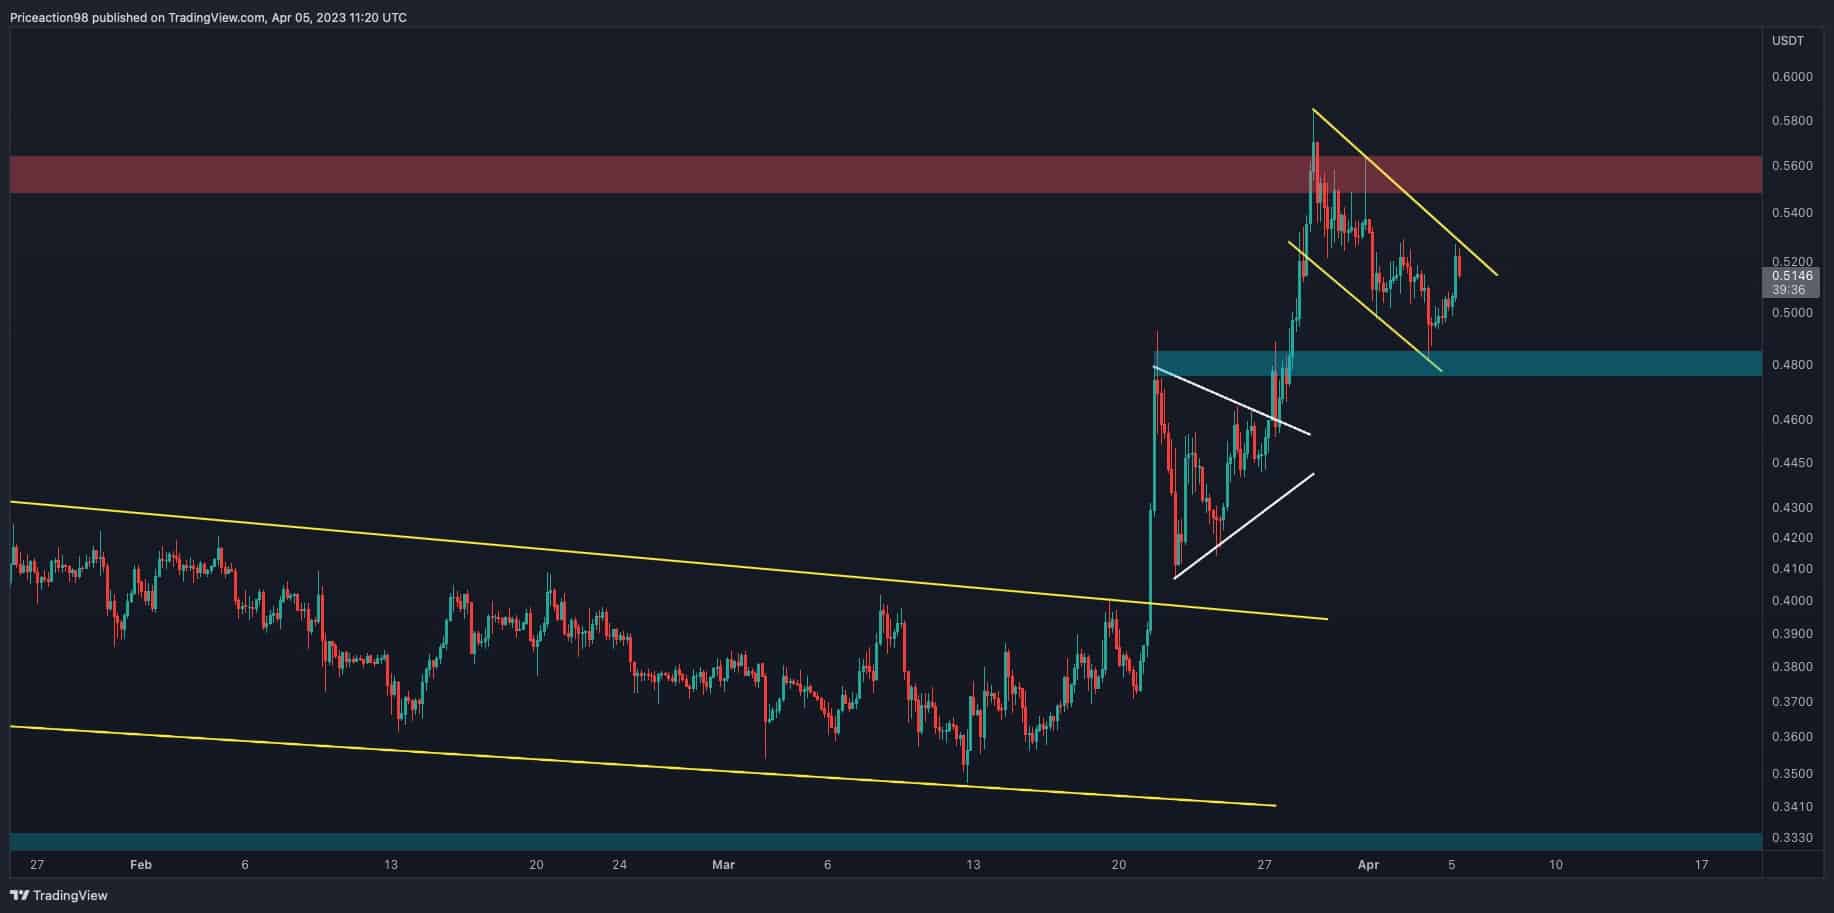
The 4-Hour Chart
Typically, a healthy bullish rally consists of an impulsive phase characterized by a significant surge, followed by a corrective phase, during which the price forms correction patterns.
As illustrated in the chart below, Ripple experienced an impulsive rally, breaking through the descending price channel, and then entered a short-term correction phase, which formed a symmetrical triangle pattern.
Following all this, the cryptocurrency resumed its upward trend by breaking above the triangle’s upper boundary with a strong move. However, when the price reached the critical resistance zone of $0.55, the rally paused, and Ripple entered another correction stage, forming a descending flag pattern.
To summarize, if the price breaks above the flag pattern and claims the $0.55 resistance level, it may trigger an extensive rally. However, the minor $0.48 zone will serve as Ripple’s primary support if rejection occurs.